. 2015 Dec 15;13(10):2203-18.
doi: 10.1016/j.celrep.2015.10.072. Epub 2015 Nov 25.

Asymmetric PI3K Signaling Driving Developmental and Regenerative Cell Fate Bifurcation

Affiliations

Asymmetric PI3K Signaling Driving Developmental and Regenerative Cell Fate Bifurcation

Wen-Hsuan W Lin et al. Cell Rep. .

Abstract

Metazoan sibling cells often diverge in activity and identity, suggesting links between growth signals and cell fate. We show that unequal transduction of nutrient-sensitive PI3K/AKT/mTOR signaling during cell division bifurcates transcriptional networks and fates of kindred cells. A sibling B lymphocyte with stronger signaling, indexed by FoxO1 inactivation and IRF4 induction, undergoes PI3K-driven Pax5 repression and plasma cell determination, while its sibling with weaker PI3K activity renews a memory or germinal center B cell fate. PI3K-driven effector T cell determination silences TCF1 in one sibling cell, while its PI3K-attenuated sibling self-renews in tandem. Prior to bifurcations achieving irreversible plasma or effector cell fate determination, asymmetric signaling during initial divisions specifies a more proliferative, differentiation-prone lymphocyte in tandem with a more quiescent memory cell sibling. By triggering cell division but transmitting unequal intensity between sibling cells, nutrient-sensitive signaling may be a frequent arbiter of cell fate bifurcations during development and repair.


Figures

Figure 1
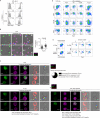
Figure 1. Plasma Cell Determination During Self-renewing B Cell Divisions
(A) Flow cytometric analysis (FACS) of cell division versus Pax5, IRF4 and CD138 expression of CellTrace Violet (CTV)-labeled naive B cells stimulated in vitro with lipopolysaccharide (LPS) for 3.5 days. y-axes display fluorescence intensity of labeled molecules. Cell division x-axes have an inverse (leftward) arrow, denoting that intensity of fluorescent dye covalently bound to intracellular proteins undergoes dilution with each successive cell division. Each dot represents a single cell and numbers displayed adjacent to bound-areas (gates) represent frequency of cells within the gate. (B) FACS of Pax5 and IRF4 during divisions 0–5. Top row: singlet events. Bottom row: doublet events in blue and singlet events in gray contour plots. Data in (A) and (B) are representative of 3 independent experiments. (C) CTV-labeled naive B1-8hi B cells transferred into congenic naive recipients analyzed for cell division versus IRF4, Pax5, and CD138 at indicated times post immunization. (D) Conjoined sibling B cells undergoing cytokinesis following LPS stimulation stained for IRF4, Pax5, and β-tubulin. 5 representative sibling pairs are displayed (n=23 sibling pairs imaged). Scale bars 5 μm. Note that all images with merge of tubulin and transmitted light represent a single focal plane, making tubulin occasionally appear unequal. Pie charts summarize frequency of cells with asymmetric IRF4 and Pax5 amongst pairs with high IRF4 levels. 100% of conjoined sibling pairs with asymmetric Pax5 had higher IRF4 in the sibling with lower Pax5 (P<0.001 compared to tubulin). 87% of sibling pairs with asymmetric IRF4 had higher Pax5 levels in the sibling with lower IRF4 (P<0.001 compared to tubulin). Graph displays the ratio of total IRF4 and Pax5 fluorescence in each sibling pair. (E) B1-8hi naive B cells from heterozygous YFP-Bcl6 knockin mice were transferred to congenic recipients. 4 or 6 days post immunization, donor NP+YFP-Bcl6 B cells were sorted and stained for IRF4, Pax5, and β-tubulin. Images depict 5 representative sibling pairs with opposing Pax5 and IRF4 (n=16 total sibling pairs imaged). Upper charts summarize overall incidence of IRF4 and Pax5 asymmetry (P<0.001 for each compared to tubulin). Bottom chart summarizes frequency of conjoined sibling pairs with symmetric high IRF4 (32%), symmetric Pax5 (18%), or opposite IRF4 and Pax5 (50%) (n=40 sibling pairs). Graph displays ratio of total IRF4 and Pax5 fluorescence for conjoined sibling pairs with asymmetric IRF4. See also Figure S1.
Figure 2
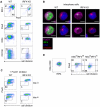
Figure 2. Asymmetric PI3K Signaling during B Cell Divisions
(A) B cells from homozygous GFP-c-Myc knockin mice stimulated for 2 days with LPS in the presence or absence of inhibitors of AKT (0.1 μM) or mTOR (0.05 μM). FACS of GFP-c-Myc fusion protein and IRF4 protein displayed as histograms. (B) Confocal image analysis of FoxO1 and IRF4 expression in singlet B cells from cultures stimulated for 3.5 days with LPS. Two sets of images depict multiple examples of IRF4int cells with nuclear FoxO1 as well as IRF4hi cells with cytoplasmic FoxO1. Graph summarizes IRF4 intensity (y-axis) of individual interphase cells with indicated FoxO1 localization (n=39 cells with nuclear (N) FoxO1; n=28 cells with cytoplasmic (C) FoxO1; mean ± S.D.). Scale bars 5 μm. (C) Top panels: B cells stimulated for 3.5 days with LPS. Cells were sorted and stained for FoxO1, IRF4, and β-tubulin. 2 representative sibling pairs with concordant asymmetric IRF4 and cytoplasmic FoxO1 are displayed (n=11 total conjoined sibling pairs). Chart summarizes siblings with asymmetric IRF4. 64% of sibling pairs with asymmetric IRF4 had concordant IRF4 and cytoplasmic FoxO1, 9% of sibling pairs had opposite IRF4 and cytoplasmic FoxO1, 27% of sibling pairs had nuclear FoxO1 in both siblings, and 0% had cytoplasmic FoxO1 in both siblings. Bottom panels: CD45.1+ B1-8hi B cells from congenic recipient on day 6 post immunization. Cells were sorted and stained for FoxO1, IRF4, and β-tubulin. Two representative sibling pairs with concordant asymmetric IRF4 and cytoplasmic FoxO1 displayed (n=6 sibling pairs). 100% of sibling pairs with asymmetric IRF4 had concordant cytoplasmic/nuclear FoxO1 disparity, 0% of sibling pairs had opposite IRF4 and cytoplasmic FoxO1, and 0% of sibling pairs had nuclear FoxO1 in both siblings or cytoplasmic FoxO1 in both siblings. (D) FACS of CTV-labeled B cells stimulated with LPS for 3.5 days in the presence or absence of indicated inhibitors of PI3K (0.1 μM), AKT (0.05 μM), mTOR (0.1 μM), and FoxO1 (1.0 μM). Data representative of 3 similar experiments. (E) Left: Cell division versus Pax5 in naive B cells stimulated with LPS for 60 hours in the presence or absence of FoxO1 inhibitor (1.0 μM). Right: FACS of IRF4 and Pax5 for divisions 3 to 5 of CTV-labeled naive B cells stimulated with LPS in the presence or absence of FoxO1 inhibitor (1.0 μM). Data representative of 3 experiments. (F) On day 3.5 of LPS stimulation, B cells in divisions 0–3 were purified by FACS and stained for FoxO1, IRF4 and β-tubulin. Two representative sibling pairs with asymmetric IRF4int levels and nuclear FoxO1 are displayed (n=13 sibling pairs). 69% of sibling pairs with asymmetric IRF4 showed nuclear FoxO1 in both siblings. 31% of siblings pairs with asymmetric IRF4 had cytoplasmic/nuclear FoxO1 disparity. None of the siblings with asymmetric IRF4 had cytoplasmic FoxO1 in both siblings. Scale bars 5 μm. See also Figure S2.
Figure 3
Figure 3. Nutrient-sensitive Asymmetry Coupling Cell State and Cell Fate
(A) FACS of CTV-labeled B cells from wild-type (WT) or IRF4 knockout (KO) mice stimulated with LPS for 3.5 days. Data representative of 2 similar experiments. (B) Representative LPS stimulated B cells from WT and IRF4 KO mice were analyzed for FoxO1, IRF4, DNA, and β-tubulin and imaged by confocal microscopy (n=10 cells per genotype). Images collected on a Nikon Ti Eclipse confocal microscope. (C) FACS of CTV-labeled WT or IRF4 KO B cells stimulated with LPS in the presence or absence of the FoxO1 inhibitor (1.0 μM) for 3 or 4 days. Data representative of 3 experiments. (D) CTV-labeled naive B cells stimulated with LPS for 3.5 days and stained with MitoTrackerCMXRos dye (MitoCMX) to measure mitochondrial membrane potential. Left FACS: IRF4 versus MitoTrackerCMXRos. Right: two populations of cells based on levels of IRF4 and MitoTrackerCMX (Mito) dye were analyzed for cell division versus Pax5. Data representative of 2 separate experiments. See also Figure S3.
Figure 4
Figure 4. Bifurcating Germinal Center B Cell Fates during Cell Division
(A) Heterozygous YFP-Bcl6 knock-in B1-8hi donor B cells were sorted from recipients 6 days after immunization. Images depict sibling cells undergoing cytokinesis stained for YFP-Bcl6 fusion protein, c-Myc, and α-tubulin (n=5 sibling pairs), YFP-Bcl6, IRF4, and β-tubulin (n=4 sibling pairs), or YFP-Bcl6, Pax5, and α-tubulin (n=36 sibling pairs). Graphs summarize ratios of total fluorescence of molecules indicated. 100% of cells with high c-Myc levels had reciprocally asymmetric Bcl-6 and 100% of cells with high IRF4 had IRF4 asymmetry, 75% of which had reciprocally asymmetric Bcl-6. Pie charts summarize the frequency of conjoined sibling pairs with asymmetric Bcl6 or Pax5. 39% of sibling pairs imaged had asymmetric YFP-Bcl6 and if both Pax5 and Bcl6 were asymmetric there was 100% concordance of their expression. No sibling pairs had non-concordant asymmetry of Pax5 and Bcl6. Graph of ratios for Bcl6 and Pax5 summarizes data from cells with asymmetric Bcl6. Scale bars 5 μm. (B) FACS of donor B1-8hi B cells 6 days post immunization, depicting expression of IRF4 and c-Myc in GC B cells (CD45.1+CD45.2GL7+CD38). The majority of c-Myc+ singlet and doublet cells co-expressed IRF4. IRF4hic-Myclo cells co-expressed CD138 (not shown), a marker of terminally differentiated plasma cells. (C) Donor B1-8hi B cells were purified (CD45.1+NP+) by FACS from congenic recipients 6 days post immunization. Left panels: representative images depict interphase cells stained for (left-to-right) IRF4 alone, Pax5 alone, and merge (n=11; 100% of cells with high-level IRF4 staining had absent Pax5 staining). Right panels: representative images depict interphase cells stained for (left-to-right) IRF4 alone, FoxO1 alone, and merge (n=14; 100% of cells with high-level IRF4 staining had FoxO1 nuclear exclusion). Images are cropped from 3 larger images collected for each set of stains. Scale bars 5 μm.
Figure 5
Figure 5. Effector T Cell Determination During Self-renewing Divisions
(A) Upper rows: Cell division versus TCF1 expression in donor CD8+ T cells at indicated times after primary immune response. Naïve P14 CD8+ T cells were transferred to congenic mice that were then infected with Listeria monocytogenes expressing gp33-41 (LMgp33) or lymphocytic choriomenigitis virus (LCMV). Lowest plot: KLRG1 versus TCF1. Data representative of 3 separate experiments. (B) Left: confocal images of representative sibling CD8+ T cells with asymmetric TCF1 expression after LCMV infection or in vitro activation. Right: Graphs summarizing TCF1 microscopy data from donor P14 T cells 3-4 days post infection challenges or naive P14 T cells activated with gp33 peptide/splenocytes for 3 days. Cells were stained for TCF1, α-tubulin, and DNA. Asymmetric TCF1 expression was found in conjoined siblings after listeria infection (62%; n=34 sibling pairs), LCMV infection (75%; n=33 sibling pairs) and in vitro stimulation (55%; n=29 sibling pairs). Scale bars 5 μm. Graphs display the ratio of total TCF1 fluorescence in each sibling pair. Charts summarize the overall incidence of TCF1 asymmetry. (C) FACS of donor P14 T cells 3 days after primary listeria infection. Data representative of 4 experiments. (D) Confocal analysis of IRF4 intensity of singlet cells with indicted TCF1 status among donor P14 T cells 3-4 days after primary listeria infection. TCF1 hi n=11; TCF1 lo n=17. (E) Reciprocal IRF4 and TCF1 abundance in sibling donor P14 T cells 3-4 days after primary infection. Graph shows ratio of total IRF4 fluorescence in each sibling pair. Left chart summarizes the overall incidence of IRF4 asymmetry (52%; n=25 sibling pairs). Right chart summarizes frequency of conjoined siblings with opposite IRF4 and TCF1 (61%), concordant IRF4 and TCF1 (15%) and symmetric TCF1 (23%) amongst pairs with asymmetric IRF4. See also Figure S4.
Figure 6
Figure 6. Asymmetric PI3K Signaling Bifurcating T Cell Fates
(A) Nutrient-sensitive signaling driving TCF1 repression. Naïve CD8+ T cells were stimulated with plate bound anti-CD3 and soluble anti-CD28 for 6.5 days, and memory P14 T cells were re-stimulated with gp33 peptide for 4.5 days in the absence or presence of inhibitors of PI3K (5μM) and mTOR (0.5μM). (B) Microscopy of IRF4 and FoxO1 expression in conjoined sibling donor T cells 3-4 days after primary LMgp33 infection or naive P14 T cells 3 days after in vitro stimulation. 2 representative sibling pairs with asymmetric IRF4 and concordant cytoplasmic FoxO1 are displayed (n=33 and n=19 conjoined sibling pairs from listeria infection and in vitro activation, respectively). Charts display frequency of IRF4 and FoxO1 cytoplasmic/nuclear asymmetry. IRF4 asymmetry in conjoined sibling cells: 63% after listeria infection and 68% after in vitro activation. Of cells with asymmetric IRF4, 62% (top; listeria) and 77% (bottom; in vitro) of conjoined siblings had asymmetric FoxO1 with higher IRF4 in cell with cytoplasmic FoxO1. 28% (listeria infection) and 15% (in vitro) of sibling pairs had nuclear FoxO1 in both cells. No pairs with asymmetric IRF4 had cytoplasmic FoxO1 in both cells. (C) c-Myc expression is PI3K- and mTOR-sensitive. GFP-c-Myc P14 T cells were stimulated with gp33 peptide in the presence or absence of PI3K (5 μM) and mTOR (0.5 μM) inhibitors for 48 hours. (D) 2 representative conjoined sibling pairs with reciprocal abundance of c-Myc and TCF-1 from naive GFP-c-Myc P14 T cells activated in vitro for 3 days and sorted for the 4th division onward. Left chart has overall incidence of c-Myc asymmetry (58%; n=26 sibling pairs). Right chart summarizes frequency of conjoined sibling pairs that had opposite c-Myc and TCF1 (67%), concordant c-Myc and TCF1 (20%) and symmetric TCF1 (13%) amongst pairs with asymmetric c-Myc. (E) T cells from P14 GFP-c-Myc mice activated in vitro in absence or presence of rapamycin (0.5 μM) for 3 days and sorted from the 4th division onward. Representative cytokinetic pairs with dampened c-Myc and symmetric TCF1 in rapamycin-treated group. Graph shows ratio of TCF1 fluorescence in each sibling pair in the absence (n=26 sibling pairs) or presence (n=17 sibling pairs) of rapamycin. Charts depict incidence of TCF1 asymmetry in rapamycin treated (6%) and untreated (62%) cultures. Data representative of 2 similar experiments.
Figure 7
Figure 7. PI3K-driven Branching in Early B and T Cell Fate Specification
(A) Asymmetric IRF4 and c-Myc divisions in sibling T cells prior to TCF1 loss or FoxO1 inactivation. Naïve P14 or polyclonal CD8+ T cells activated in vitro after 30 to 40 hours, when cells have undergone 1–3 divisions. Graphs with ratio of TCF1, IRF4 and c-Myc fluorescence in each sibling pair. 25%, 47% and 44% of conjoined siblings had TCF1, IRF4 and c-Myc asymmetry (n=25, 43, 24 sibling pairs, respectively). Of siblings that both retain TCF1 expression, 57% of pairs had IRF4 asymmetry (n=16) and 60% of pairs had c-Myc asymmetry (n=15). Of sibling pairs that had asymmetric IRF4 and c-Myc, 83% had concordant asymmetry. 50% of sibling pairs had nuclear/nuclear FoxO1 in both cells; 31% of pairs had asymmetric nuclear/cytoplasmic FoxO1 and 19% of pairs had cytoplasmic FoxO1 in both cells (n=16 cell pairs imaged). IRF4 asymmetry occurred in 50% of siblings with bilateral nuclear FoxO1, 80% of siblings with asymmetric FoxO1, and 33% of siblings with bilateral cytoplasmic FoxO1. (B) Splenic versus bone marrow (BM) localization of P14 T cells 3 days after primary or secondary challenges. (C) Asymmetric IRF4 divisions in sibling B cells prior to Pax5 loss. Left: 2 representative conjoined sibling B cell pairs (n=5 sibling pairs) from first 3 divisions of B cells stimulated with LPS for 3.5d. Charts depict frequency of sibling pairs with asymmetric IF4 or Pax5. 80% of cells had asymmetric IRF4. Graph summarizes the ratios of IRF4 and Pax5 amongst sibling pairs. Right: 2 representative conjoined sibling B cell pairs (B1-8hi) from congenic donors 3 days post immunization (n=11 sibling pairs). Charts depict frequency of sibling pairs with asymmetric IF4 or Pax5 (For IRF4, P<0.001 compared to tubulin). 100% of sibling pairs had asymmetric IRF4. Graph summarizes ratios of IRF4 and Pax5 among sibling pairs. Scale bars 5 μm. (D) Cell division versus Embigin expression of donor B1-8hi B cells 3 days post immunization. (E) Cell division versus Embigin and B220 in WT and IRF4 KO LPS-activated B cells after 3.5 days. All data representative of at least 2 experiments.

References

    1. Araki K, Turner AP, Shaffer VO, Gangappa S, Keller SA, Bachmann MF, Larsen CP, Ahmed R. mTOR regulates memory CD8 T-cell differentiation. Nature. 2009;460:108–112. - PMC - PubMed
    1. Arsenio J, Kakaradov B, Metz PJ, Kim SH, Yeo GW, Chang JT. Early specification of CD8+ T lymphocyte fates during adaptive immunity revealed by single-cell gene-expression analyses. Nature immunology. 2014;15:365–372. - PMC - PubMed
    1. Barnett BE, Ciocca ML, Goenka R, Barnett LG, Wu J, Laufer TM, Burkhardt JK, Cancro MP, Reiner SL. Asymmetric B cell division in the germinal center reaction. Science. 2012;335:342–344. - PMC - PubMed
    1. Basso K, Dalla-Favera R. Germinal centres and B cell lymphomagenesis. Nature reviews Immunology. 2015;15:172–184. - PubMed
    1. Bird JJ, Brown DR, Mullen AC, Moskowitz NH, Mahowald MA, Sider JR, Gajewski TF, Wang CR, Reiner SL. Helper T cell differentiation is controlled by the cell cycle. Immunity. 1998;9:229–237. - PubMed

Publication types

Substances

Associated data