. 2015 Dec 15;13(10):2147-58.
doi: 10.1016/j.celrep.2015.10.077. Epub 2015 Nov 25.

Identification of Different Classes of Luminal Progenitor Cells within Prostate Tumors

Affiliations

Identification of Different Classes of Luminal Progenitor Cells within Prostate Tumors

Supreet Agarwal et al. Cell Rep. .

Abstract

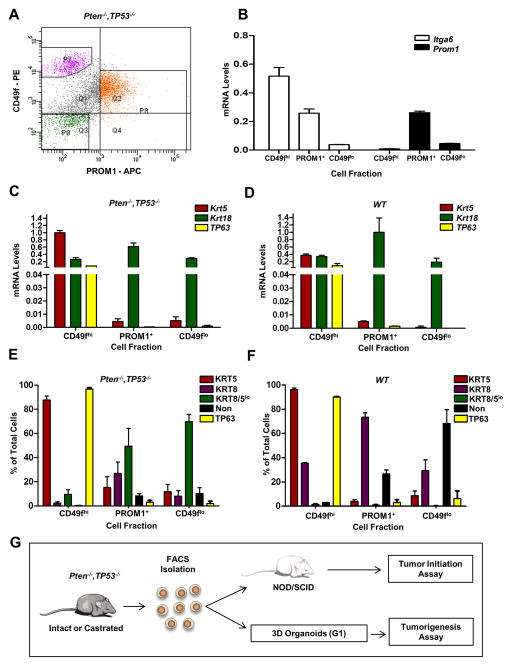
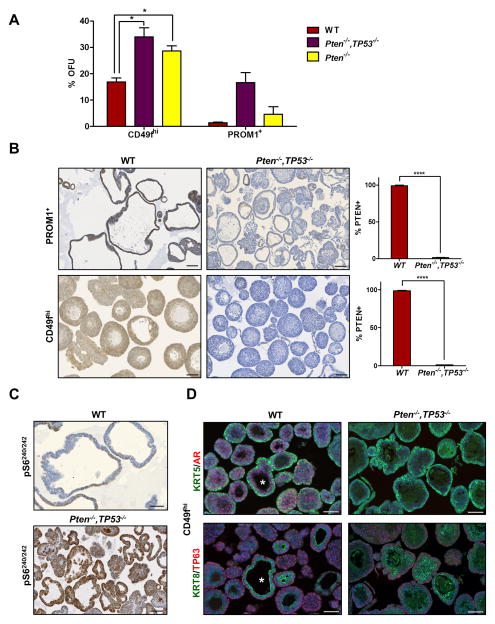
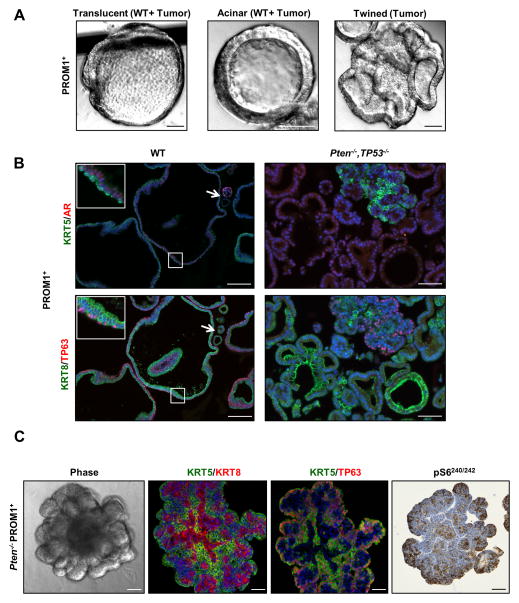
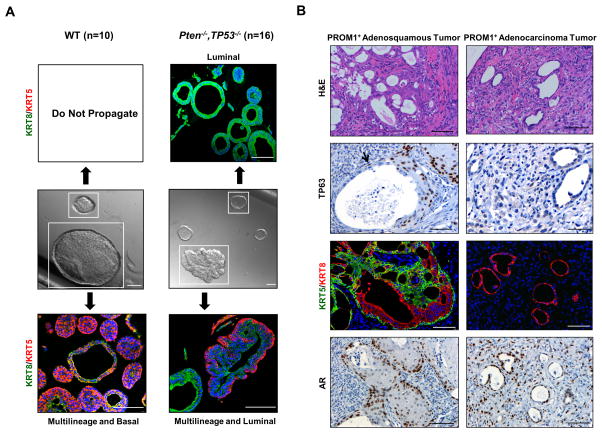
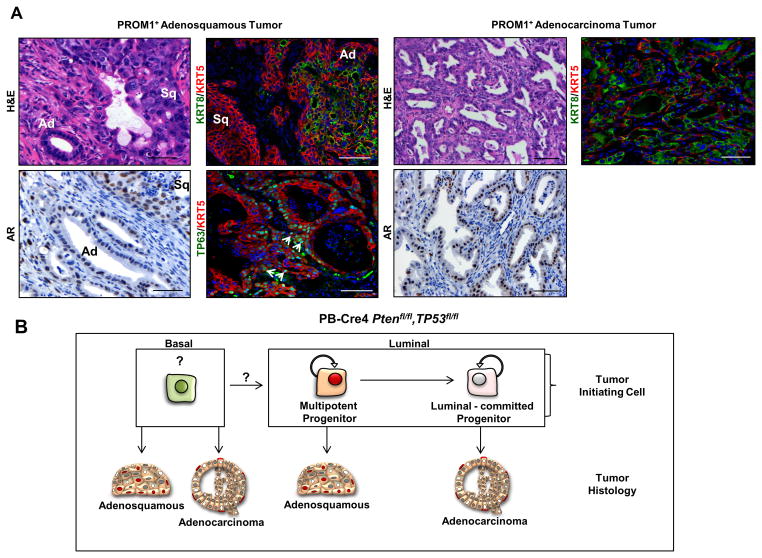
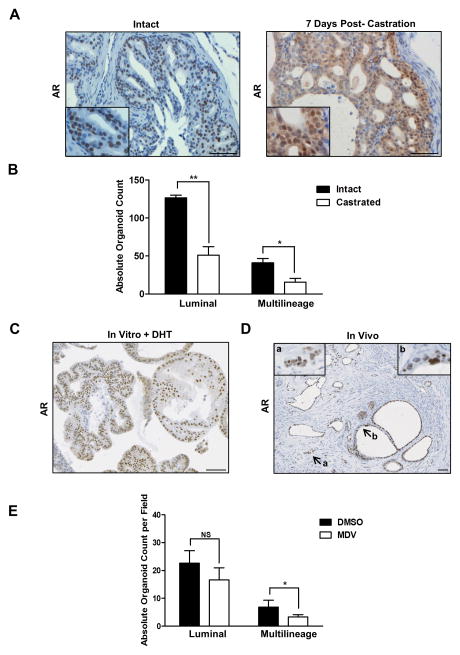
Primary prostate cancer almost always has a luminal phenotype. However, little is known about the stem/progenitor properties of transformed cells within tumors. Using the aggressive Pten/Tp53-null mouse model of prostate cancer, we show that two classes of luminal progenitors exist within a tumor. Not only did tumors contain previously described multipotent progenitors, but also a major population of committed luminal progenitors. Luminal cells, sorted directly from tumors or grown as organoids, initiated tumors of adenocarcinoma or multilineage histological phenotypes, which is consistent with luminal and multipotent differentiation potentials, respectively. Moreover, using organoids we show that the ability of luminal-committed progenitors to self-renew is a tumor-specific property, absent in benign luminal cells. Finally, a significant fraction of luminal progenitors survived in vivo castration. In all, these data reveal two luminal tumor populations with different stem/progenitor cell capacities, providing insight into prostate cancer cells that initiate tumors and can influence treatment response.

Keywords: castration; heterogeneity; luminal; prostate cancer; stem/progenitor cells.


Conflict of interest statement

CONFLICT OF INTEREST

The authors declare no conflict of interest.

Figures

Figure 1
Figure 1. CD49f and PROM1 fractionate EpCAM+ Pten−/−, Tp53−/− prostate basal and luminal progenitor populations
(A) Representative FACS plot of CD49f and PROM1 staining of primary EpCAM+ Pten−/−, Tp53−/− prostate cells. P7 (purple)= CD49fhi; P8 (orange)= PROM1+; P9 (green)=CD49flo PROM1neg. (B) qRT-PCR analysis of Itga6 and Prom1 gene expression from the indicated cell fractions. RNA levels were normalized to Gapdh. (C&D) qRT-PCR analysis of lineage marker genes in the indicated cell fractions of Pten−/−, Tp53−/− (C) and WT (D) prostates. The data is reported as mean ± SEM. (E&F) Quantification by immunofluorescent staining of TP63+ KRT5+, KRT8+, and KRT8+/KRT5+ cells in the indicated fractions isolated from primary Pten−/−, Tp53−/− (E) and WT (F) prostate tissue. The average of three independent experiments is shown. The data is reported as mean ± SEM. (G) Schematic showing that cells from Pten−/−, Tp53−/− prostates were fractionated and assayed for organoid formation or were transplanted directly into NOD/SCID mice for tumor initiation assays. G1 organoids were harvested, dissociated and transplanted in vivo to assess tumorigenesis. See also Figures S1 and S2.
Figure 2
Figure 2. Tumor-derived basal and luminal progenitors are almost all PTEN null
(A) Comparison of first generation organoid formation from wild type (WT), Pten−/−, and Pten−/−, Tp53−/− CD49fhi and PROM1+ cells. Data is reported as mean % OFU ± SEM. (B) IHC images of WT and Pten−/−, Tp53−/− CD49fhi and PROM1+ organoids stained for PTEN and quantification of PTEN+ organoids in each fraction. Data is reported as %PTEN+ organoids ± SEM. Scale bars = 100 μm. (C) IHC images of pS6240/242 expression in WT, and Pten−/−, Tp53/, PROM1+ organoids. Scale bars = 50 μm. (D) Representative IF (KRT5 and AR), and (KRT8 and TP63) images of G1 WT and Pten−/−, Tp53−/− CD49fhi organoids. * indicates a multilineage organoid. Scale bars = 50 μm. See also Figures S3 and S4.
Figure 3
Figure 3. PROM1+ progenitors show heterogeneous phenotypes in organoid culture
(A) Representative phase images of first generation translucent, acinar and twined organoids generated from PROM1+ cells. Organoid morphologies are observed in wild-type (WT) and Pten−/−, Tp53−/− tumor fractions as indicated. Scale bars = 50 μm. (B) Representative IF (KRT5 and AR), and (KRT8 and TP63) images of G1 WT and Pten−/−, Tp53−/− PROM1+ organoids. The arrow indicates a luminal WT organoid. Scale bars = 50 μm. (C) Representative phase, IF (KRT5+KRT8 or KRT5+TP63) and IHC (pS6240/242 ) images of G1 Pten−/− PROM1+ multi-lobulated structures. Scale bars = 50 μm. See also Figure S4.
Figure 4
Figure 4. Differentiation potential of multilineage and luminal organoids in vitro and in vivo
(A) Representative phase images of G1 organoids isolated from WT and Pten−/−, Tp53−/− PROM1+ cells, and IF (KRT5+KRT8) confocal images of daughter organoids generated from the cloned organoids. Scale bars = 100 μm. Note that there are relative differences in magnification for the panels shown. (B) Representative H&E, IHC (TP63 and AR), and IF (KRT5+KRT8) images of regions of adenosquamous (left panels) and adenocarcinoma (right panels) in tumors generated from G1 PROM1+ organoids. The black arrow indicates nuclear TP63 labeling of cells situated along the basement membrane adjacent to an adenocarcinoma gland. Scale bars = 50 μm.
Figure 5
Figure 5. PROM1+ cells demonstrate luminal-committed and multilineage tumor-initiating activity in vivo
Representative H&E, IHC (AR) and IF (KRT5+KRT8 or KRT5+TP63) staining of regions of adenosquamous (left panels) or adenocarcinoma (right panels) from tumors initiated from Pten−/−, Tp53−/− PROM1+ cells. White arrows indicate nuclear TP63 staining in adenosquamous tumors. TP63 staining was not observed in adenocarcinoma. Ad = adenocarcinoma region, Sq = squamous carcinoma. Scale bars = 50 μm. (B) Schematic representation of clonally-initiated in vitro progenitor activity and tumor phenotypes originating from luminal and basal fractions of Pten−/−Tp53−/− tumors. See also Figure S5.
Figure 6
Figure 6. A fraction of PROM1+ stem/progenitor cells are castration-tolerant
(A) IHC images of AR staining of Pten−/−, Tp53−/− prostate tissue from intact animals or 7 days post-castration. Scale bars = 50 μm. (B) Histological comparison of PROM1+organoids generated from intact and castrated Pten−/−, Tp53−/− prostate. (C) Representative IHC AR staining of PROM1+ organoids generated from castrated Pten−/−, Tp53−/− prostate. Scale bars = 50 μm. (D) Representative IHC AR staining in tumors generated from castrate Pten−/−, Tp53−/− G1 PROM1+ organoids. Insert a shows invasive cells; insert b shows nuclear atypia. Scale bars = 50 μm. (E) Histological comparison of PROM1+organoids generated from castrated Pten−/−, Tp53−/− prostate following Enzalutamide treatment and growth for 7 days. ** = p< 0.01, *= p< 0.05. See also Figure S6.

Comment in

References

    1. Abou-Kheir WG, Hynes PG, Martin PL, Pierce R, Kelly K. Characterizing the contribution of stem/progenitor cells to tumorigenesis in the Pten−/−TP53−/− prostate cancer model. Stem Cells. 2010;28:2129–2140. - PMC - PubMed
    1. Blanpain C, Fuchs E. Stem cell plasticity. Plasticity of epithelial stem cells in tissue regeneration. Science. 2014;344:1242281. - PMC - PubMed
    1. Bonizzi G, Cicalese A, Insinga A, Pelicci PG. The emerging role of p53 in stem cells. Trends Mol Med. 2011;18:6–12. - PubMed
    1. Boutros PC, Fraser M, Harding NJ, de Borja R, Trudel D, Lalonde E, Meng A, Hennings-Yeomans PH, McPherson A, Sabelnykova VY, et al. Spatial genomic heterogeneity within localized, multifocal prostate cancer. Nat Genet. 2015;47:736–745. - PubMed
    1. Chen Z, Trotman LC, Shaffer D, Lin HK, Dotan ZA, Niki M, Koutcher JA, Scher HI, Ludwig T, Gerald W, et al. Crucial role of p53-dependent cellular senescence in suppression of Pten-deficient tumorigenesis. Nature. 2005;436:725–730. - PMC - PubMed

Publication types