. 2015 Dec 1;8(405):ra123.
doi: 10.1126/scisignal.aab4068.

Distinct profiles of functional discrimination among G proteins determine the actions of G protein-coupled receptors

Affiliations

Distinct profiles of functional discrimination among G proteins determine the actions of G protein-coupled receptors

Ikuo Masuho et al. Sci Signal. .

Abstract

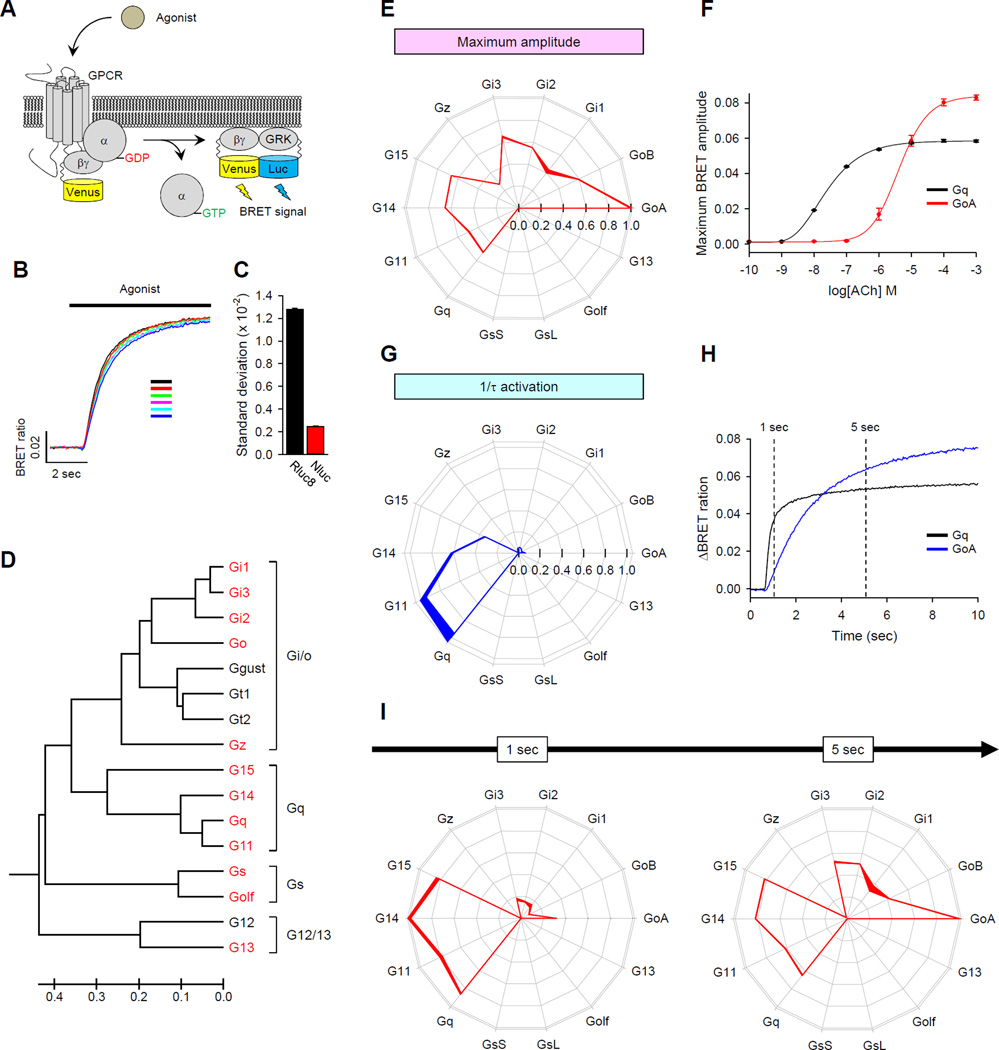
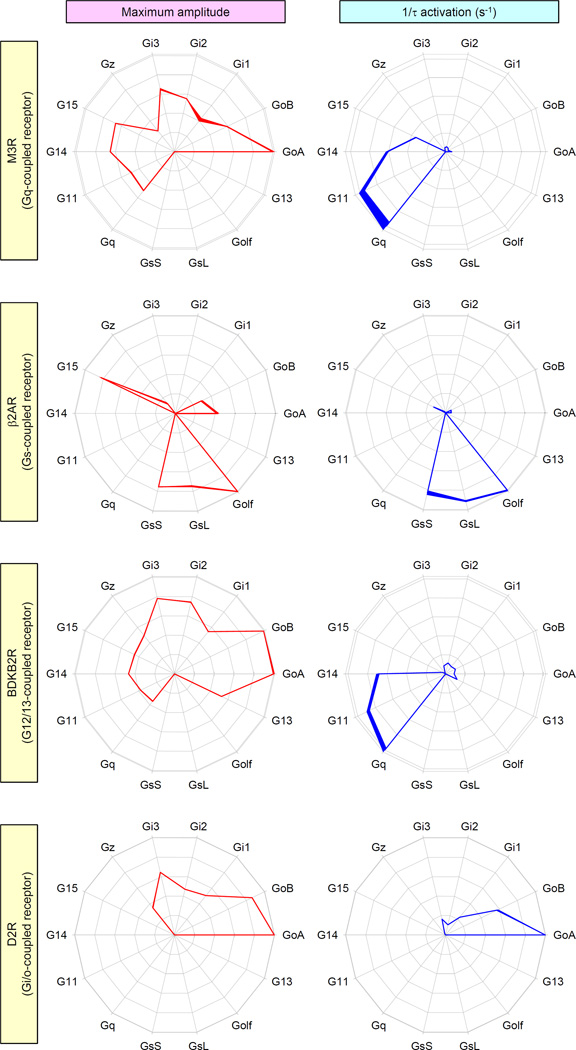
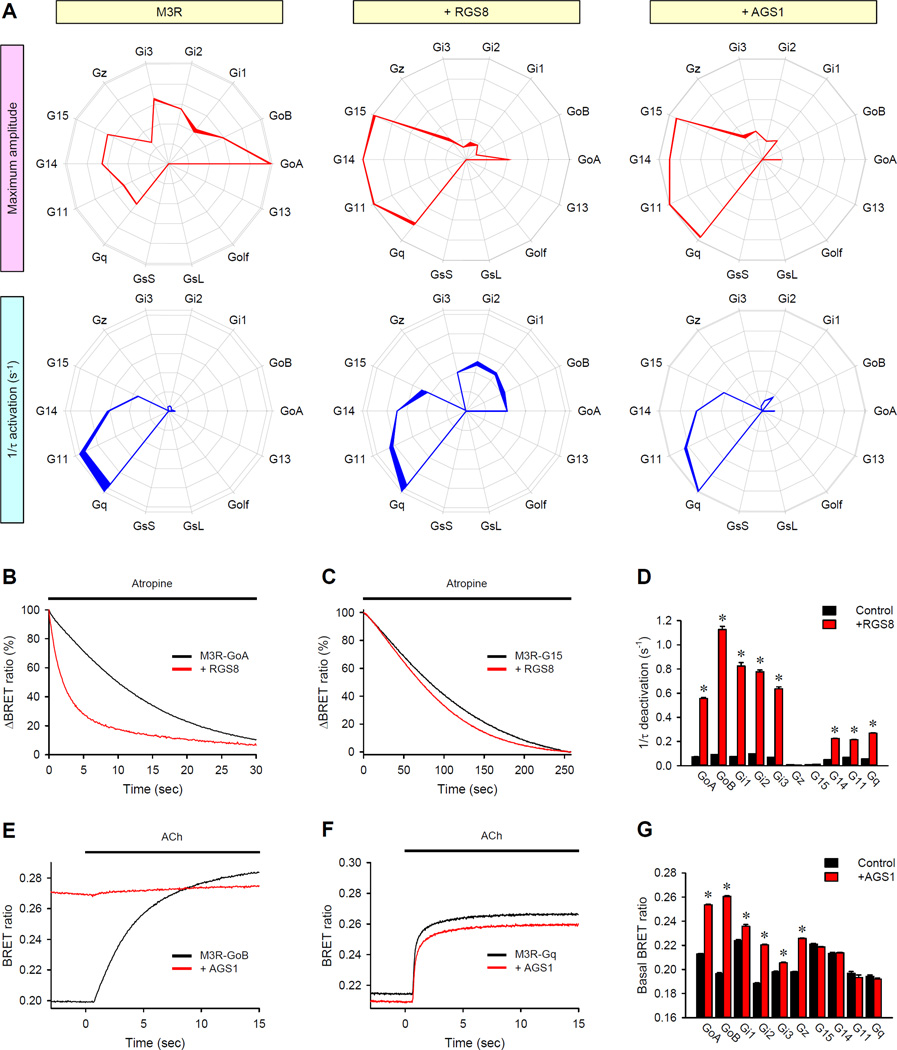
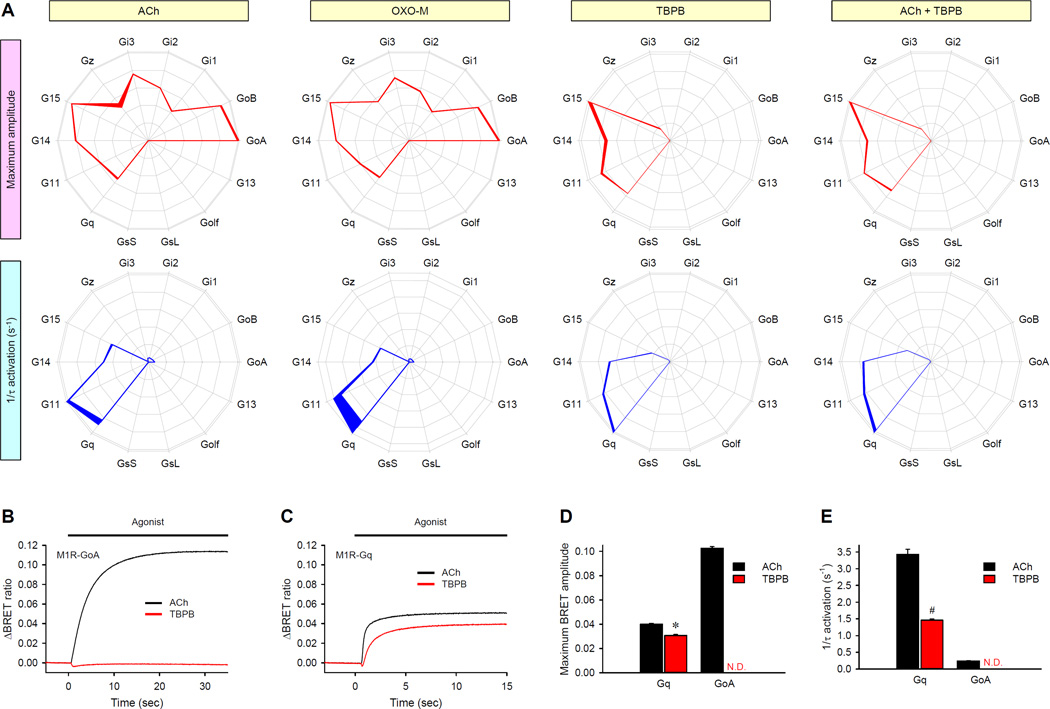
Members of the heterotrimeric guanine nucleotide-binding protein (G protein)-coupled receptor (GPCR) family play key roles in many physiological functions and are extensively exploited pharmacologically to treat diseases. Many of the diverse effects of individual GPCRs on cellular physiology are transduced by heterotrimeric G proteins, which are composed of α, β, and γ subunits. GPCRs interact with and stimulate the binding of guanosine triphosphate (GTP) to the α subunit to initiate signaling. Mammalian genomes encode 16 different G protein α subunits, each one of which has distinct properties. We developed a single-platform, optical strategy to monitor G protein activation in live cells. With this system, we profiled the coupling ability of individual GPCRs for different α subunits, simultaneously quantifying the magnitude of the signal and the rates at which the receptors activated the G proteins. We found that individual receptors engaged multiple G proteins with varying efficacy and kinetics, generating fingerprint-like profiles. Different classes of GPCR ligands, including full and partial agonists, allosteric modulators, and antagonists, distinctly affected these fingerprints to functionally bias GPCR signaling. Finally, we showed that intracellular signaling modulators further altered the G protein-coupling profiles of GPCRs, which suggests that their differential abundance may alter signaling outcomes in a cell-specific manner. These observations suggest that the diversity of the effects of GPCRs on cellular physiology may be determined by their differential engagement of multiple G proteins, coupling to which produces signals with varying signal magnitudes and activation kinetics, properties that may be exploited pharmacologically.


Figures

Fig. 1
Fig. 1. Fingerprinting GPCR activity by measuring signaling efficacy and kinetics across a set of G proteins
(A) Schematic representation of the BRET assay. Activation of a GPCR by agonist leads to the dissociation of inactive heterotrimeric G proteins into active GTP-bound Gα and Venus-Gβγ subunits. The free Venus-Gβγ then interacts with the Gβγ effector mimetic masGRK3ct-Nluc to produce the BRET signal. (B) Representative response profile showing the BRET signal generated by the D2 dopamine receptor in the presence of Gαo. Dopamine (100 µM) was applied to the cells and six independent reactions were conducted in parallel. (C) Quantification of response variability between the different indicated sensors. (D) Repertoire of mammalian Gα subunits. G proteins marked in red were successfully reconstituted in the NanoBRET system. Scale bar below represents relative evolutionary distance. (E to I) Fingerprinting responses of the M3 muscarinic acetylcholine receptor (M3R) to the physiological ligand acetylcholine (ACh). (E) Quantification of the maximal response amplitudes generated by M3R. The maximum amplitudes from the 14 different G proteins were normalized to the largest value to obtain comparative agonist efficacy and were plotted at corresponding vertices in the wheel diagram. The thickness of the lines connecting each data point represents the SEM of four experiments performed in parallel. (F) Dose-response curve relationships of two representative signaling pathways in response to Ach. Data are means ± SEM of four experiments. (G) Quantification of the G protein activation rates catalyzed by the M3R. Activation rate constants from 14 different G proteins were normalized to the response that produced the maximum value and are plotted for each of the G proteins tested. Data are means ± SEM of four experiments. (H) Comparison of the time-courses of activation of GoA and Gq. Each trace represents the mean of the responses measured in eight wells. (I) Maximal response amplitudes recorded at different times [1 and 5 s marked in (H)] after agonist application. Data are means ± SEM of four experiments.
Fig. 2
Fig. 2. Characteristic profiles of G protein activation distinguish various GPCRs from each other
Several GPCRs that belong to different subfamilies were examined for the specificity of their G protein coupling by measuring two parameters: maximum amplitude of the BRET signal (red) and activation rates (blue). Cells expressing M3R, β2AR, the bradykinin B2 receptor (BDKB2R), or the dopamine D2 receptor (D2R) were activated by saturating concentrations (100 µM) of their respective endogenous agonists: acetylcholine, adrenaline, bradykinin, and dopamine. The data reflecting maximum BRET amplitude and activation rate are plotted as relative activity values after normalization against the G protein species that exhibited maximal activity. Data are means ± SEM of four to six experiments.
Fig. 3
Fig. 3. Major classes of intracellular G protein regulators have distinct effects on GPCR fingerprints
(A) The G protein coupling profiles of the M3 receptor were examined in cells in the absence of regulatory molecules (left), in the presence of RGS8 (middle), or in the presence of AGS1 (right). Data are means ± SEM of four experiments. (B and C) Effect of RGS8 on the deactivation rates of Go and G15. Cells were pretreated with 100 µM acetylcholine (ACh) for 35 s and then were treated with 1 mM muscarinic antogonist atropine. Traces correspond to the deactivation phase of the responses of GoA (B) and G15 (C) in the absence and presence of RGS8, and are the average of 12 experiments, normalized to the response at the time of atropine application. (D) The deactivation rate constants in the absence (black) or presence (red) of RGS8 were measured for all responding G proteins. Data are means ± SEM of four experiments. (E and F) Effect of AGS1 on the activation of GoB and Gq. Cells were cotransfected with plasmids encoding M3R (E and F) and either GoB (E) or Gq (F) with (red) or without (black) plasmid encoding AGS1. BRET signals before (basal) and after the application of Ach were recorded. Each trace is an average of six replicates. (G) Quantification of changes in the basal BRET ratio for the indicated G proteins measured in the absence (black) or presence (red) of AGS1. Data are means ± SEM of six experiments. The unpaired t-test was used to test for statistically significant differences between nuntransfected cells and RGS8-expressing (D) or AGS1-expressing cells (G). *P < 0.001.
Fig. 4
Fig. 4. Synthetic GPCR ligands can bias the G protein coupling profiles of GPCRs
(A) Four different agonist application conditions (yellow boxes) were examined for their effects on the G protein fingerprints of the M1R using two parameters: maximum amplitude (red) and activation rates (blue). Saturating concentrations (100 µM) of ACh, OXO-M, TBPB, or ACh and TBPB were applied to the M1R-expressing cells. Data are means ± SEM of six experiments. (B and C) Individual comparison of the activation of GoA (B) and Gq (C) by ACh (black) or TBPB (red). Each trace represents the mean of 12 replicates. (D) Direct comparison of the effects of the indicated agonists on amplitudes of the responses of GoA and Gq to M1R. (E) Direct comparison of the effects of the indicated agonists on the activation kinetics of GoA and Gq by M1R. Data are means ± SEM of six replicates. *P < 0.001 by paired t test. N.D., not detected.
Fig. 5
Fig. 5. Ligand-dependent coupling of muscarinic receptors to GIRK channels in native hippocampal neurons
(A) Schematic representation of the activation of GIRK channels by GPCRs. The binding of agonist to a Gi/o-coupled GPCR leads to an interaction between Gβγ and the GIRK channel, which evokes an inward-rectifying K+ current. (B) Representative traces of GIRK currents in hippocampal neurons evoked by a saturating concentration (100 µM) of the indicated agonists. (C) Maximal current amplitudes of GIRK responses elicited by agonist were measured 10 s after agonist application. The application of TBPB either in the absence or presence of OXO-M did not evoke any inward current. (D) Current densities in the presence of a high concentration of K+ were measured to assess ligand-independent ion flow through inward-rectifying potassium channels. The amount of current was recorded before the application of each indicated agonist. All electrophysiological data were recorded from a total of seven neurons. Data are means ± SEM.
Fig. 6
Fig. 6. GPCR fingerprinting reveals the selective activation of G proteins by opioid receptors in response to a classical antagonist
(A to F) Endogenous agonists (endomorphin-1 or dynorphin A) and a classical antagonist (naloxone) were examined for their effects on the G protein coupling specificities of MOR (A to C) and KOR (D to F) using two parameters: maximum amplitude (red) and activation rates (blue). Saturating concentrations (100 µM) of the indicated ligands were applied. Data are means ± SEM of six to twelve experiments. (B, C, E and F) Direct comparison of the activation of GoA (black) and Gi1 (red) by MOR (B and C) and KOR (E and F) in response to endomorphin-1 (B), dynorphin A (E), or naloxone (C and F). Each trace represents an average of six replicates.
Fig. 7
Fig. 7. The biased G protein coupling specificities of opioid receptor subtypes in response to naloxone results in differential modulation of cAMP production
(A) Schematic representation of the assay paradigm. Transfected cells expressing opioid receptors were pre-incubated with naloxone before the β2AR agonist ISO was applied to stimulate cAMP production. The kinetics of the amplitude of the cAMP signal were determined in real time with a BRET-based cAMP sensor that exhibits a decreased BRET signal upon cAMP binding. (B to E) Effect of naloxone on ISO-stimulated cAMP production in HEK 293T/17 cells expressing no opioid receptor (B), MOR (C), KOR (D), or DOR (E). The cells were cotransfected with plasmids encoding the indicated opioid receptors together with Nluc-Epac-VV. Before the activation of endogenous βARs with ISO, transfected cells were incubated with (closed circle) or without (open circles) 100 µM naloxone for 5 min. The cells were then treated with 1 µM isopreterenol at time zero. Each trace represents the mean of 12 replicates. (F) Quantification of changes in maximal BRET amplitudes induced by naloxone for each of the opioid receptors. §P < 0.05 and *P < 0.0001 by paired t-test.

Comment in

References

    1. Wettschureck N, Offermanns S. Mammalian G proteins and their cell type specific functions. Physiological reviews. 2005;85:1159–1204. - PubMed
    1. O’Hayre M, Vazquez-Prado J, Kufareva I, Stawiski EW, Handel TM, Seshagiri S, Gutkind JS. The emerging mutational landscape of G proteins and G-protein-coupled receptors in cancer. Nature reviews. Cancer. 2013;13:412–424. - PMC - PubMed
    1. Catapano LA, Manji HK. G protein-coupled receptors in major psychiatric disorders. Biochim Biophys Acta. 2007;1768:976–993. - PMC - PubMed
    1. Vassart G, Costagliola S. G protein-coupled receptors: mutations and endocrine diseases. Nature reviews. Endocrinology. 2011;7:362–372. - PubMed
    1. Blad CC, Tang C, Offermanns S. G protein-coupled receptors for energy metabolites as new therapeutic targets. Nat Rev Drug Discov. 2012;11:603–619. - PubMed

Publication types

MeSH terms

Substances