. 2015 Aug 28;4(11):795-810.
doi: 10.1016/j.molmet.2015.08.003. eCollection 2015 Nov.

TUSC5 regulates insulin-mediated adipose tissue glucose uptake by modulation of GLUT4 recycling

Affiliations

TUSC5 regulates insulin-mediated adipose tissue glucose uptake by modulation of GLUT4 recycling

Nigel Beaton et al. Mol Metab. .

Abstract

Objective: Failure to properly dispose of glucose in response to insulin is a serious health problem, occurring during obesity and is associated with type 2 diabetes development. Insulin-stimulated glucose uptake is facilitated by the translocation and plasma membrane fusion of vesicles containing glucose transporter 4 (GLUT4), the rate-limiting step of post-prandial glucose disposal.

Methods: We analyzed the role of Tusc5 in the regulation of insulin-stimulated Glut4-mediated glucose uptake in vitro and in vivo. Furthermore, we measured Tusc5 expression in two patient cohorts.

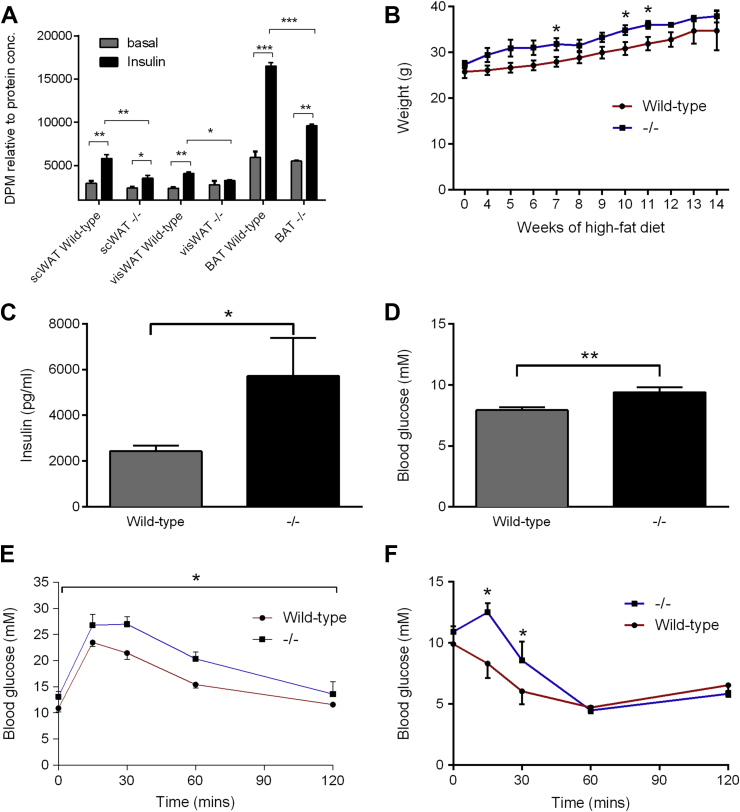
Results: Herein, we report that TUSC5 controls insulin-stimulated glucose uptake in adipocytes, in vitro and in vivo. TUSC5 facilitates the proper recycling of GLUT4 and other key trafficking proteins during prolonged insulin stimulation, thereby enabling proper protein localization and complete vesicle formation, processes that ultimately enable insulin-stimulated glucose uptake. Tusc5 knockout mice exhibit impaired glucose disposal and TUSC5 expression is predictive of glucose tolerance in obese individuals, independent of body weight. Furthermore, we show that TUSC5 is a PPARγ target and in its absence the anti-diabetic effects of TZDs are significantly blunted.

Conclusions: Collectively, these findings establish TUSC5 as an adipose tissue-specific protein that enables proper protein recycling, linking the ubiquitous vesicle traffic machinery with tissue-specific insulin-mediated glucose uptake into adipose tissue and the maintenance of a healthy metabolic phenotype in mice and humans.

Keywords: Glucose uptake; Insulin resistance; Obesity; Type 2 diabetes.


Figures

Figure 1
Figure 1
TUSC5 is adipocyte specifically expressed and is important for insulin-stimulated glucose uptake. (AC) qRT-PCR for Tusc5 (A), Glut4 (B) and sortilin (C) mRNA expression in various wild-type C57Bl/6 mouse tissues (n = 5). (D) Insulin-stimulated and basal uptake of 2-deoxyglucose in 3T3-L1 adipocytes after shRNA-mediated TUSC5 knockdown (n = 3). (E) Insulin-stimulated and basal uptake of 2-deoxyglucose in eWAT of wild-type C57Bl/6 mice 6 days after shRNA-mediated TUSC5 knockdown (n = 6–10).
Figure 2
Figure 2
TUSC5 co-localizes with GLUT4. (A) Representative immuno-fluorescence images of whole tissue mounts of eWAT from fasted wild-type and Tusc5 knockout C57Bl/6 mice for TUSC5 and GLUT4 (scale: 100 μm). (B) Representative immunofluorescence images of TUSC5 and GLUT4 staining in 3T3-L1 adipocytes in basal (0 nM) and insulin-stimulated state (100 nM) (scale: 50 μm) at different time points. (C) Western blot on low-density microsome (LDM) and plasma membrane fractions from 3T3-L1 adipocytes in basal (0 nM) and insulin-stimulated state (100 nM) for GLUT4 and TUSC5.
Figure 3
Figure 3
TUSC5 interacts with GLUT4 and is involved in insulin-stimulated GLUT4 trafficking. (A) Western blot of immunoprecipitation of endogenous TUSC5 from 3T3-L1 adipocytes in basal (0 nM) and insulin-stimulated state (10 nM). (B) Mass spectrometric identification of co-precipitants from TUSC5 and GLUT4 IPs (n = 4). *p < 0.05, **p < 0.01, ***p < 0.001 by Student's t-test. Bar graphs shown are mean ± s.e.m. (C) Representative confocal microscopy images of plasma membrane lawns from insulin-stimulated 100 nM, 30 min) 3T3-L1 adipocytes after shRNA-mediated TUSC5 knockdown (scale: 100 μm). (D) Western blot of plasma membrane fractions of 3T3-L1 adipocytes in basal (0 nM) and insulin-stimulated state (10 nM, 2 h) after shRNA-mediated TUSC5 knockdown. (E) Representative confocal microscopy images of non-permeabilized 3T3-L1 adipocytes expressing exofacially myc-tagged GLUT4 after shRNA-mediated TUSC5 knockdown in a basal (0 nM) or insulin-stimulated state (100 nM, 15 min,scale: 100 μm). (F) Quantification of spectrophotometric signal from extracellular myc exposure in basal (0 nM) or insulin-stimulated (100 nM) 3T3-L1 adipocytes.
Figure 4
Figure 4
TUSC5 promotes intracellular associations during protein recycling. (A) Western blot of immunoprecipitation of endogenous cellugyrin (CG) from 3T3-L1 adipocytes after siRNA-mediated TUSC5 knockdown. (B) Western blot of immunoprecipitation of endogenous GLUT4 from 3T3-L1 adipocytes in control and TUSC5 knockdown conditions. (C) MS1 intensities from mass spectrometric analysis of co-precipitants of GLUT4 IPs as in 2D (n = 4). *p < 0.05, **p < 0.01 by Student's t-test. Bar graphs shown are mean ± s.e.m. (D) Representative confocal microscopy images of insulin-stimulated 3T3-L1 adipocytes (0, 15, 60 and 90 min stimulation after starvation) after siRNA-mediated TUSC5 knockdown. Quantification of (E) VAMP3 and (F) GLUT4 signal intensities at the plasma membrane from representative confocal microscopy images as shown in 4D. (G) Amount of surface exposed Glut4myc at the indicated time points in basal and insulin-stimulated L6 and L6Glut4myc cells after adenoviral mediated TUSC5 overexpression. *p < 0.05 T5 OE vs. scr ctrl by Student's t-test.
Figure 5
Figure 5
Tusc5 knockout mice exhibit impaired blood glucose homeostasis and insulin sensitivity. (A) Ex vivo glucose uptake in white (subcutaneous, visceral) and brown primary adipocytes isolated from wild-type and Tusc5 knockout mice. (B) Weight of Tusc5 knockout mice and wild-type littermate controls during HFD feeding (n = 5–6). (C) Re-fed blood glucose and (D) insulin levels in Tusc5 knockout mice and wild-type littermates after 12 weeks of HFD (n = 5–6). (E) IPGTT (1 g per kg) in Tusc5 knockout mice and wild-type littermates after 12 weeks of HFD (n = 5–6). (F) ITT (1 IU per kg) in Tusc5 knockout mice and wild-type littermates after 12 weeks of HFD (n = 3). *p < 0.05, **p < 0.01, ***p < 0.001 by Student's t-test. Bar graphs shown are mean ± s.e.m.
Figure 6
Figure 6
TUSC5 is target protein of PPARγ and confers the action of TZDs on metabolic health. (A) Western blot of 3T3-L1 adipocytes stimulated with rosiglitazone (1 μM) for indicated times. (B) Western blot of differentiated immortalized brown adipocytes with siRNA mediated PPARγ knockdown. (C) Western blot of iWAT from wild-type C57Bl/6 mice gavaged daily with rosiglitazone (10 mg per kg) for two weeks. (D) Quantification of western blot bands from 5C. (E, F) Fasted blood glucose (E) and insulin (F) levels in Tusc5 knockout mice and wild-type littermates before and after two weeks of daily rosiglitazone gavage (10 mg per kg) (n = 5–6). (G) Ex vivo glucose uptake in primary white (subcutaneous/visceral) and brown adipocytes with or without rosiglitazone treatment in basal and insulin-stimulated (100 nM) conditions. *p < 0.05, **p < 0.01 by Student's t-test. Bar graphs shown are mean ± s.e.m.
Figure 7
Figure 7
Tusc5 mRNA expression correlates with retained insulin sensitivity in humans. (A) qRT-PCR for Tusc5 expression in scWAT biopsies plotted against male patient BMI (n = 22). (B) Tusc5 expression in patients from 7A grouped based upon metabolic phenotype (lean (n = 6), obese healthy (n = 8) or obese diabetic (n = 8)). (C) Tusc5 expression plotted against fasting glucose in patients from 7A. (D) Tusc5 expression plotted against M-index in patients from 7A. (EF) qRT-PCR for Tusc5 expression in the adipocyte fraction of scWAT biopsies from a cohort of obese female patients (BMI ≥ 35) plotted against (E) oral glucose tolerance (OGTT) at 2 h and (F) fasting insulin (n = 33). *p < 0.05, ***p < 0.001 by Student's t-test. Bar graphs shown are mean ± s.e.m. Graphs A, C, D, E, and F analyzed by linear regression.

References

    1. Huang S., Czech M.P. The GLUT4 glucose transporter. Cell Metabolism. 2007;5:237–252. - PubMed
    1. Maier V.H., Gould G.W. Long-term insulin treatment of 3T3-L1 adipocytes results in mis-targeting of GLUT4: implications for insulin-stimulated glucose transport. Diabetologia. 2000;43:1273–1281. - PubMed
    1. Garvey W.T., Maianu L., Zhu J.H., Brechtel-Hook G., Wallace P., Baron A.D. Evidence for defects in the trafficking and translocation of GLUT4 glucose transporters in skeletal muscle as a cause of human insulin resistance. Journal of Clinical Investigation. 1998;101:2377–2386. - PMC - PubMed
    1. Zisman A., Peroni O., Abel E., Michael M., Mauvais-Jarvis F., Lowell B. Targeted disruption of the glucose transporter 4 selectively in muscle causes insulin resistance and glucose intolerance. Nature Medicine. 2000;6:924–928. - PubMed
    1. Abel E.D., Peroni O., Kim J.K., Kim Y.B., Boss O., Hadro E. Adipose-selective targeting of the GLUT4 gene impairs insulin action in muscle and liver. Nature. 2001;409:729–733. - PubMed