. 2015 Aug 15;2(10):1351-63.
doi: 10.1016/j.ebiom.2015.08.026. eCollection 2015 Oct.

The Human Glioblastoma Cell Culture Resource: Validated Cell Models Representing All Molecular Subtypes

Affiliations

The Human Glioblastoma Cell Culture Resource: Validated Cell Models Representing All Molecular Subtypes

Yuan Xie et al. EBioMedicine. .

Abstract

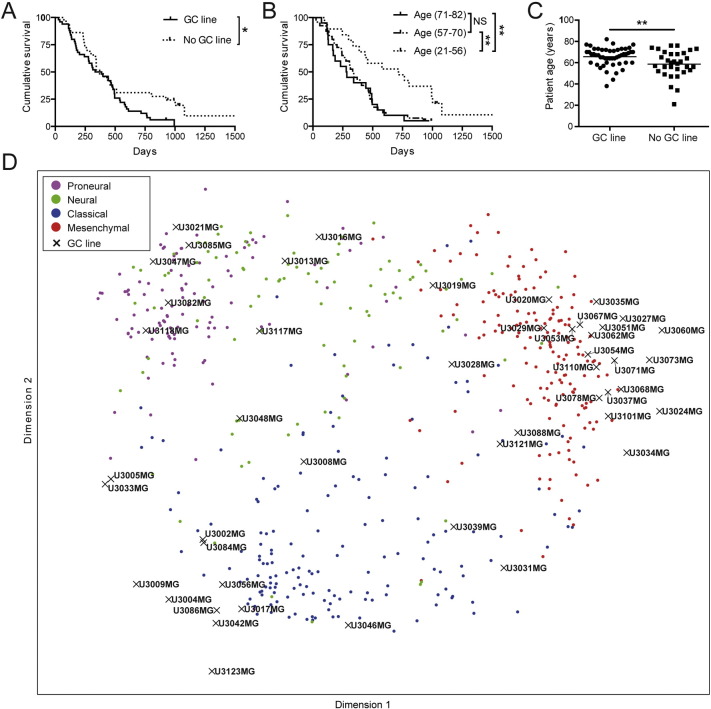
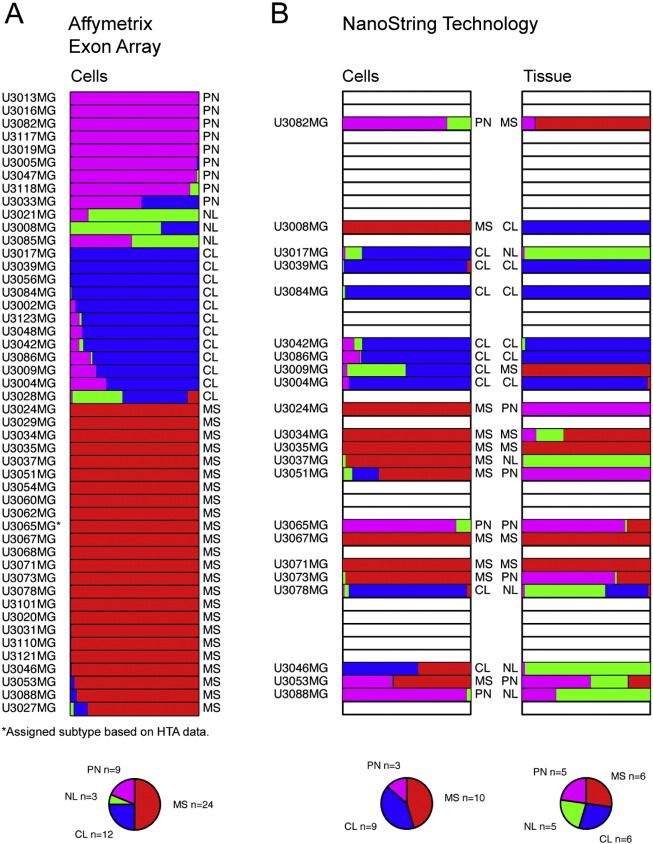
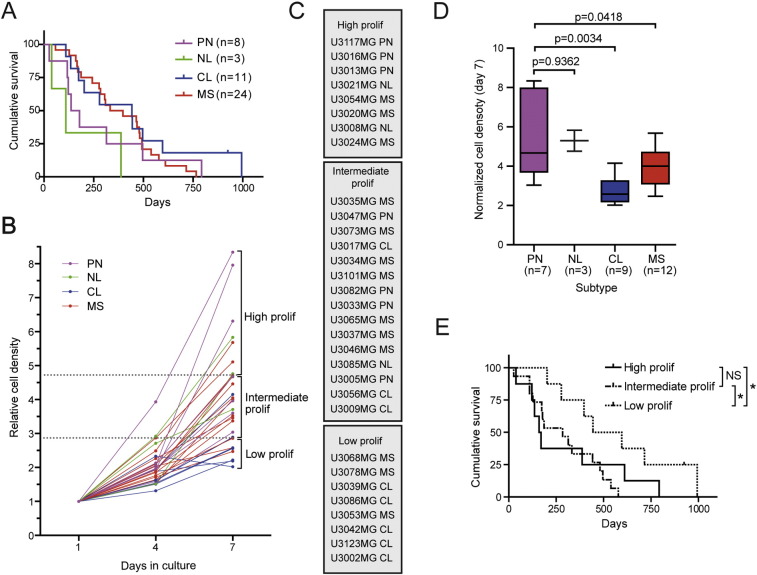
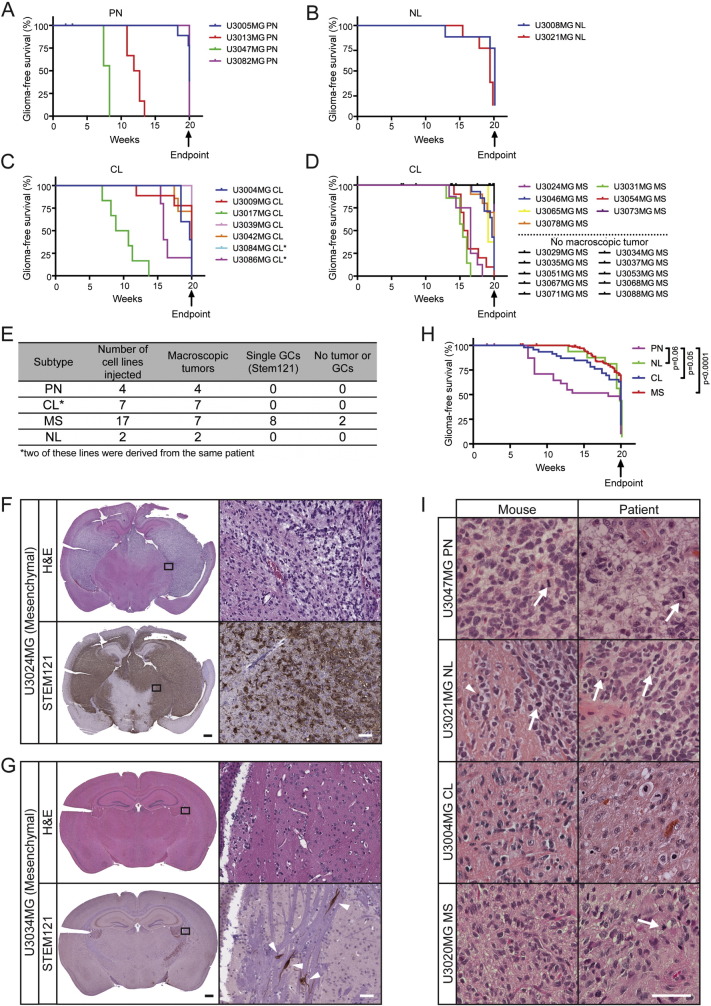
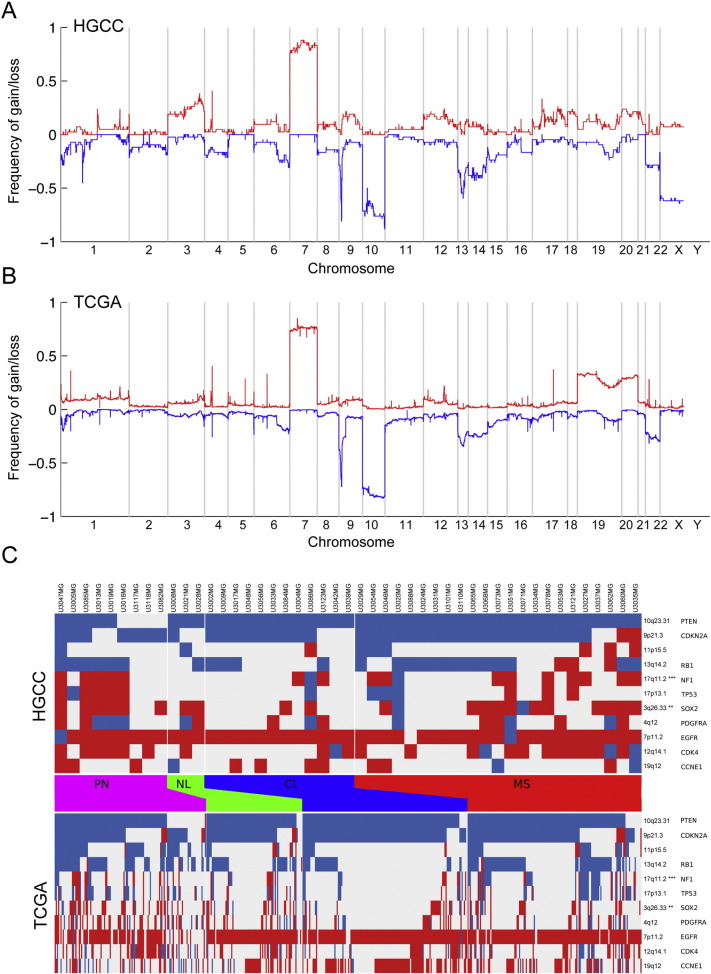
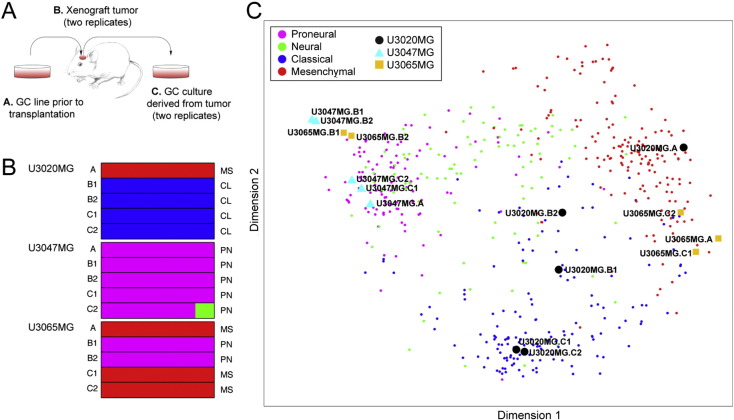
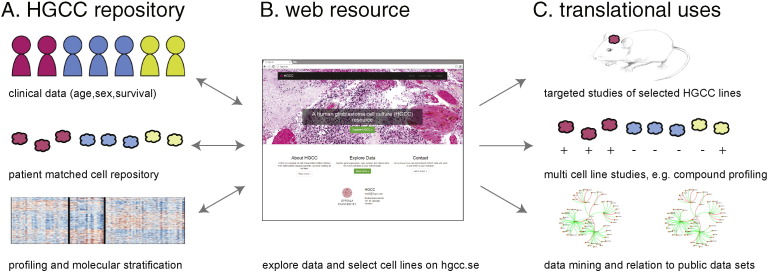
Glioblastoma (GBM) is the most frequent and malignant form of primary brain tumor. GBM is essentially incurable and its resistance to therapy is attributed to a subpopulation of cells called glioma stem cells (GSCs). To meet the present shortage of relevant GBM cell (GC) lines we developed a library of annotated and validated cell lines derived from surgical samples of GBM patients, maintained under conditions to preserve GSC characteristics. This collection, which we call the Human Glioblastoma Cell Culture (HGCC) resource, consists of a biobank of 48 GC lines and an associated database containing high-resolution molecular data. We demonstrate that the HGCC lines are tumorigenic, harbor genomic lesions characteristic of GBMs, and represent all four transcriptional subtypes. The HGCC panel provides an open resource for in vitro and in vivo modeling of a large part of GBM diversity useful to both basic and translational GBM research.

Keywords: Cell culture; Glioblastoma; Molecular subtype; Stem cell culture condition; Xenograft models.


Figures

Fig. 1
Fig. 1
The GBM patient cohort: Molecular diversity and correlations between establishment of GC lines, survival and age. (A) Kaplan–Meier comparison of the survival of patients with GBM from whom sustainable cell lines could (solid line) and could not (dotted line) be established. Log-rank test, *p < 0.05. (B) Kaplan–Meier comparison of survival versus age. The oldest patients (71–82 years old, average 74) are above the third quartile, the intermediate ones (57–70, average 64) between first and third quartiles, and the youngest (21–56 years old, average 48) below the first quartile. Log-rank test, **p < 0.01. (C) Age distribution of the patients from whom a sustainable GC line could (average age 66 years) and could not (average age 59 years) be established. Student's t-test, **p < 0.01. (D) Isomap analysis of 48 GC lines and 529 TCGA tissue samples of known molecular subtypes.
Fig. 2
Fig. 2
Molecular subtyping of GC lines and their corresponding tumor samples. (A) Forty-eight GC lines were analyzed by Affymetrix GeneChip Human Exon 1.0ST Arrays, followed by subtyping (indicated to the right of each bar) by applying a k-nearest neighbor classification in combination with bootstrapping. The variation in the fraction of times each cell line classified as Mesenchymal (MS, red bars), Neural (NL, green bars), Proneural (PN, magenta bars) or Classical (CL, blue bars) reflects the uncertainty of the assignment. The subtype assignment of each GC line is indicated to the right of each bar. * = sample that failed to be analyzed on the Exon Array, the assigned subtype is based on gene expression analyzed on Human Transcriptome Array (see Fig. 7B). (B) Comparison of the predicted subtypes of 22 GC lines and the corresponding tumor tissue based on gene expression analysis by NanoString Technology. The fraction of times each cell line or tissue sample was assigned to the Mesenchymal (MS, red bars), Neural (NL, green bars), Proneural (PN, purple bars) or Classical (CL, blue bars) subtype is depicted and the final assignment indicated to the right or left of the bars, respectively. See also Table S2.
Fig. 3
Fig. 3
Proliferation capacity of GC lines in relation to subtype and survival. (A) Kaplan–Meier comparing the survival of patients in relationship to the TCGA molecular subtype of the GC lines established from their tumors. (B) Growth curves for 31 GC lines of differing TCGA molecular subtypes. Based on their proliferative capacity on day 7, the cell lines below the first quartile were designated as “low proliferation”, between the first and third quartiles as “intermediate proliferation”, and above the third quartile as “high proliferation”. (C) The GC lines categorized were listed in the order of highest to lowest proliferative capacity. (D) Analysis (Student's t-test) of the proliferative capacity of GC lines in relationship to their TCGA molecular subtype. (E) Kaplan–Meier plot comparing the survival of patients with GBM in relationship to the proliferative capacity (high, intermediate, and low) of the corresponding GC lines. Log-rank test, *p < 0.05.
Fig. 4
Fig. 4
Expression of neural and glial protein markers by the GC lines. (A) Representative double immunofluorescence staining of cultured cells for SOX2 and GFAP, OLIG2 and NESTIN, and S100B and TUBB3. Scale bar = 50 μm. (B–E). The percentage of cells in 27 GC lines staining positively for (B) SOX2, (C) NESTIN, (D) GFAP, and (E) OLIG2.
Fig. 5
Fig. 5
The tumorigenicity of the GC lines. (A–D) Kaplan–Meier graphs illustrating the survival of NOD-SCID mice injected intracranially with GC lines of the (A) Proneural (PN), (B) Neural (NL), (C) Classical (CL) and (D) Mesenchymal (MS) subtypes. (E) Summary of tumor formation and staining for STEM121 (human-specific). (F–G) H&E staining and immunostaining for STEM121 in the brains of mice injected with the U3024MG (F) or U3034MG (G) Mesenchymal GC lines. Black scale bar = 500 μm, white scale bar = 50 μm. (H) Kaplan–Meier graph comparing survival of NOD-SCID mice injected with GC lines of different subtypes. (I) H&E stainings of secondary tumors in NOD-SCID mice (left column) and the human tumor from which the cell line was derived (right column). Scale bar = 50 μm. See also Fig. S3.
Fig. 6
Fig. 6
Genomic similarity of the GC lines to the TCGA GBM tissue samples. Genomic copy number variation analysis in (A) the 48 GC lines, and (B) 509 GBM samples from the TCGA tumor tissue cohort. (C) CNA variation in the GC lines of different subtypes shows similar trends as the TCGA data; the heat map shows amplifications (red) and deletions (blue) for a selected set of regions (rows) previously reported (Brennan et al., 2013). Significant difference (Chi-squared p-value, Holm correction) in alteration frequency was found for 3q26.33 (containing the SOX2 locus, p < 0.01) and 17q11.2 (containing NF1, p < 0.001) which was amplified at a higher frequency in our GC lines compared to TCGA.
Fig. 7
Fig. 7
Stability of the molecular subtypes in GC cell line culture and in vivo. (A) Schematic overview of the procedure. (B) Molecular subtype based on gene expression as determined with the Affymetrix Human Transcriptome Array 2.0. The proportion of times each cell line or tissue was assigned to the Mesenchymal (MS, red bars), Neural (NL, green bars), Proneural (PN, magenta bars) or Classical (CL, blue bars) subtype is depicted by the bars, and the final assignment is denoted to the right of the bars. (C) Isomap of samples from the analysis of subtype stability with 529 TCGA GBM tissue samples as reference.
Fig. 8
Fig. 8
Overview of how the HGCC biobank will support translational brain tumor research. We provide a large-scale, open access repository of patient-derived GBM cell cultures matched with clinical data (A) that enables accurate cell-based modeling of GBM diversity. Coupled to the cell bank we make available a user-friendly data repository (B) to support users in their selection of HGCC lines with particular properties, molecular subtype or marker expression. We foresee a multitude of applications (C), such as single/oligo cell line studies of e.g. candidate genes and mechanisms in vitro and in vivo (xenograft modeling), multi-cell line studies, e.g. screening for inhibitory compounds or siRNAs, and data mining in relation to other publically available data sets.

Comment in

References

    1. Babateen O., Jin Z., Bhandage A., Korol S.V., Westermark B., Forsberg Nilsson K., Uhrbom L., Smits A., Birnir B. Etomidate, propofol and diazepam potentiate GABA-evoked GABAA currents in a cell line derived from human glioblastoma. Eur. J. Pharmacol. 2015;748:101–107. - PubMed
    1. Balvers R.K., Kleijn A., Kloezeman J.J., French P.J., Kremer A., Van Den Bent M.J., Dirven C.M., Leenstra S., Lamfers M.L. Serum-free culture success of glial tumors is related to specific molecular profiles and expression of extracellular matrix-associated gene modules. Neuro Oncol. 2013;15:1684–1695. - PMC - PubMed
    1. Bao S., Wu Q., Mclendon R.E., Hao Y., Shi Q., Hjelmeland A.B., Dewhirst M.W., Bigner D.D., Rich J.N. Glioma stem cells promote radioresistance by preferential activation of the DNA damage response. Nature. 2006;444:756–760. - PubMed
    1. Barretina J., Caponigro G., Stransky N., Venkatesan K., Margolin A.A., Kim S., Wilson C.J., Lehar J., Kryukov G.V., Sonkin D., Reddy A., Liu M., Murray L., Berger M.F., Monahan J.E., Morais P., Meltzer J., Korejwa A., Jane-Valbuena J., Mapa F.A., Thibault J., Bric-Furlong E., Raman P., Shipway A., Engels I.H., Cheng J., Yu G.K., Yu J., Aspesi P., Jr., De Silva M., Jagtap K., Jones M.D., Wang L., Hatton C., Palescandolo E., Gupta S., Mahan S., Sougnez C., Onofrio R.C., Liefeld T., Macconaill L., Winckler W., Reich M., Li N., Mesirov J.P., Gabriel S.B., Getz G., Ardlie K., Chan V., Myer V.E., Weber B.L., Porter J., Warmuth M., Finan P., Harris J.L., Meyerson M., Golub T.R., Morrissey M.P., Sellers W.R., Schlegel R., Garraway L.A. The Cancer Cell Line Encyclopedia enables predictive modelling of anticancer drug sensitivity. Nature. 2012;483:603–607. - PMC - PubMed
    1. Beier D., Hau P., Proescholdt M., Lohmeier A., Wischhusen J., Oefner P.J., Aigner L., Brawanski A., Bogdahn U., Beier C.P. CD133(+) and CD133(−) glioblastoma-derived cancer stem cells show differential growth characteristics and molecular profiles. Cancer Res. 2007;67:4010–4015. - PubMed

Publication types

MeSH terms

Substances