. 2015 Dec 2;10(12):e0143559.
doi: 10.1371/journal.pone.0143559. eCollection 2015.

Exploring the Gastrointestinal "Nemabiome": Deep Amplicon Sequencing to Quantify the Species Composition of Parasitic Nematode Communities

Affiliations

Exploring the Gastrointestinal "Nemabiome": Deep Amplicon Sequencing to Quantify the Species Composition of Parasitic Nematode Communities

Russell W Avramenko et al. PLoS One. .

Abstract

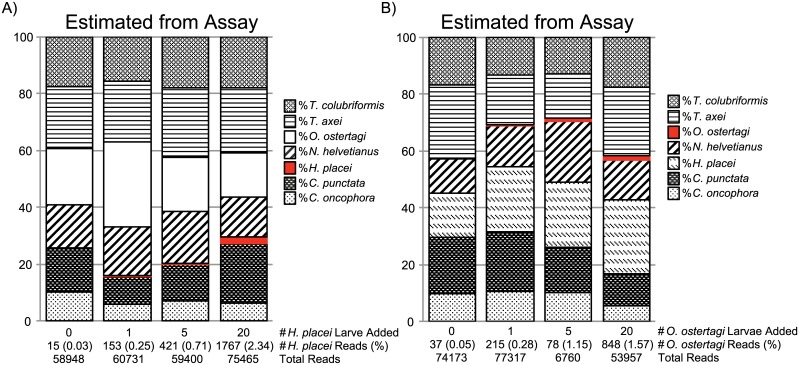
Parasitic helminth infections have a considerable impact on global human health as well as animal welfare and production. Although co-infection with multiple parasite species within a host is common, there is a dearth of tools with which to study the composition of these complex parasite communities. Helminth species vary in their pathogenicity, epidemiology and drug sensitivity and the interactions that occur between co-infecting species and their hosts are poorly understood. We describe the first application of deep amplicon sequencing to study parasitic nematode communities as well as introduce the concept of the gastro-intestinal "nemabiome". The approach is analogous to 16S rDNA deep sequencing used to explore microbial communities, but utilizes the nematode ITS-2 rDNA locus instead. Gastro-intestinal parasites of cattle were used to develop the concept, as this host has many well-defined gastro-intestinal nematode species that commonly occur as complex co-infections. Further, the availability of pure mono-parasite populations from experimentally infected cattle allowed us to prepare mock parasite communities to determine, and correct for, species representation biases in the sequence data. We demonstrate that, once these biases have been corrected, accurate relative quantitation of gastro-intestinal parasitic nematode communities in cattle fecal samples can be achieved. We have validated the accuracy of the method applied to field-samples by comparing the results of detailed morphological examination of L3 larvae populations with those of the sequencing assay. The results illustrate the insights that can be gained into the species composition of parasite communities, using grazing cattle in the mid-west USA as an example. However, both the technical approach and the concept of the 'nemabiome' have a wide range of potential applications in human and veterinary medicine. These include investigations of host-parasite and parasite-parasite interactions during co-infection, parasite epidemiology, parasite ecology and the response of parasite populations to both drug treatments and control programs.


Conflict of interest statement

Competing Interests: Roy Lewis is employed with Merck Animal Health as a technical Services Veterinarian part-time. This affiliation does not alter the authors' adherence to PLOS ONE policies on sharing data and materials. The other authors declare that no other competing interests exist.

Figures

Fig 1
Fig 1. Neighbor-joining tree of ITS-2 rDNA sequences obtained from 8 different parasitic nematode species from cattle.
ITS-2 rDNA amplicons were directly sequenced by Sanger sequencing from 15 individual L3 larvae obtained from experimentally passaged strains for each of eight cattle parasite species. The neighbor-joining tree (Jukes-Cantor model) was computed with 2000 bootstrap replicates and rooted on C. elegans ITS-2 (Accession: JN636100) using Geneious version 7.1.5 created by Biomatters. Available from http://geneious.com/. Bootstrap values >70 are shown, values >80 are considered to be significant.
Fig 2
Fig 2. Assessment of sequence representation bias and the determination of correction factors for the amplicon sequencing assay.
A DNA lysate was prepared from a pool of 140 L3 larvae comprising 20 individual L3 larvae from each of the following species; N. helvetianus, C. oncophora, T. axei, T. colubriformis, C. punctata, O. ostertagi and H. placei. The sequencing assay was applied to this lysate eight times; three, two and three times at 25, 30 and 35 cycles of amplification respectively (as denoted on the x-axis of panels A and B). 2A. The chart shows the species proportions as determined by the actual number of ITS-2 rDNA sequences generated by the amplicon sequencing assay. The p-values above each column indicate whether the species proportions, as determined by the uncorrected numbers of ITS-2 rDNA sequences generated, are statistically different from the actual proportions of larvae in the pool (non-parametric Chi-square test with significant differences between expected and observed results (p≤0.001) for all replicates). 2B. The chart shows the same data as in panel 2A but following the application of a correction factor for each species. The correction factor was calculated for each species by dividing the true proportion of that species in the pool (based on counted larvae) by the mean proportion of Illumina sequences generated from the eight replicates (correction factor = %Actual / %Observed). The correction factors were: N. helvetianus = 0.68871028, C. onchophora = 1.183576925, T. axei = 1.296071418, T. colubriformis = 0.584257283, C. punctata = 2.779407405, O. ostertagi = 1.294841767 and H. placei = 0.919208106. Their application removed the significant variation (p>0.05). The p-values above each column indicate whether the species proportions, as determined by the corrected numbers of ITS-2 rDNA sequences generated, are statistically different from the actual proportions of larvae in the pool (non-parametric Chi-square test). 2C. Replicates were grouped and averaged based on cycles of amplification. A one way ANOVA was performed to detect if number of cycles of amplification affected the proportional representation of each species with non-significant results (N. helvetianus, F = 1.200, p = 0.375; C. oncophora, F = 3.035, p = 0.137; T. axei, F = 0.098, p = 0.908; T. colubriformis, F = 0.752, p = 0.518; C. punctata, F = 2.683, p = 0.162; O. ostertagi, F = 2.501, p = 0.177; H. placei, F = 1.672, p = 0.278)
Fig 3
Fig 3. The determination of species proportions of a series of pairwise parasite species combinations using the amplicon sequencing assay.
DNA lysates were prepared from mock pools of 2000 L3 larvae comprising varying proportions of two different nematode species and the amplicon sequencing assay applied. Panel 3A, O. ostertagi and H. placei; Panel 3B, C. oncophora and O. ostertagi; Panel 3C, O. ostertagi and C. punctata; Panel 3D, C. oncophora and C. punctata. The left hand chart of each pair shows the expected results based on the known numbers of larvae added to each pool and the right hand chart of each pair shows the results of the amplicon sequencing assay (after the application of the appropriate correction factors). The ratios by which the two species of each pair vary from left to right on each chart are as follows: Column 1, 99:1; Column 2 90:10; Column 3; 70:30, Column 4, 50:50; Column 5; 30:70, Column 6; 10:90 and Column 7; 1:99.
Fig 4
Fig 4. Detection threshold of the amplicon sequencing assay.
Separate mock pools of ~2000 larvae were created consisting of equal proportions of 6 parasite species. The seventh species was then added in increasing numbers of 0, 1, 5 and 20 larvae respectively. The charts show the species proportions estimated from the results of the amplicon sequencing assay (following application of the appropriate correction factor). In each case, the Y-axis shows the percentage proportions of each species and the X-axis indicates the number of H. placei or O. ostertagi larvae added as well as the numbers of reads assigned to H. placei and O. ostertagi for Fig 4A and 4B respectively. Fig 4A. Results when H. placei was added in increasing numbers to a pool comprising an equal number of N. helvetianus, C. oncophora, T. axei, T. colubriformis, C. punctata and O. ostertagi. Fig 4B. Results when O. ostertagi was added in increasing numbers to a pool comprising an equal number of shows N. helvetianus, C. oncophora, T. axei, C. punctata, T. colubriformis and H. placei.
Fig 5
Fig 5. Repeatability of the amplicon sequencing assay when applied to field samples.
The amplicon sequencing assay was applied to DNA lysates made from populations of L3 larvae collected from field samples from six Canadian cattle farms (Field samples 1–6). Fig 5A: The results of three technical replicates of the amplicon sequencing assay applied to the same single DNA lysate made from larval populations of each farm. Each DNA lysate was made from 300–2000 larvae (Field sample 1 = 1000 L3; Field sample 2 = 400 L3; Field sample 3 = 1000 L3; Field sample 4 = 2000 L3; Field sample 5 = 300 L3 and Field sample 6 = 2000 L3. Fig 5B: The results of three technical replicates of the amplicon sequencing assay applied to three independent DNA lysates made from separate batches of 1,000 and 2,000 larvae from field samples 1 and 4 respectively. The Y-axis of both charts shows the percentage species proportions as determined by the amplicon sequencing assay (25 cycles of amplification and following application of the appropriate correction factor). The field sample number is indicated on the X-axis.
Fig 6
Fig 6. Comparison of the amplicon sequencing assay with visual morphological identification of larval populations from field samples.
Fecal samples were collected from 39 individual calves entering feedlots from pasture at different locations in Oklahoma, Arkansas and Nebraska. 100 L3 larvae harvested from each coproculture were fixed and identified to the species level on the basis of morphological features on microscopy. The amplicon sequencing assay was applied to several hundred to several thousand L3 larvae from each sample. Fig 6A. Two bars are shown for each sample on the chart. The left bar of each sample shows the species proportions as determined by larval morphology. The right bar of each sample shows the proportions of each species as estimated by the amplicon sequencing assay (values shown are after application of the appropriate correction factor). The Y-axis shows the percentage proportions of each species as determined by morphology or the sequencing assay respectively. Fig 6B. Linear regression analysis was performed to assess the correlation between the percentage composition of each parasite species in each of 39 field samples as determined by the amplicon sequencing assay and morphological identification. The linear regression plots were produced using SPSS Statistics (IBM Corp. Released 2012. IBM SPSS Statistics for Macintosh, Version 21.0. Armonk, NY: IBM Corp), by plotting the percentage representation of each species from the morphological data (Y-axis) against the percentage representation of each species from the amplicon sequencing data (X-axis) for each sample. The values for R2 (coefficient of determination), b (y-intercept) and m (slope) are shown adjacent to each plot. If values are the same the y-intercept (b) will be zero and the slope (m) will be 1.

References

    1. Hotez P. Enlarging the "audacious goal": Elimination of the world's high prevalence neglected tropical diseases. Vaccine 2011, December 30;29 Suppl 4:D104–10. 10.1016/j.vaccine.2011.06.024 - DOI - PubMed
    1. Stromberg BE, Gasbarre LC. Gastrointestinal nematode control programs with an emphasis on cattle. Vet Clin North Am Food Anim Pract 2006, November;22(3):543–65. - PubMed
    1. Parkins JJ, Holmes PH. Effects of gastrointestinal helminth parasites on ruminant nutrition. Nutrition Research Reviews 1989;2(01):227–46. - PubMed
    1. van Wyk JA, Cabaret J, Michael LM. Morphological identification of nematode larvae of small ruminants and cattle simplified. Vet Parasitol 2004, February 6;119(4):277–306. - PubMed
    1. Durette-Desset MC, Hugot JP, Darlu P, Chabaud AG. A cladistic analysis of the trichostrongyloidea (nematoda). Int J Parasitol 1999, July;29(7):1065–86. - PubMed

Publication types

MeSH terms

LinkOut - more resources