. 2015 Dec 3:5:17680.
doi: 10.1038/srep17680.

Fate of HIV-1 cDNA intermediates during reverse transcription is dictated by transcription initiation site of virus genomic RNA

Affiliations

Fate of HIV-1 cDNA intermediates during reverse transcription is dictated by transcription initiation site of virus genomic RNA

Takao Masuda et al. Sci Rep. .

Abstract

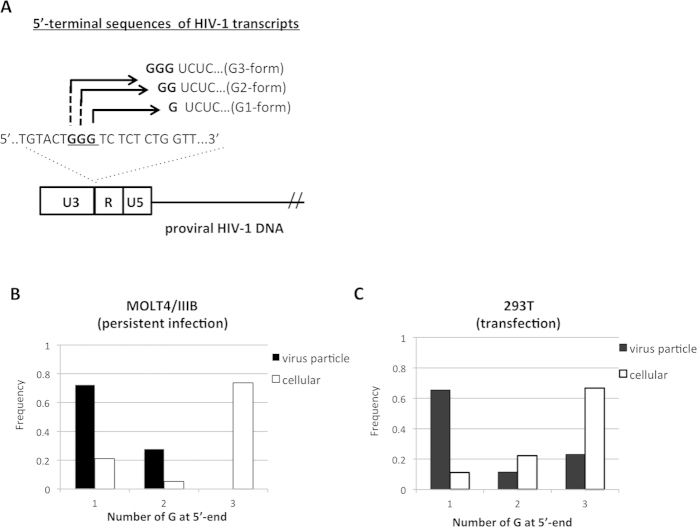
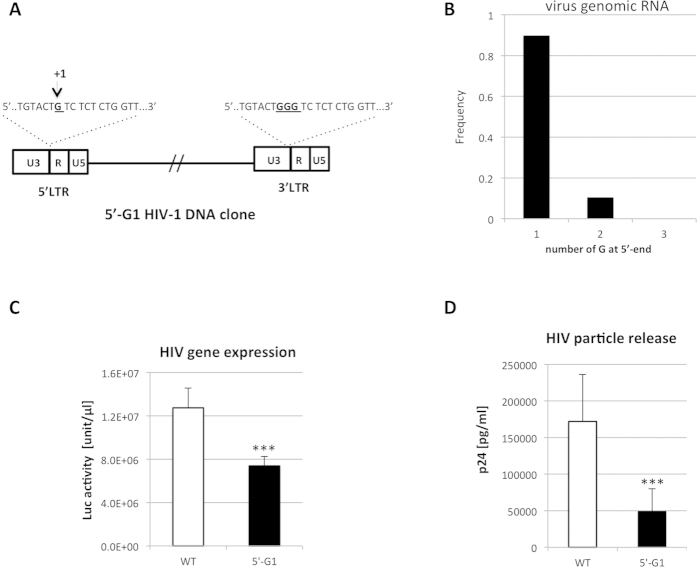
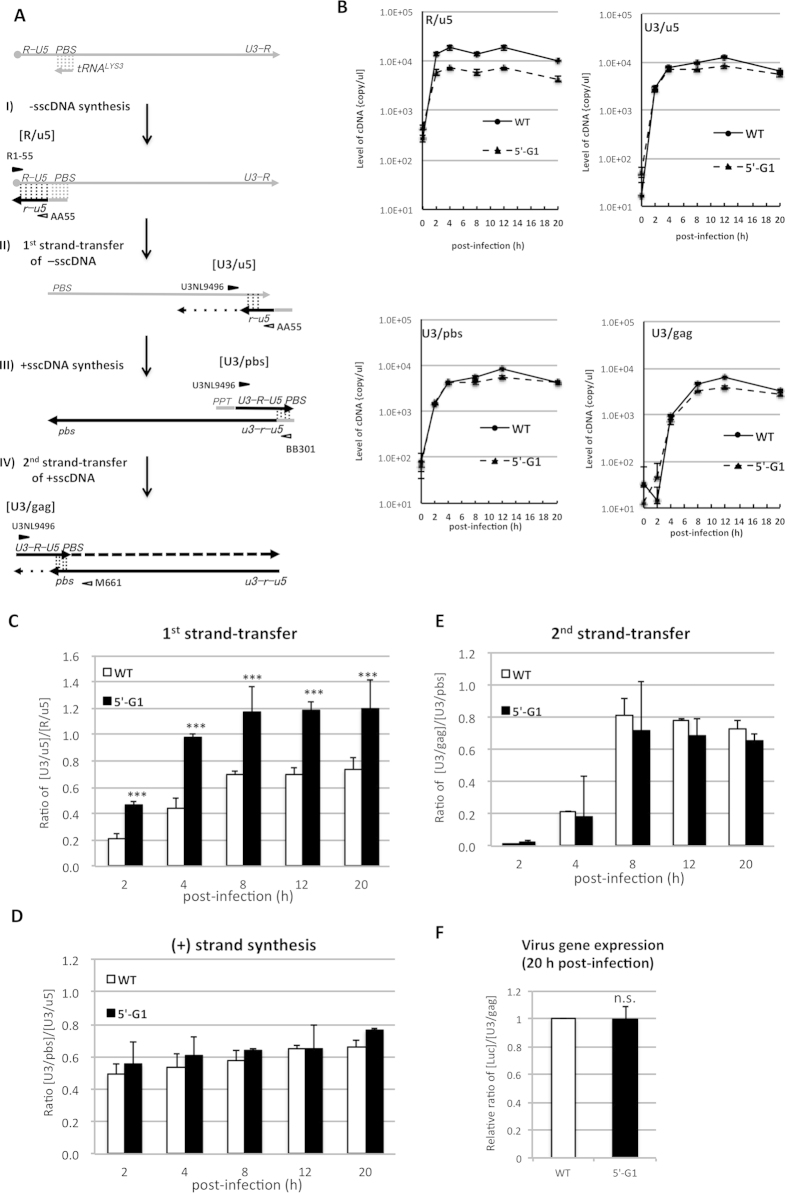
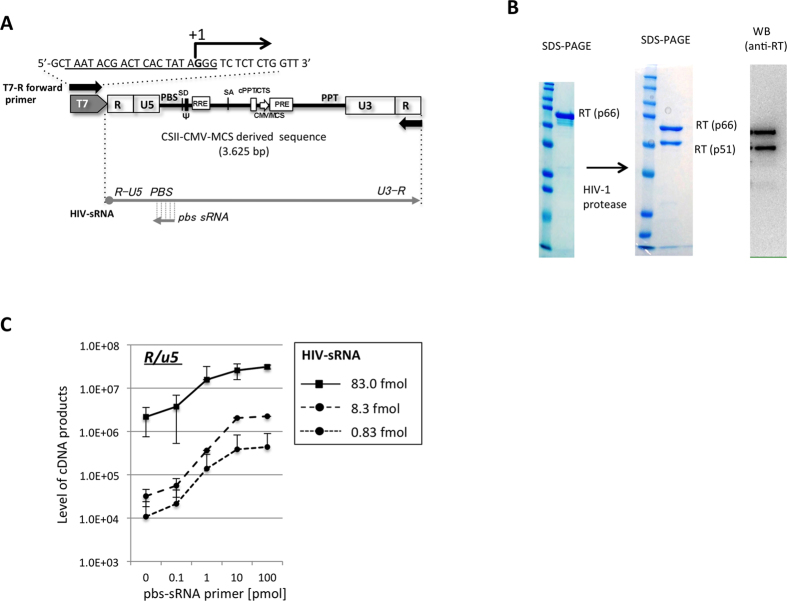
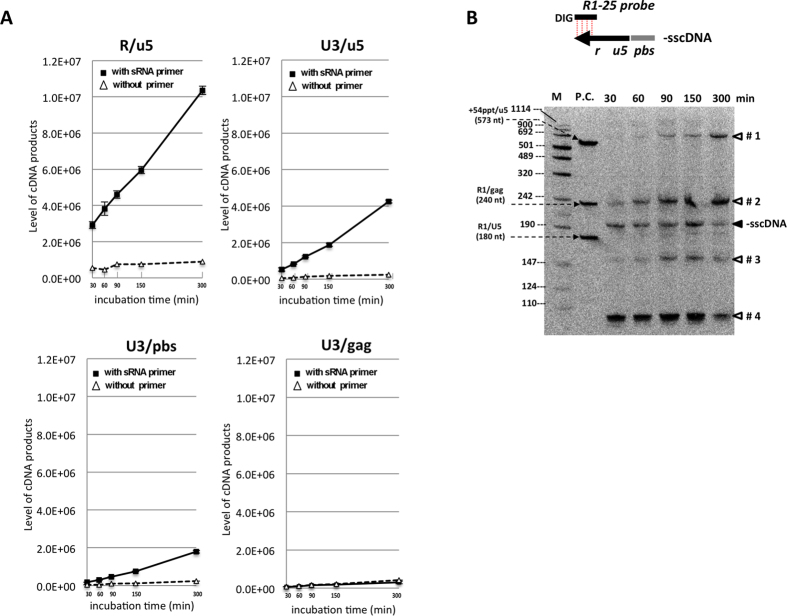
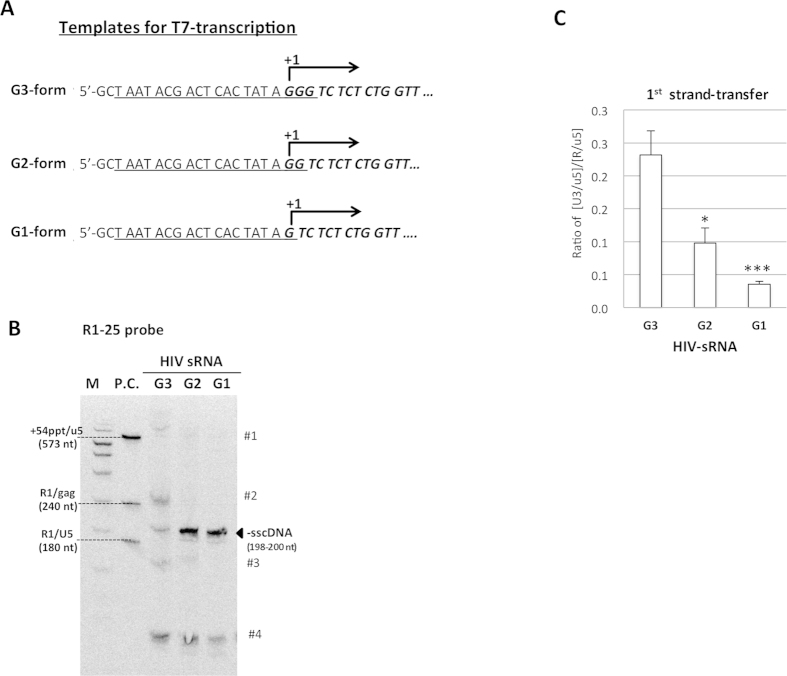
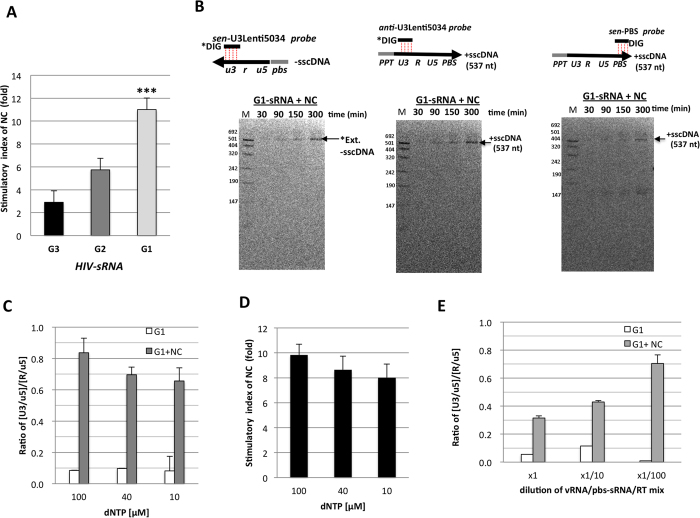
Retroviral reverse transcription is accomplished by sequential strand-transfers of partial cDNA intermediates copied from viral genomic RNA. Here, we revealed an unprecedented role of 5'-end guanosine (G) of HIV-1 genomic RNA for reverse transcription. Based on current consensus for HIV-1 transcription initiation site, HIV-1 transcripts possess a single G at 5'-ends (G1-form). However, we found that HIV-1 transcripts with additional Gs at 5'-ends (G2- and G3-forms) were abundantly expressed in infected cells by using alternative transcription initiation sites. The G2- and G3-forms were also detected in the virus particle, although the G1-form predominated. To address biological impact of the 5'-G number, we generated HIV clone DNA to express the G1-form exclusively by deleting the alternative initiation sites. Virus produced from the clone showed significantly higher strand-transfer of minus strong-stop cDNA (-sscDNA). The in vitro assay using synthetic HIV-1 RNAs revealed that the abortive forms of -sscDNA were abundantly generated from the G3-form RNA, but dramatically reduced from the G1-form. Moreover, the strand-transfer of -sscDNA from the G1-form was prominently stimulated by HIV-1 nucleocapsid. Taken together, our results demonstrated that the 5'-G number that corresponds to HIV-1 transcription initiation site was critical for successful strand-transfer of -sscDNA during reverse transcription.


Figures

Figure 1
Figure 1. Analysis of 5′-end nucleotides of HIV-1 RNA.
(A) HIV-1 transcription initiation sites were located within the GGG tract (underlined) at the U3/R junction of HIV-1 provirus DNA. Nucleotide sequences of HIV-1 transcripts initiated at each G within the GGG tract (G1-, G2- or G3-form) were shown. (B) mRNA fraction from MOLT4/IIIB cells (cellular) or from virus particles (virus particle) was subjected to the 5′-RACE analysis. Value was shown as frequency of each number of 5′-G among ~30 clones analyzed. (C) 293T cells were transfected with HIV-1 molecular clone (pNL-luc∆env) together with VSV-G expression vector. At 48 h post-transfection, mRNA was isolated from 293T cells or from virus particles and subjected to the 5′-RACE analysis. Value was shown as frequency of each number of 5′-G among ~30 clones analyzed.
Figure 2
Figure 2. Generation of HIV-1 from DNA clone with a deletion mutation at the GGG tract.
Construct of the modified pNL-luc∆env clone (5′-G1) was schematically depicted. In the 5′-G1 clone, two Gs were deleted in the GGG tract at 5′ LTR, while the GGG tract in the 3′ LTR was kept intact. Expected transcription initiation site was indicated as +1 (A). 293T cells were transfected with modified pNL-luc∆env vector (5′-G1) together with VSV-G expression vector (pMD.G). At 48 h post-transfection, mRNA was isolated from virus particles and subjected to the 5′-RACE analysis. Value was shown as frequency of each number of the 5′-G among ~30 clones analyzed (B). The levels of virus gene expression and virus particle release were determined by measuring luciferase activity (Luc activity) in the cell lysate (C) and HIV-1 p24 concentrations in the culture supernatant (D). Experiments were performed three times and representative experiments with means ± SE in duplicate assays are shown. Statistical significance was assessed by student t analysis (***p < 0.001).
Figure 3
Figure 3. Evaluation of the 5′-G on strand-transfer events of reverse transcription within cells.
Schematic flow of the reverse transcription was depicted. Gray or black lines represent HIV-1 genomic RNA or cDNA intermediates, respectively (A). Locations of the primers (R1-25, AA55, U3NL9496, BB301 and M661) to detect HIV-1 cDNA intermediates (R/u5, U3/u5, U3/pbs and U3/gag) were indicated. The minus-strand corresponding to the U3, R, U5 and PBS regions were shown by small characters of u3, r, u5 and pbs, respectively. For infection experiment, virus fraction containing ~80 ng of p24 was inoculated into 293T cells (1 × 106 cells). Total DNA was extracted from the infected cells at 2, 4, 8, 12 or 20 h post-infection. An aliquot of each virus preparation was incubated at 65°C for 30 min and used as a heat-inactivated control. Each sample was subjected to the qPCR analysis with the primer pairs to measure the amount of cDNA intermediates with primer pairs specific for the R/u5 region of HIV-1 (M667/AA55), the U3/u5 region (U3NL9496/AA55), the U3/pbs region (U3NL9496/BB301) or the U3/gag region (U3NL9496/M661). Values were shown as copy numbers in 1μ of DNA samples corresponding to ~1 × 104 cells. Value for DNA sample infected with each heat-inactivated control was shown at 0 h post-infection as a background (B). The efficiency of 1st strand-transfer (C), (+) strand synthesis (D) and 2nd strand-transfer (E) at each time point after infection were estimated based on the qPCR analysis as described in Materials and Methods. Means ± SE in duplicate assays are shown. Statistical significance was assessed by student t analysis (***: p < 0.001). HIV-1 gene expression from proviral DNA was determined by measuring luciferase activity (luc activity) in the cell lysate at 20 hr post-infection of each virus (F). Relative luc activity normalized to the level of U3/gag at 20 h post-infection was calculated. Values were shown as a relative ratio to the relative luc activity of WT as 1.0. These experiments were performed three times and representative experiments with means ± SE in duplicate assays are shown. Statistical significance was assessed by student t analysis (n.s.: not significant).
Figure 4
Figure 4. Reconstitution of HIV-1 reverse transcription in vitro.
(A) Genomic information of the synthetic HIV-1 RNA (HIV-sRNA, 3625-nt) was depicted on the top of figure. The nucleotide sequences of T7-R forward primer were shown with the transcriptional initiation site (+1). The promotor sequences for T7 polymerase were underlined. The HIV-sRNA initiates at 5′ end of R region in the 5′ LTR and terminates at 3′ end of R region in the 3′ LTR. Locations of the primer binding site (PBS) and polypurine tract (PPT) in the transcript was indicated. Other cis-elements derived from the lentiviral vector were also indicated; splice donor site (SD), packaging signal (Ψ), rev responsive element (RRE), splicing acceptor site (SA), central polypurine tract/central termination sequence (cPPT/CTS), cytomegalovirus promoter/multiple cloning site (CMV/MCS) and woodchuck hepatitis virus posttranscriptional regulatory element (PRE). (B) Recombinant HIV-1 RT (rRT) in heterodimeric form (p66/p51) was generated by proteolysis of the rRT in homodimer form (p66/p66) with HIV-1 protease. Final preparation of the p66/p51 was subjected to SDS-PAGE followed by staining with coomassie brilliant blue and western blot analysis with anti-HIV-1 RT antibody. (C) Primer-dose dependency of the cDNA synthesis was examined with three different amounts of HIV-sRNA (0.83, 8.3 or 83 fmol) and 1.7 pmol of rRT. The level of R/u5 in two μl of diluted reaction sample after 90 min incubation at 42 °C was determined by qPCR. The experiment was performed in duplicate for each reaction and the mean value with error bar of ± standard deviation (S.D.) was plotted.
Figure 5
Figure 5. Time course analysis of cDNAs and strand transfer in vitro.
(A) In vitro RT assay was performed with 68 fmol of HIV-sRNA, 100 pmol of pbs-sRNA primer and 1.7 pmol of rRT in 20 μl of reaction volume at 42 °C for 30, 60, 90 or 300 min (■). The reaction without pbs-sRNA was carried out in parallel (△). Levels of the cDNA intermediates (R/u5, U3/u5, U3/pbs and U3/gag) were determined by qPCR. Values are shown as copy numbers of the cDNA intermediates in two μl of diluted reaction sample. The experiment was performed in duplicate for each reaction and the mean value with error bar of ±1S.D. of each sample was shown. (B) Aliquot of each reaction for the time-course analysis was subjected to Southern blot analysis under denatured condition. DIG-labeled HIV-1 primer R1-25 (DIG-R1-25 probe) was used to detect -sscDNA and its extended products. The -sscDNA and pbs-sRNA were shown by black arrow and grey bar. The minus-strands corresponding to the R, U5 and PBS regions were indicated with small characters of r, u5 and pbs, respectively (top). The bands corresponding to -sscDNA (200 nt) and abortive cDNA products (#1–#4) were indicated. DIG-labeled DNA size marker (DNA Molecular Weight Marker VIII, Roche) was used as a size marker (M). The PCR products that span 54 nt upstream of the PPT to 5′-end of the U5 (+54ppt/u5, 573 nt), the R to 5′-end of gag (R1/gag, 240 nt) and the R to 5′-end of U5 (R1/u5, 180 nt) regions of pCSII-CMV-MCS vector were used as positive controls (P.C.) to test specificity for a DIG-probe.
Figure 6
Figure 6. Evaluation of the 5′-G on strand-transfer by in vitro reverse transcription assays.
(A) HIV-sRNAs containing one (G1-form), two (G2-form) or three Gs (G3-form) at their 5′-ends were synthesized in vitro using HIV-1 DNA templates prepared with the modified T7-R forward primers. The nucleotide sequences corresponding to the T7-promotor region were underlined. Italics represented 5′-terminal nucleotide sequences of each HIV-sRNA. +1: the transcriptional initiation site. (B) In vitro reverses transcription was performed with HIV-sRNA with G1-, G2- or G3-form for 300 min, followed by Southern blot analysis using the DIG-R1-25 probe. The band corresponding to -sscDNA (198-200 nt) and abortive cDNA products (#1-#4) were denoted. DNA size marker (M) and positive controls (P.C.) were run together as described in Figure 5. (C) The efficiency of 1st strand-transfer in the reaction with HIV-sRNA with G1-, G2- or G3-form was estimated by qPCR analysis as described in Materials and Methods. The experiment was performed in duplicate for each reaction and the mean value with error bar of ±1S.D. of each sample was shown. This experiment performed at least three times and representative result was shown. Statistical significance was assessed by student t analysis (*p < 0.05, ***p < 0.001).
Figure 7
Figure 7. Stimulatory effects of HIV-1 NC on 1st strand-transfer.
(A) The G1-form of HIV-sRNA (68 fmol) and pbs-sRNA (100 pmol) were pre-incubated with sNC (10 pmol) for 5 min at 37 °C. Pre-incubation without sNC was carried out in parallel as a control. Reaction was initiated by adding the reaction mixture containing 1.7 pmol of rRT (p66/51). After incubation for 300 min at 42 °C, each reaction was subjected to the qPCR analysis. Efficiency of 1st strand-transfer was estimated as described in Fig. 3. The ratio of the 1st strand-transfer efficiency in the presence of sNC to that without sNC was shown as stimulatory index. Experiment was performed in duplicate for each reaction and the mean value with error bar of ±1S.D. of each sample was shown. This experiment performed at least three times and representative result was shown. Statistical significant was assessed by student t analysis (***p < 0.001). (B) Time course analysis of the cDNAs generated from the G1-form of HIV-sRNA with sNC was addressed by Southern blot analysis using the DIG-R1-25, DIG-anti-U3Lenti5034 or DIG-senPBS probe. The bands corresponding to –sscDNA (200 nt), +sscDNA (537 nt), the abortive products (#1–#4) and extent products of -sscDNA after successful 1st strand-transfer (*EP) were denoted. DNA size marker (M) and positive controls (P.C.) were run together as described in Fig. 5. In vitro reverses transcription was performed with G1-form of HIV-sRNA in reaction buffer containing 10, 40 or 100 μM of dNTPs. The levels of cDNA intermediates in the reaction at 300 min were determined by qPCR. The efficiency of 1st strand-transfer (C) and stimulatory effect of sNC (D) was shown. In vitro reverses transcription was performed with serial 10-fold dilution of G1-form HIV-sRNA (68 pmol), pbs-sRNA (100 pmol) and rRT (1.7 pmol) complex in the presence or absence of sNC. The efficiency of 1st strand-transfer of each reaction was presented (E). Experiments performed in triplicates. Significant of stimulatory effect of sNC was examined by student t analysis (***p < 0.001). nd: not determined because the amount of the U3/u5 was under detection level.

References

    1. Ilina T., Labarge K., Sarafianos S. G., Ishima R. & Parniak M. A. Inhibitors of HIV-1 Reverse Transcriptase-Associated Ribonuclease H Activity. Biology 1, 521–541 (2012). - PMC - PubMed
    1. Cook P. R. A model for reverse transcription by a dimeric enzyme. The Journal of general virology 74, 691–697 (1993). - PubMed
    1. Hizi A., McGill C. & Hughes S. H. Expression of soluble, enzymatically active, human immunodeficiency virus reverse transcriptase in Escherichia coli and analysis of mutants. Proc Natl Acad Sci USA 85, 1218–1222 (1988). - PMC - PubMed
    1. Jacobo-Molina A. et al. Crystal structure of human immunodeficiency virus type 1 reverse transcriptase complexed with double-stranded DNA at 3.0 A resolution shows bent DNA. Proc Natl Acad Sci USA 90, 6320–6324 (1993). - PMC - PubMed
    1. Sevilya Z., Loya S., Hughes S. H. & Hizi A. The ribonuclease H activity of the reverse transcriptases of human immunodeficiency viruses type 1 and type 2 is affected by the thumb subdomain of the small protein subunits. J Mol Biol 311, 957–971 (2001). - PubMed

Publication types

LinkOut - more resources