. 2015 Dec 3:6:8983.
doi: 10.1038/ncomms9983.

Osteoclasts control reactivation of dormant myeloma cells by remodelling the endosteal niche

Affiliations

Osteoclasts control reactivation of dormant myeloma cells by remodelling the endosteal niche

Michelle A Lawson et al. Nat Commun. .

Abstract

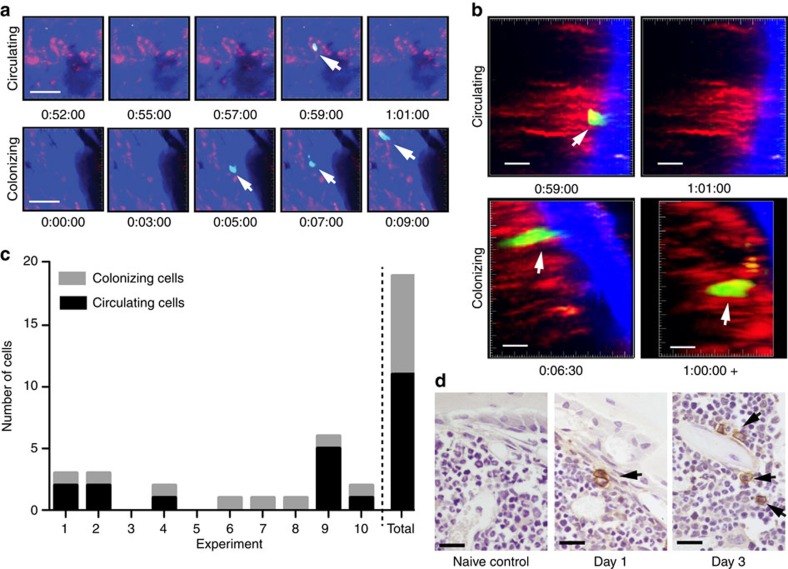
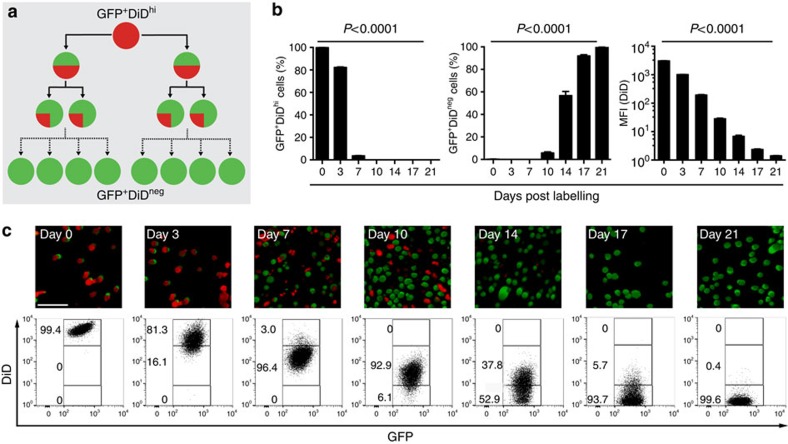
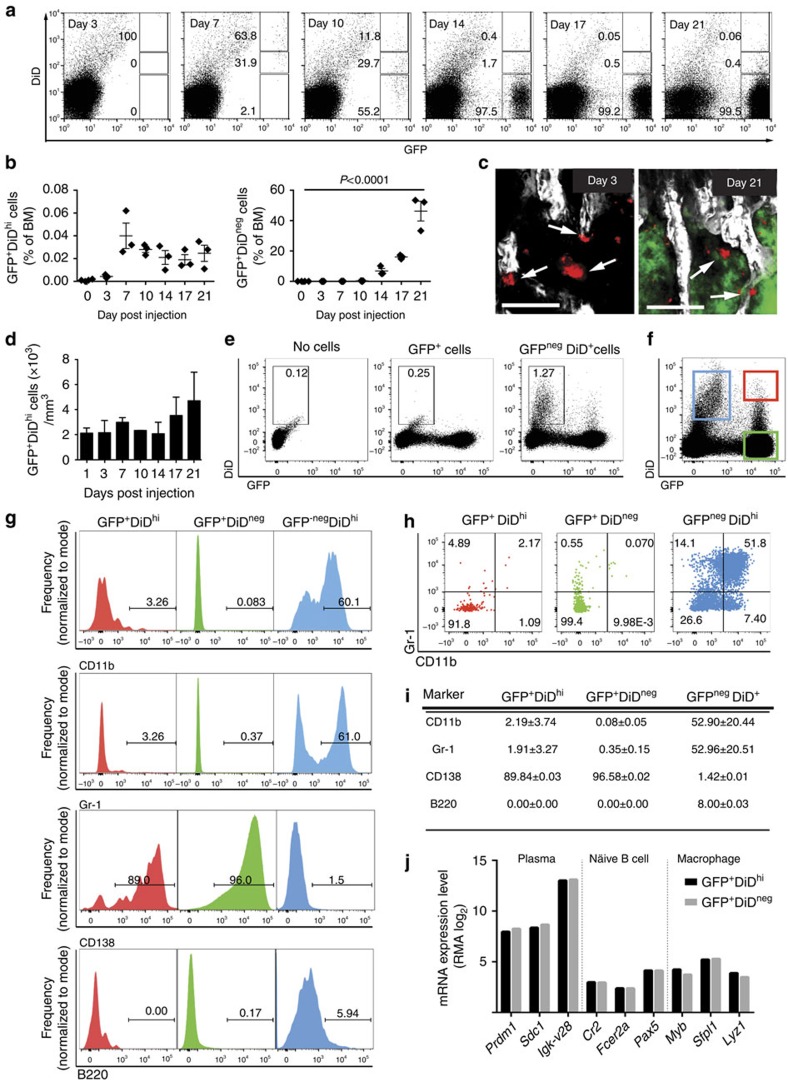
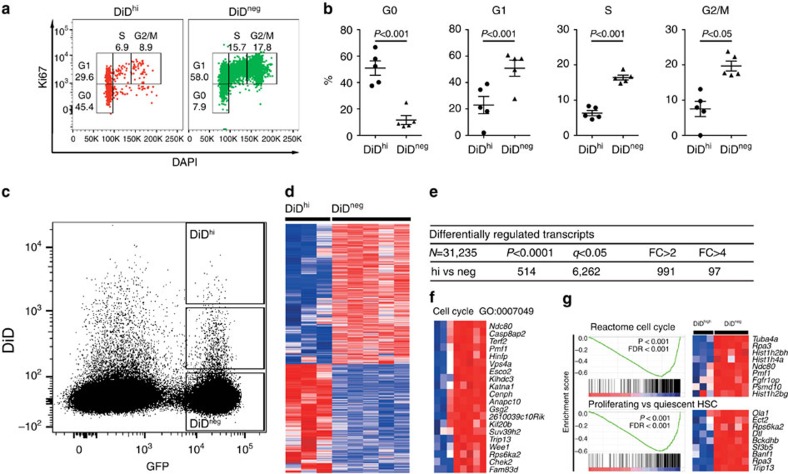
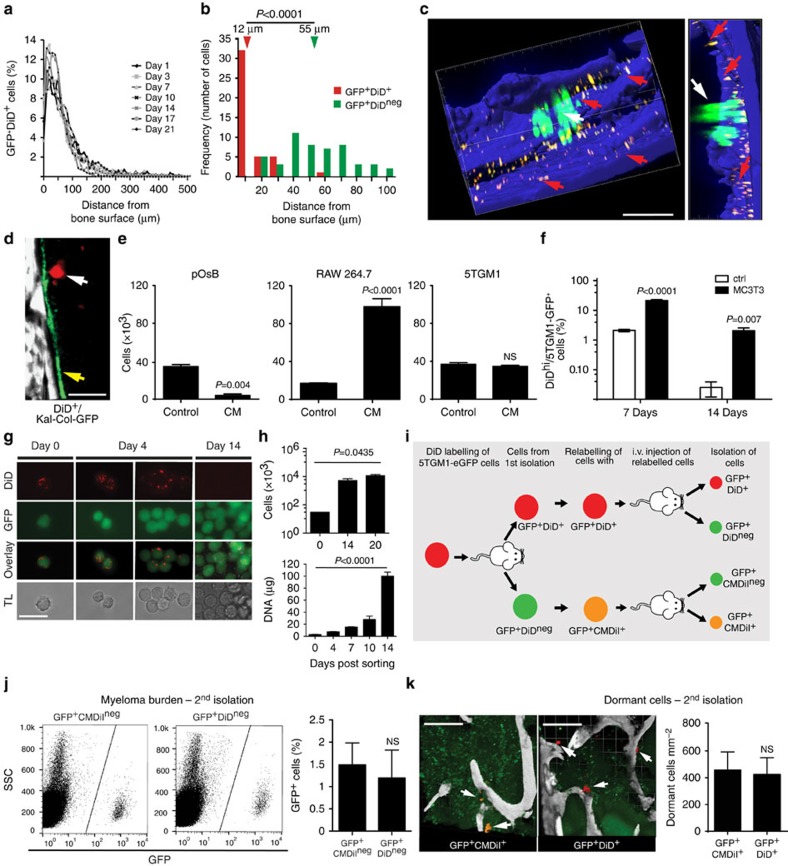
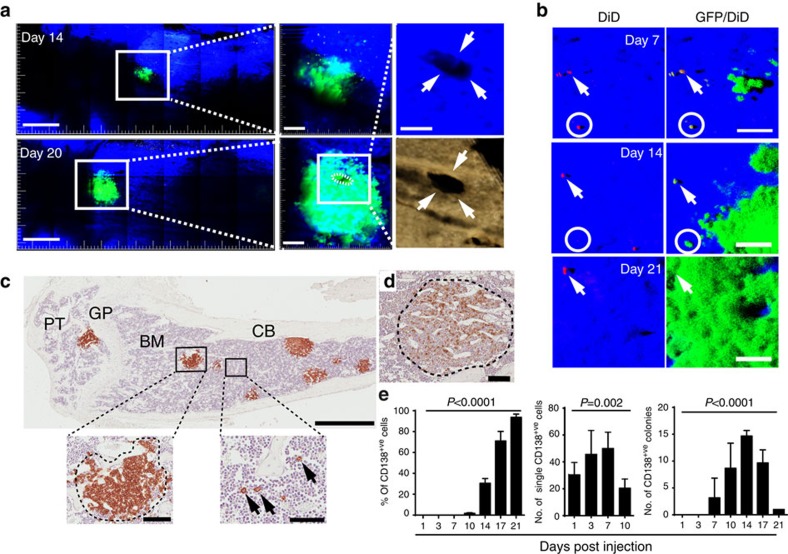
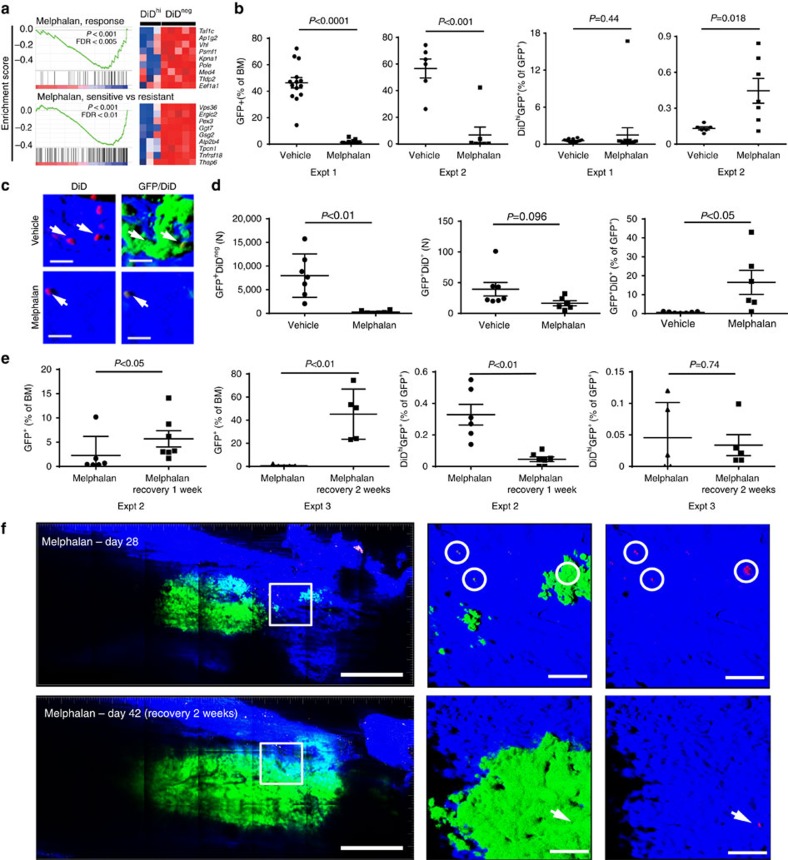
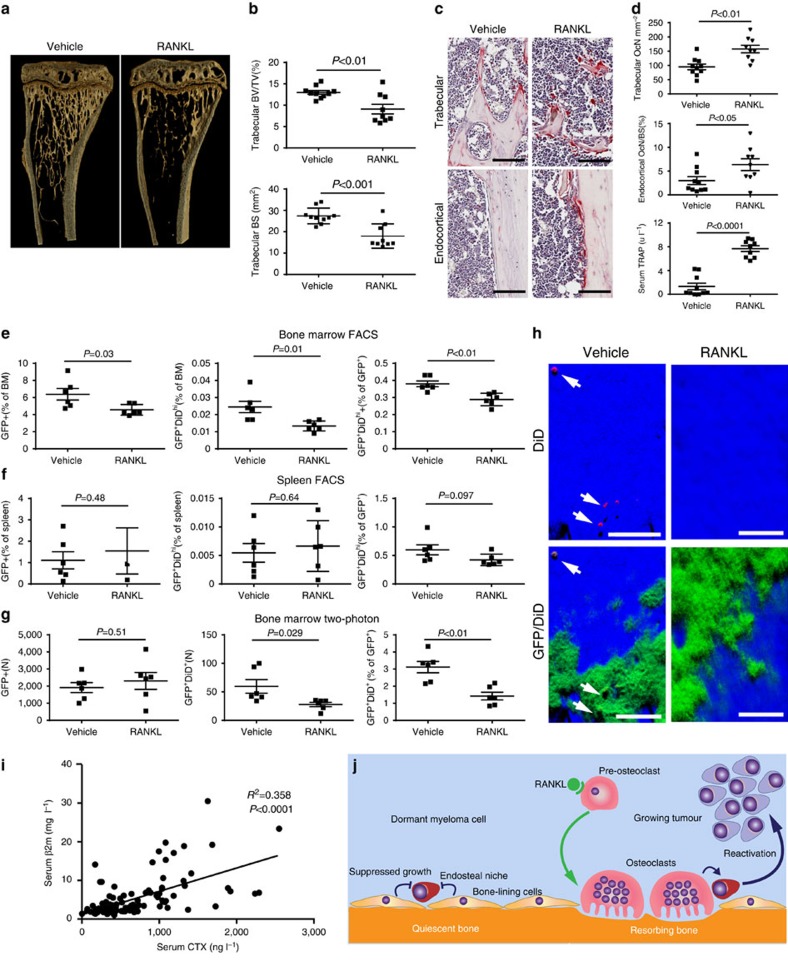
Multiple myeloma is largely incurable, despite development of therapies that target myeloma cell-intrinsic pathways. Disease relapse is thought to originate from dormant myeloma cells, localized in specialized niches, which resist therapy and repopulate the tumour. However, little is known about the niche, and how it exerts cell-extrinsic control over myeloma cell dormancy and reactivation. In this study, we track individual myeloma cells by intravital imaging as they colonize the endosteal niche, enter a dormant state and subsequently become activated to form colonies. We demonstrate that dormancy is a reversible state that is switched 'on' by engagement with bone-lining cells or osteoblasts, and switched 'off' by osteoclasts remodelling the endosteal niche. Dormant myeloma cells are resistant to chemotherapy that targets dividing cells. The demonstration that the endosteal niche is pivotal in controlling myeloma cell dormancy highlights the potential for targeting cell-extrinsic mechanisms to overcome cell-intrinsic drug resistance and prevent disease relapse.


Figures

Figure 1
Figure 1. Intravital two-photon microscopy of cancer cells colonizing bone.
(a) Still-frames capturing the arrival of a circulating tumour cell (top panels) and colonizing tumour cell (bottom panels) in real time. Blue, bone; red, vasculature; green, 5TGM1-GFP myeloma cells. Scale bars, 50 μm. It corresponds to Supplementary Movies 1 and 2. (b) Still-frames of the same cells in a showing egress of circulating cell from bone after 2 min and retention of a colonizing cell >1 h in the bone. Blue, bone; red, vasculature; green, 5TGM1-GFP myeloma cells. Scale bars, 20 μm. (c) Proportion of cells that circulated through or colonized the bone marrow in each experiment and total of all experiments. (d) CD138-stained sections from naive, or cell-injected mice at 1 and 3 days post injection. Single CD138+ cells (brown, black arrows), haematoxylin counterstain. Scale bars, 20 μm. Data represent at least three experiments.
Figure 2
Figure 2. Labelling and tracking dormant cancer cells in vitro.
(a) Schematic of DiD labelling to identify non-dividing cells. (b) FACS analysis of the DiD level over 21 days of in vitro culture showing percentage of DiDhi and DiDneg cells (left, middle panel) and mean fluorescence intensity (MFI) of the DiD level (mean±s.e.m., one-way ANOVA). (c) Fluorescent microscopy (top panels) and FACS analysis (bottom panels) of cultured DiD-labelled cells. Numbers indicate percentages of GFP+ cells in the gates. Scale bar, 150 μm.
Figure 3
Figure 3. Labelling and tracking dormant myeloma cells in vivo.
(a) FACS analysis of bone marrow (BM) cells after inoculation of GFP+DiD-labelled 5TGM1-eGFP cells. Numbers indicate percentages in the gates. (b) Percentage of total BM of GFP+DiDhi dormant cells and GFP+DiDneg cells by FACS analysis from a (individual data points and mean±s.e.m., one-way ANOVA). (c) Two-photon images of the metaphyseal region of explanted tibias harvested at days 3 and 21. White, bone; red, GFP+DiD+ cells (white arrows); green, GFP+DiDneg cells. Scale bars, 200 μm. (d) Enumeration of GFP+DiD+ cells (mean+s.e.m.). Data represent 4–5 individual mice. (e) FACS plots of BM samples from naive (no cells), mice injected with GFP cells not labelled with DiD (GFP+DiDneg) or injected with DiD-labelled GFP+ cells (GFP+DiD+), % of BM cells presented. (f) FACS plot demonstrating the three populations of cells examined in gi. (g) Histograms showing the frequency of cells that are CD11b+, Gr-1+, CD138+ or B220+ for each cell population from f. (h) FACS plots showing distribution of CD11b and Gr-1-expressing cells in each GFP/DiD population from f. (i) Table showing the % of cells (mean+s.e.m.) that are CD11b+, Gr-1+, CD138+ or B220+ for each cell population from f. (j) Transcript profile of GFP+DiDhi and GFP+DiDneg cells showing the expression level of plasma cell, naive B-cell and myeloid lineage genes.
Figure 4
Figure 4. Confirmation of GFP+DiDhi cell population as dormant myeloma cells.
(a) FACS plot showing gating of GFP+ DiDhi and GFP+ DiDneg cells in G0, G1, S and G2/M cell cycle phases as determined by Ki67 expression and DAPI staining on day 21. FACS plot shown is pooled data from five mice. (b) Distribution of DiDhi and DiDneg cells in G0, G1, S and G2/M phase of the cell cycle from gating shown in a. Data represent 4–5 individual mice (mean±s.e.m., paired t-test). (c) Gates used for FACS sorting of GFP+DiDhi and GFP+DiDneg cells. (d) Heatmap showing differentially expressed genes. (e) Table of differentially transcribed genes between the three cell populations. (f) Gene expression analysis showing genes involved in cell cycle and replication, transcriptional and translational activity, which were expressed at lower levels in dormant cells when compared with GFP+DiDneg cells isolated from the same mice. (g) Selected regulatory gene sets determined by GSEA, including negative enrichment for gene sets related to cell cycle progression and regulation of HSC quiescence in DiDhi vs DiDneg cells. Dot plots represent concatenated myeloma populations from six tumour-bearing mice.
Figure 5
Figure 5. Dormancy can be switched on and off by the bone environment.
(a) Measurement of distance of GFP+DiD+ cells to the nearest bone surface. (b) Comparison of the location of GFP+DiD+ and GFP+DiDneg cells. Arrows indicate median distance from bone surface. (c) Three-dimensional two-photon image of green GFP+DiDneg cells (white arrow) and yellow GFP+DiD+ cells (red arrows) localized to the bone surface, blue; scale bar, 100 μm. (d) Two-photon image of a DiD-labelled 5T33MM cell (arrow) localizing to the bone surface (SHG, white) lined with osteoblasts (col2.3 GFP+, green). (e) Effect of conditioned media (CM) from primary osteoblasts (pOsB, left panel), macrophage cell line (RAW264.7, middle panel) and myeloma cells (5TGM1, right panel) on cancer cell dormancy, unpaired t-test. (f) Effect of co-culture with osteoblast cell line MC3T3 on cancer cell dormancy. (g) Fluorescent and bright-field microscopy from in vitro cultures of FACS-sorted GFP+DiDhi long-term dormant cells; scale bar, 25 μm. (h) Cell count and DNA content of in vitro cultures from g, one-way ANOVA. (i) Schematic for isolation (day 21 post inoculation) and reinoculation of dormant GFP+DiD+ and activated GFP+DiDneg cells. (j) FACS analysis of bone from mice after second passage for myeloma cell burden. Data show percentage of GFP+ per bone marrow cells (mean±s.e.m., unpaired t-test). (k) Localization of dormant GFP+CMDiI+ (white arrows, left panel) and dormant GFP+DiD+ (white arrows, middle panel) cells adjacent to bone surfaces from two-photon microscopy of ex vivo tibia (bone, white) and enumeration of GFP+CMDiI+ and GFP+DiD+ cells per mm2 bone. Scale bars, 200 μm. Data in e,f,h,j and k show mean±s.e.m. Data represent at least two experiments. NS, not significant.
Figure 6
Figure 6. Longitudinal intravital two-photon imaging of dormant cancer cell activation and colony formation.
(a) Mosaic tile maximum intensity projection of the same 3 mm region of interest in the same tibia over time at 14 and 20 days showing expansion of a single GFP+DiDneg colony (green); scale bar 400 μm. Middle panel enface z-stacks of each colony, right top, higher magnification of the MIP image from the 20-day z-stack with the green removed revealing a hole in the cortical bone. This hole was associated with the GFP+DiDneg colony at 20 days and was also captured by 3D reconstruction of a MicroCT scan, right bottom; scale bars, 40 μm. (b) Three-dimensional maximum intensity projection of the same tibia at 7, 14 and 21 days showing expansion of a GFP+DiDneg colony (green), persistence of the dormant GFP+DiD+ cell (white arrow) and disappearance of a transitioning GFP+DiD+ cell (white circle). Scale bars, 50 μm. (c) Immunohistochemistry (IHC) showing eight individual CD138+ cancer cell colonies (brown) within the bone marrow on day 14 (left panel). Scale bar, 1 mm. Inset shows an individual colony (left: scale bar, 100 μm) and multiple single CD138+ cells (black arrows) adjacent to bone surfaces (right: scale bar, 50 μm). BM, bone marrow; CB, cortical bone; GP, growth plate; PT, proximal tibia. (d) IHC of CD138+ stained cancer cell colony from the 5T2MM murine model of myeloma (scale bar, 100 μm). (e) Quantification of IHC-stained CD138+ single cells and colonies within the bone marrow. Data are represented per section of the entire bone. Data (mean±s.e.m., one-way ANOVA) represent at least two experiments.
Figure 7
Figure 7. Preclinical testing of drug efficacy against dormant cancer cells.
(a) Gene set enrichment analysis of genes associated with melphalan sensitivity downregulated in the GFP+DiDhi as compared with GFP+DiDneg cells. (b) FACS analysis of total GFP+ cells (left panels. % of bone marrow cells) and GFP+DiDhi cells (right panels, % of GFP+ cells) for two separate experiments (expt 1 and expt 2). Data show mean±s.e.m. and represent 6–10 mice per group. (c) Three-dimensional maximum intensity projection from ex vivo two-photon imaging of bone from vehicle (top panels) and melphalan-treated mice (bottom panels). Scale bar, 20 μm. (d) Data from Imaris generated spots on mosaic tiles of femurs from vehicle and melphalan-treated mice for number of GFP+ cells (left panel) and number of GFP+DiD+ cells (middle panel) per bone. Percent GFP+DiD+ of GFP+ cells is also shown (right panel). Data show mean±s.e.m. and represent six mice per group (e) FACS analysis of GFP+ cells (left panels, % of bone marrow cells) and GFP+DiDhi cells (right panels, % of GFP+ cells) in melphalan-treated mice to day 28 (melphalan) or recovered from melphalan (melphalan recovery: 1 or 2 weeks) for two separate experiments (expt 2 and expt 3). Data show mean±s.e.m. and represent 6–10 mice per group, unpaired t-test. (f) Mosaic tiled images of intravital two-photon imaging of the same mouse at days 28 when melphalan was ceased, and day 42 after 2 weeks of recovery following melphalan cessation. Middle panel, higher-magnification images of the region in the white box in the same position of the bone at days 28 and 42. At day 28, small green (GFP+DiDneg) colonies and single red (GFP+DiD+) cells (white circles) are shown more clearly when the green channel is removed from the image (right panels). At day 42, all of the red (GFP+DiD+) cells have been activated and the green (GFP+DiDneg) colonies expanded, except for a single red cell (arrow). Scale bars, 500 μm (left panel), 100 μm (middle and right panels).
Figure 8
Figure 8. RANKL-driven alterations in the endosteal niche activate dormant tumour cells.
(a) Three-dimensional reconstructions of MicroCT scans of representative tibia from vehicle- and RANKL-treated naive mice after 3 days of treatment. (b) Trabecular bone volume of total volume (BV/TV) and trabecular bone surface (BS) in metaphyseal bone in vehicle- and RANKL-treated mice. (c) Representative sections of TRAP-stained tibia from trabecular and endocortical regions of vehicle- and RANKL-treated naive mice; scale bar, 100 μm. (d) Histograms of osteoclast surface per mm bone surface for trabecular (top) and endocortical (middle) bone and serum TRAP levels (bottom). Data are from one experiment with 9–10 mice per group. (e) FACS analysis of GFP+DiDneg cells (left, % of bone marrow cells), GFP+DiDhi (middle % of bone marrow cells) and percent GFP+DiDhi (right % of GFP+) from bone marrow samples. (f) FACS analysis of GFP+ cells (left, % of spleen cells), GFP+DiDhi (middle, % of spleen cells) and GFP+DiDhi (right, % of GFP+) from spleen samples. (g) Analysis of two-photon mosaic tiles of total number of GFP+ cells (left), number of GFP+DiDhi cells (middle) and GFP+DiDhi (right % of GFP+) in the analysed endocortical region. Data show mean±s.e.m. and represent 6–10 mice per group, unpaired t-test. (h) Two-photon generated 3D images of multiple GFP+DiD+ dormant cells (white arrows) in the vehicle-treated mice compared with few or none in the RANKL treated; scale bars, 60 μm. (i) Correlation between serum CTX and serum β2m levels in myeloma patients, Pearson's correlation. (j) Schematic depicting myeloma cell dormancy on quiescent bone surfaces and myeloma cell reactivation on actively resorbing bone surface. Data are from one experiment with six mice per group.

References

    1. Aguirre-Ghiso J. A. Models, mechanisms and clinical evidence for cancer dormancy. Nat. Rev. Cancer 7, 834–846 (2007). - PMC - PubMed
    1. Goss P. E. & Chambers A. F. Does tumour dormancy offer a therapeutic target? Nat. Rev. Cancer 10, 871–877 (2010). - PubMed
    1. Schardt J. A. et al. Genomic analysis of single cytokeratin-positive cells from bone marrow reveals early mutational events in breast cancer. Cancer Cell 8, 227–239 (2005). - PubMed
    1. Chambers A. F., Groom A. C. & MacDonald I. C. Dissemination and growth of cancer cells in metastatic sites. Nat. Rev. Cancer 2, 563–572 (2002). - PubMed
    1. San Miguel J. F. et al. Bortezomib plus melphalan and prednisone for initial treatment of multiple myeloma. N. Engl. J. Med. 359, 906–917 (2008). - PubMed

Publication types

Associated data