. 2015 Dec 3;528(7580):99-104.
doi: 10.1038/nature15765.

Overflow metabolism in Escherichia coli results from efficient proteome allocation

Affiliations

Overflow metabolism in Escherichia coli results from efficient proteome allocation

Markus Basan et al. Nature. .

Abstract

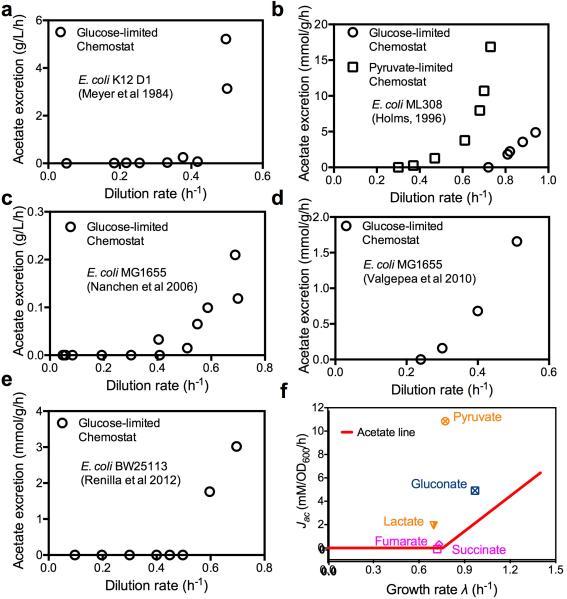
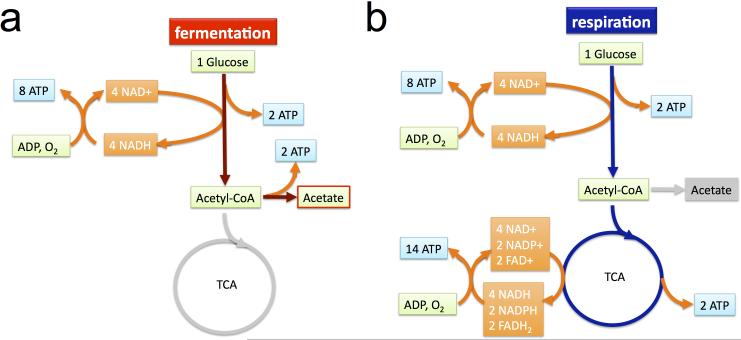
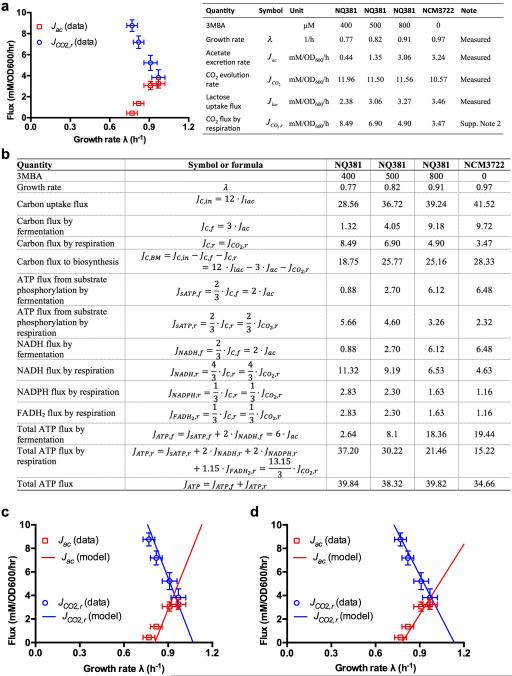
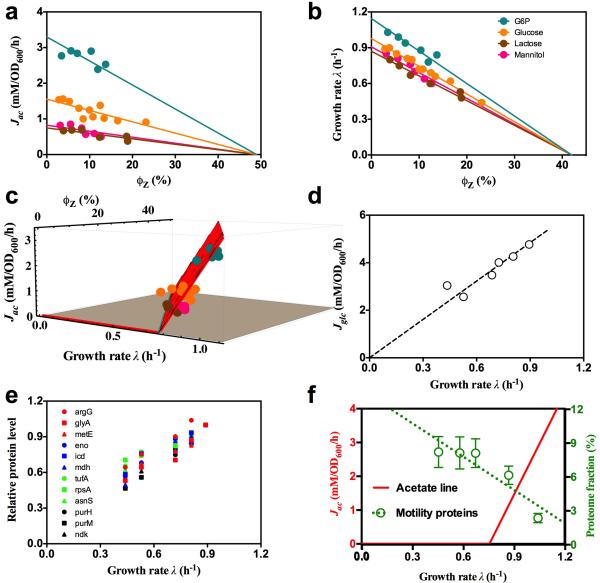
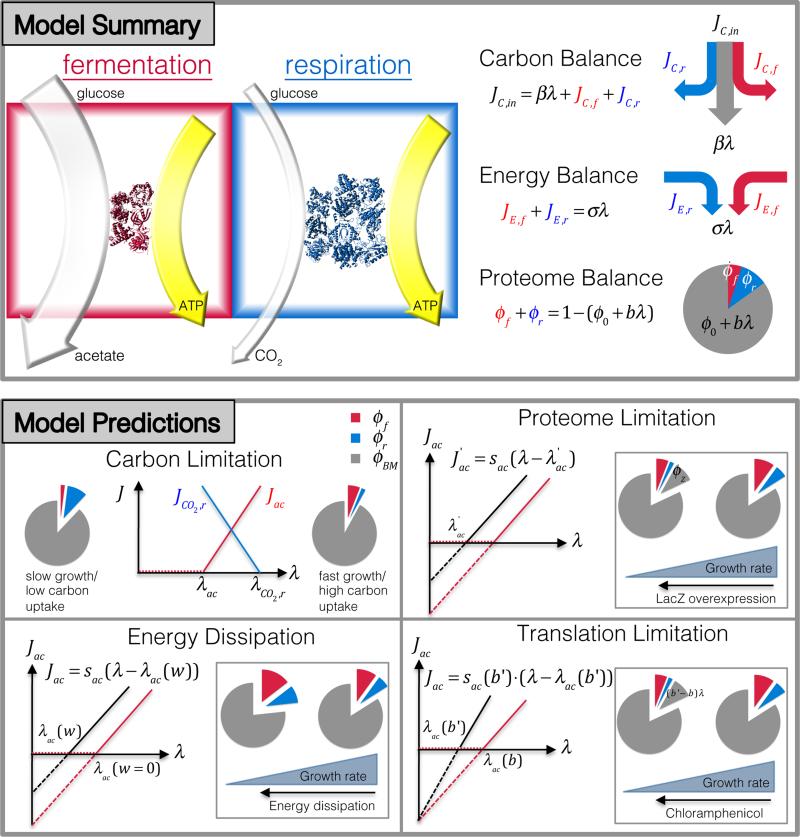
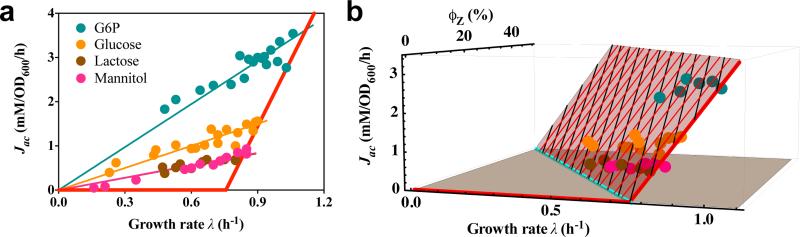
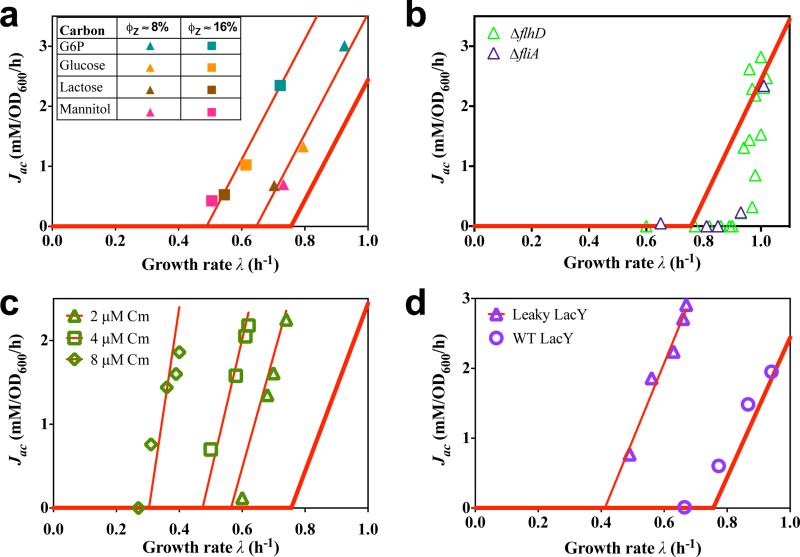
Overflow metabolism refers to the seemingly wasteful strategy in which cells use fermentation instead of the more efficient respiration to generate energy, despite the availability of oxygen. Known as the Warburg effect in the context of cancer growth, this phenomenon occurs ubiquitously for fast-growing cells, including bacteria, fungi and mammalian cells, but its origin has remained unclear despite decades of research. Here we study metabolic overflow in Escherichia coli, and show that it is a global physiological response used to cope with changing proteomic demands of energy biogenesis and biomass synthesis under different growth conditions. A simple model of proteomic resource allocation can quantitatively account for all of the observed behaviours, and accurately predict responses to new perturbations. The key hypothesis of the model, that the proteome cost of energy biogenesis by respiration exceeds that by fermentation, is quantitatively confirmed by direct measurement of protein abundances via quantitative mass spectrometry.


Figures

Extended Data Figure 1
Extended Data Figure 1. Acetate excretion data for E. coli cells grown in chemostat (a-e) and for cells growing on medium with non-glycolytic carbon sources (f)
a, Glucose-limited chemostat data based on the figure 1 of Meyer et al. b, Glucose-limited and pyruvate–limited chemostat data from Table 7 of Holms. c, Glucose-limited chemostat data based on figure 3 of Nanchen et al. Only data with dilution rates less than the apparent washout dilution rate are plotted here. d, Glucose-limited chemostat data from Table 1 of Valgepea et al. e, Glucose-limited chemostat data based on figure 4 of Renilla et al. f, E. coli K-12 NCM3722 was grown in minimal medium with one of five non-glycolytic carbon sources, including two gluconeogenic substrates (pyruvate and lactate), one substrate of the pentose phosphate pathway (gluconate), and two intermediates of the TCA pathway (succinate and fumarate). Deviation from the acetate line (the red line, as defined in Fig. 1 and Eq. (1) of the main text) is seen most strikingly for pyruvate, which excretes a very large amount of acetate, and to a lesser degree, also lactate and gluconate, which enters glycolysis as pyruvate. In the framework of our model, these deviations result from different proteome efficiencies of fermentation and respiration on these carbon sources. Note: Acetate excretion measurement was also attempted for growth on LB. However, growth on LB is not characterized by a single exponential steady state growth phase, as various constituents of the medium are depleted during the course of batch culture growth. Assuming exponential growth for OD600 data below 0.3 and alternatively from 0.3 for 0.5 gave doubling time of 18 min and 28 min, respectively. The corresponding acetate excretion rates were 14.3 and 3.6 mM/OD600/hr. These data should be regarded as semi-quantitative due to the non-steady nature of growth on LB.
Extended Data Figure 2
Extended Data Figure 2. The (oxidative) fermentation and respiration pathways
a, Schematic illustration of the fermentation pathway, using glucose as an exemplary carbon source. The pathway is shown as the colored part. One molecule of glucose is catabolized into two molecules of acetate and two molecules of CO2 (not shown in the diagram), with 4 molecules of ATP generated via substrate phosphorylation and also 4 molecules of NADH produced. In the aerobic environment, NADH molecules can be converted into ATP molecules. The total number of ATP molecules produced per glucose molecule is therefore 4+4x, where the conversion factor x indicates the number of ATP molecules converted from one NADH molecule (i.e., ATP:NADH = x:1). In the illustration, we assume that 2 molecules of ATP are converted from one NADH molecule, i.e., x=2. b, Schematic illustration of the respiration pathway, using glucose as an exemplary carbon source. The pathway is shown as the colored part. One molecule of glucose is catabolized into 6 molecules of CO2 (not shown in the diagram), producing 4 molecules of ATP, 6 molecules of NADH, 2 molecules of NADPH, and 2 molecules of FADH2. Using ATP:NADH = x:1, ATP:NADPH = x:1, and ATP:FADH2 = x:2, we have the total number of ATP molecules produced as 4+9x for the respiration pathway. Here in the illustration, we assumed x=2. Note that the ratio of total ATP produced from respiration over total ATP produced from fermentation depends on the conversion factor x, i.e., (4+9x)/(4+4x). The value of this ratio ranges from 1 (for x=0) to 9/4 (for x → ∞).
Extended Data Figure 3
Extended Data Figure 3. Growth-rate dependence of acetate production and CO2 evolution in bioreactor: data and comparisons to the model
a, The rate of CO2 evolution was determined in a bioreactor setup for wildtype and titratable LacY cells (NCM3722 and NQ381, respectively) grown in lactose minimum medium with various degrees of lactose uptake titration, and the result was used to deduce the CO2 flux produced by respiration (blue circles). Also plotted (red squares) is the acetate excretion rate measured in the bioreactor. See Supplementary Note 2 for details of this experiment and corresponding analysis. The inducer levels, growth rate, measurements of glucose, acetate, and CO2, and the deduced CO2 via respiration are shown in the table on the right. b, Deduced energy production fluxes from fermentation and respiration pathways, based on the measurements presented in panel a. Fluxes are in units of mM/OD600/h. c, Comparison of model and experimental data. Using the set of parameters summarized in Extended Data Table 2, the model solution (Eqs. [S14], [S17]) satisfactorily describes the experimental data obtained for acetate excretion (Jac) and respiratory CO2 production (JCO2,r) in the bioreactor for carbon limitation. These results depend on the assumed ratios of ATP-carbon conversion. As described in Sec. D1, the ratios we used in this work are ATP:NADH=2:1, ATP:NADPH=2:1 and ATP:FADH2=1.15:1. Note that these conversion ratios have never been precisely measured and could be substantially overestimated. However, the central results presented in this work are robust with respect to the choice of these conversion ratios. As an illustration, we show in panel d that the model results generated with a very different set of conversion ratios (ATP:NADH=0.5:1, ATP:NADPH=0.5:1 and ATP:FADH2=0.5:1) even provide a slightly better description of the data. [For these conversion ratios, the energy production of the cell matches the theoretical energy demand for biomass production.] The full model calibration requires the rate of CO2 evolution, which can only be measured in a bioreactor setup. We note a small discrepancy between acetate fluxes and growth rates obtained for cultures grown in bioreactor as compared to batch cultures, possibly caused by differences in aeration.
Extended Data Figure 4
Extended Data Figure 4. The effect of useless protein expression on acetate excretion
a. Acetate excretion rate by strain NQ1389 is plotted against the absolute abundance of the expressed LacZ proteins, reported as a fraction of total protein (ϕZ), for each of the four carbon sources described in Fig. 2a of the main text. The solid lines, depicting the linear decrease in acetate excretion, are model predictions (Eq. [S23]), with the lone parameter ϕmax ≈ 47% (the x-intercept of the line) determined from the least-mean-squares fit of the data in 3D plot of Fig. 2b, by a plane anchored to the acetate line. b, Alternatively, ϕmax can be determined from linear fits of growth rate vs. ϕmax for the 4 carbon sources shown. This results in a value ϕmax = 42% ± 5%. The solid lines in this panel are linear fits using ϕmax = 42%. [We note that over a broad growth rate range, ϕmax actually exhibits a growth-rate dependence (manuscript in preparation). Nevertheless, over the narrow growth rate range relevant for acetate excretion, this dependence is negligible. Hence, for the purposes of our paper, we consider ϕmax to be constant.] c. A different view of the 3D plot in Fig. 2b. d, Glucose uptake rate as a function of growth rate under LacZ overexpression. The circles are the data and the dashed line is the best-fit to the data passing through the origin. e, The relative protein levels of several representative genes, taken from amino acid synthesis (red), central metabolism (blue), protein synthesis genes (green), and nucleotide synthesis (black). As described in Hui et al, the vast majority of genes exhibited an expression pattern that is linearly proportional to the growth rate when growth is changed by increasing LacZ expression. f. Growth rate dependence of motility proteins under carbon limitation. The proteome fraction data (green symbols) is from the carbon limitation series in Hui et al, where growth rate was limited by titrating the lactose uptake for the strain NQ381. The motility proteins are proteins that are associated with the Gene Ontology term “GO: 0006810” (with GO name “locomotion”) as defined by the Gene Ontology Consortium. See Hui et al for detailed description of the experimental procedure and data processing. Note that the fraction of motility proteins increases the most in the growth range where acetate is excreted. Also note that the energy consumption by chemotaxis comprises a very minor fraction of the total energy budget, estimated to be in the order of 0.1%. Disabling the motility function therefore does not affect the cell's energy requirement.
Extended Data Figure 5
Extended Data Figure 5. Acetate excretion due to energy dissipation by DNP
DNP is a chemical known to dissipate membrane potential and thus imposes energy stress on the cell. Acetate excretion rates for the titratable glucose uptake strain (NQ1243) grown in medium with glucose and different concentrations of DNP were measured for different degrees of glucose uptake. The results are qualitatively similar to the data for the leaky LacY mutant NQ1313 (Fig. 3d), except for a systematic difference in the slopes of the resulting acetate lines (thin lines of different colors). The origin of this deviation is presumably a more complex action of DNP with additional effects on the cell as compared to the leaky LacY mutant. Indeed, it is known for instance that in addition to leakage of protons, DNP also causes leakage of osmolites through the membrane.
Extended Data Figure 6
Extended Data Figure 6. The relative expression levels of glycolysis proteins under proteome perturbation (by LacZ overexpression), and energy dissipation (by expressing leaky LacY)
Orange data points and linear fits result from the overexpression experiment (i.e., NQ1389 grown in glucose minimal medium with different induction levels of LacZ expression), and blue data points and fits are the leaky LacY series (i.e., the WT LacY strain NQ1312 and the Leaky LacY strain NQ1313 grown in glucose minimal medium with 200 μM 3MBA). The y-axis denotes relative protein levels, which were obtained by mass spectrometry with the same reference for the two series (see Methods). The x-axis is the growth rate (in units of h−1). The different trends of protein expression for the two series show the distinct nature of the two perturbations, demonstrating that these seemingly similar predictions for the acetate line (parallel shift to slow growth as shown in Fig. 3a and Fig. 3d) for the two perturbations, have distinct origins and exhibit distinctly different patterns of gene expression in accordance with model predictions derived in section C3 of Supplementary Note 1 (see Eqs. [S26] and [S36]). From the perspective of gene regulation, it is not obvious what causes the increased expression levels of glycolysis genes under energy dissipation; The transcription factor Cra in combination with the key central carbon intermediate fructose-1,6-bisphosphate (FBP) is recognized as the major regulator of glycolysis. FBP relieves the repression of glycolytic enzymes expression by Cra. The observed increase in the abundance of glycolytic enzymes under energy dissipation could be caused by a buildup of FBP, as energy stress limits protein polymerization. However, in this case, it is not clear what signaling pathway gives rise to the opposite responses of glycolytic enzymes to LacZ overexpression. Inset: Corresponding glucose uptake and acetate excretion rates for the two perturbations presented in the main figure. Glucose uptake and acetate excretion rates decreased proportional to growth rate for LacZ OE (as expected from the model Eqs. [S25], [S26] and [S29]). On the other hand, there was a marked increase in acetate excretion with energy dissipation for a roughly constant glucose uptake rate, as correctly anticipated by the model [Eq. S36]. Note that the protein abundance of Acs (main panel) shows that this increase in the acetate excretion rate was not caused by a drop in Acs. Instead, the observed increase of acetate excretion, together with the parallel increase in the expression level of glycolysis and TCA enzymes, points to the coordination of glycolytic and TCA fluxes in response to energy demand.
Extended Data Figure 7
Extended Data Figure 7. The relative expression level of TCA proteins under proteome perturbations (by protein overexpression) and energy dissipation (by using leaky LacY)
Orange data points and linear fits represent the overexpression experiment (i.e., NQ1389 with different induction levels of LacZ expression), and blue data points and fits are the leaky LacY series (using the strains NQ1312 and NQ1313 with WT LacY expression and with the Leaky LacY expression respectively). The y-axis denotes relative protein levels, which were obtained by mass spectrometry with the same reference for the two series (see Methods). The x-axis is growth rate (in units of h−1). The different trends of protein expression for the two series show the distinct nature of the two perturbations, demonstrating that these seemingly similar predictions on the acetate line (parallel shift to slow growth as shown in Fig. 3a and Fig. 3c) for the two perturbations, have distinct origins and exhibit distinctly different patterns of gene expression in accordance with model predictions derived in section C3 of Supplementary Note 1 (see Eqs. [S27] and [S37]). From the perspective of gene regulation, the transcription factor Crp is thought to be the major regulator of TCA enzyme expression in aerobic conditions. Crp-cAMP activity, which increases under carbon limitation, is known to activate the expression of most TCA enzymes. Together with the known role of Crp in upregulating the enzyme Acs which takes up acetate,, Crp is considered to be a major candidate for regulating energy metabolism and acetate excretion. However, our findings that the expression of TCA enzymes increased under energy dissipation while acetate excretion also increased (Extended Data Fig. 6 inset) cannot be accounted for by known mechanisms of Crp regulation, and instead suggest an important role of additional regulators in the coordination of energy biogenesis pathways.
Fig. 1
Fig. 1. Acetate excretion under carbon limitation
Acetate excretion rate (Jac) is linearly correlated with the growth rate (λ) for WT cells grown in minimal medium with various glycolytic carbon sources (black symbols), and for cells with titratable or mutant uptake systems (purple symbols) (Extended Data Table 1). Black diamonds indicate various carbon sources supplemented with 7 non-degradable amino acids. The red line shows the best-fit of all the data to Eq. [1].
Fig. 2
Fig. 2. Effect of protein overexpression on acetate excretion
a, Measured acetate excretion rate is plotted against growth rate for increasing degrees of the (useless) expression of LacZ in strain NQ1389, for several carbon sources indicated by circles of different colors. Thick red line is the acetate line of WT cells shown already in Fig. 1, and the thin lines are model predictions (Eq. [S26]), one for each carbon source of respective color. b, 3D plot of the data in panel a. The data lie largely on a plane spanned by the acetate line (thick red line) defined in Fig. 1, and the cyan line, λac(ϕz), which defines a linear shift in the threshold growth rate, λac, for different degrees of LacZ expression, as predicted by the model (Eq. [5]).
Fig. 3
Fig. 3. Effect of genetic and environmental perturbations on the acetate line: model and experiments
In all subplots, the thick red line represents the acetate line of WT cells (Fig. 1). a, For each fixed level of LacZ expression, growth of the overexpression strain NQ1389 on different carbon sources leads to parallel shifts of the acetate line, as demonstrated by the thin red lines, whose slopes are fixed to that of the WT acetate line and were fitted by only adjusting the threshold growth rates λac. b, Acetate excretion rate with glucose uptake titration (Pu-ptsG, Extended Data Table 1) for a ΔflhD strain (NQ1388) and a ΔfliA strain (NQ1539), both incapable of expressing motility proteins, regarded as “useless” in well-stirred culture. Because the motility proteins are only expressed significantly as growth rate decreases under carbon limitation (Extended Data Fig. 4f), acetate excretion deviates from the acetate line as growth rate decreases. The shift of the threshold growth rate λac in the two strains is quantitatively consistent with the model prediction (Eq. [5]), based on quantification of motility proteins (Extended Data Fig. 4f and Extended Data Table 3). c, For each fixed (sub-lethal) dose of chloramphenicol in the medium, acetate excretion rates were determined for different degrees of lactose uptake by the titratable LacY strain (NQ381, Extended Data Table 1). The thin red lines are model fits with the slope as the only fitting parameter. d, For the energy dissipating mutant (NQ1313) expressing the proton-leaking LacYA177V, acetate excretion rates (triangles) obtained from titrating the glucose uptake system (Extended Data Table 1) show a parallel shift of the acetate line (thin red line), obtained by fitting the data by adjusting only the threshold growth rate in accordance with model prediction (Eq. [S32]). For comparison, acetate excretion in cells expressing wildtype LacY from the same plasmid system (NQ1312, circles) adheres much closer to the acetate line of wildtype cells.
Fig. 4
Fig. 4. Partition of proteome fractions into flux components
a, The total abundance of all proteins devoted to glycolysis, TCA, and oxidative phosphorylation (OXPHOS) (defined in Supplementary Note 3), is represented as a fraction of total protein for various degrees of lactose uptake in strain NQ381. Different colors indicate the portions of these proteins dedicated to the biomass production, fermentation and respiration, estimated using the corresponding fraction of fluxes; see Supplementary Note 3. b, Energy fluxes through the fermentation and respiration pathways are plotted against their respective proteome fractions. The lines are linear regression of the data, with the slopes being the proteome efficiencies (f and r). The steeper slope (for fermentation) indicates higher ATP production per protein devoted to the pathway (lower protein cost), validating the central assumption of the proteome allocation model

References

    1. Neidhardt FC, Ingraham JL, Schaechter M. Physiology of the Bacterial Cell: A Molecular Approach. Sinauer Associates Inc; 1990.
    1. Wolfe AJ. The acetate switch. Microbiol Mol Biol Rev. 2005;69:12–50. doi:10.1128/MMBR.69.1.12-50.2005. - PMC - PubMed
    1. De Deken RH. The Crabtree effect: a regulatory system in yeast. J Gen Microbiol. 1966;44:149–156. - PubMed
    1. De Mey M, De Maeseneire S, Soetaert W, Vandamme E. Minimizing acetate formation in E. coli fermentations. J Ind Microbiol Biotechnol. 2007;34:689–700. doi:10.1007/s10295-007-0244-2. - PubMed
    1. Vander Heiden MG, Cantley LC, Thompson CB. Understanding the Warburg effect: the metabolic requirements of cell proliferation. Science. 2009;324:1029–1033. doi:10.1126/science.1160809. - PMC - PubMed

Publication types