. 2015 Dec 10;528(7581):212-7.
doi: 10.1038/nature16170. Epub 2015 Dec 2.

Signal integration by Ca(2+) regulates intestinal stem-cell activity

Affiliations

Signal integration by Ca(2+) regulates intestinal stem-cell activity

Hansong Deng et al. Nature. .

Abstract

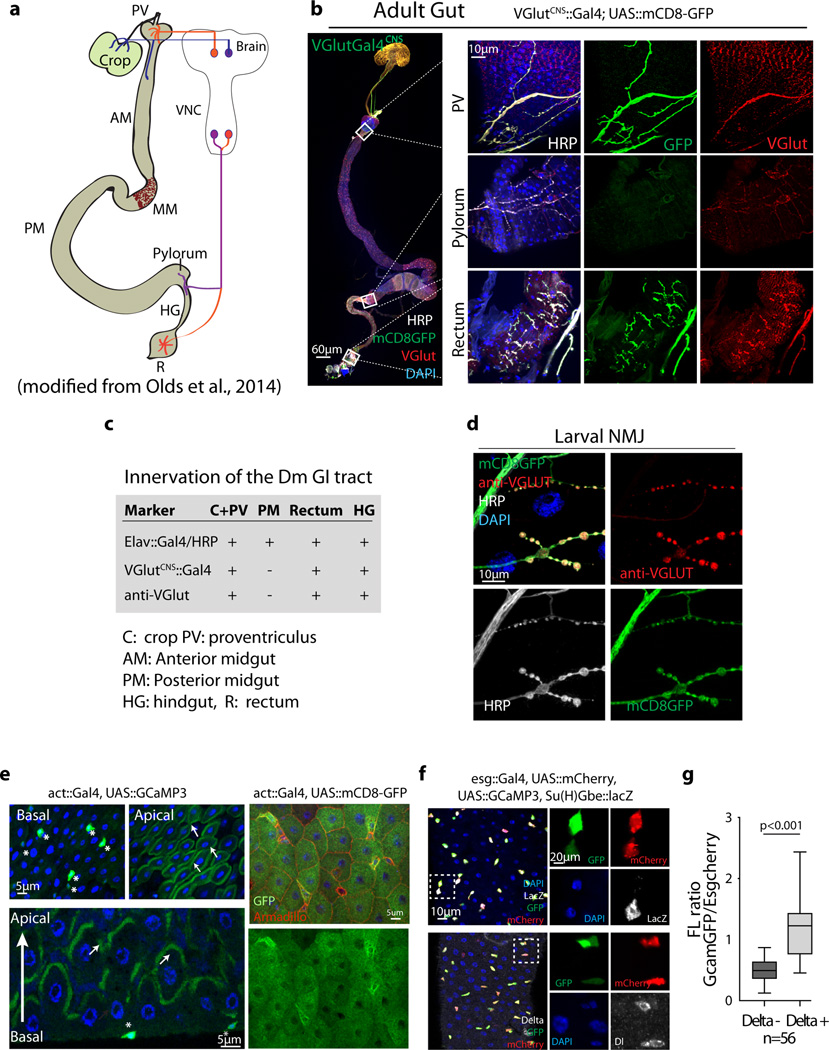
Somatic stem cells maintain tissue homeostasis by dynamically adjusting proliferation and differentiation in response to stress and metabolic cues. Here we identify Ca(2+) signalling as a central regulator of intestinal stem cell (ISC) activity in Drosophila. We show that dietary L-glutamate stimulates ISC division and gut growth. The metabotropic glutamate receptor (mGluR) is required in ISCs for this response, and for an associated modulation of cytosolic Ca(2+) oscillations that results in sustained high cytosolic Ca(2+) concentrations. High cytosolic Ca(2+) concentrations induce ISC proliferation by regulating Calcineurin and CREB-regulated transcriptional co-activator (Crtc). In response to a wide range of dietary and stress stimuli, ISCs reversibly transition between Ca(2+) oscillation states that represent poised or activated modes of proliferation, respectively. We propose that the dynamic regulation of intracellular Ca(2+) levels allows effective integration of diverse mitogenic signals in ISCs to adapt their proliferative activity to the needs of the tissue.


Figures

Extended Data Figure 1
Extended Data Figure 1. Integration of stress and dietary signals by Ca2+ signaling
a, We propose that Ca2+ signaling integrates and transduces nutritional and stress signals from the environment and from systemic and local paracrine sources to respond appropriately to tissue needs. In homeostatic conditions, ISCs are largely quiescent. Glutamate derived from protein in the food is absorbed by ECs through EAAT1, which is expressed throughout the gut, but at relatively higher levels in the anterior midgut. We propose that excessive dietary L-Glu is not efficiently resorbed by ECs and activates mGluR in ISCs. The L-Glu signal is integrated with local and systemic stress and growth factor signals to promote ISC proliferation in a CaN/CRTC dependent manner. CaN/CRTC signaling is required and sufficient downstream of InR and JAK/STAT signaling to induce ISC proliferation. We propose that CRTC acts in parallel to other transcription factors regulated by InR and JAK/STAT signaling. b, Ca2+ signaling components in Drosophila (Extended Data Table 1).
Extended Data Figure 2
Extended Data Figure 2. Dietary L-Glu stimulates mGluR-dependent gut growth
a, Left: Mitotic figures in intestines re-fed with a range of L-Glu (wt/vol %) in food with varying yeast concentrations for 4 hours. Flies were starved upon eclosing for 48 hours, and then re-fed with food containing varying concentrations of yeast as only amino acid source, but supplemented with varying concentrations of L-Glu (between 0.1 and 10% L-Glu in food containing between 0.1% and 5% yeast; Note that the L-Glu concentration in standard fly food is about 0.1–0.3% ,). Middle: 10% L-Glu refeeding inhibits ISC proliferation. Mitotic figures were quantified 24hrs after flies were refed with yeast enriched (5%) or yeast restricted food (0.1%) supplemented with 10% glutamate. Blue food dye was included in the food to monitor food intake. Right: Distribution of mitotic ISCs along the GI tract after L-Glu refeeding. Number of proliferating ISCs (pH3+) in anterior and posterior midguts (AM and PM) is quantified. b, Food intake is not affected by changing the L-Glu concentration in the food. CAFÉ assay and ingestion of colored food are shown after 4hrs of re-feeding. c, Injection of L-Glu fails to promote ISC proliferation. Food naïve flies were starved for 2 days before injection with the indicated solutions. Injected or non-injected flies were examined after recovery for the indicated time points. A typical example of injected fly was shown on the top. Blue food dye was mixed into the injected solutions to monitor its distribution throughout the body d, Representative images of guts after refeeding. The red lines indicate the length and width measurements used to quantify relative gut size. e, Left: ISC proliferation in animals re-fed sucrose solution supplemented with indicated amino acids (1% w/v final). The number of pH3+ ISCs was determined 6hrs after refeeding. Right: ISC proliferation in animals re-fed isocaloric sucrose-only solution (5.2% sucrose, the calorie content of 0.2% sucrose is equivalent to 1% glutamate) or re-fed excess sucrose (10%). f, Feeding L-Glu for 7 days promotes growth of EsgtsF/O clones. Note large clones in L-Glu fed intestines (box). Genotype of EsgtsF/O: esgGal4, UAS::FLP, tub::Gal80ts; UAS::nlsGFP; tub::>FRT-CD2-FRT>Gal4. g, Increased cell density, lineage growth and intestinal diameter in L-Glu treated guts. Cell density in the posterior midgut (PM) was determined in esgts F/O flies exposed to mock or L-Glu supplemented food for 7 days (esgts F/O allows lineage tracing from ISCs. Genotype is esg::Gal4, UAS::Flp, UAS::GFP, Act>FRT-stop-FRT>Gal4; tub::Gal80ts). Cross sections through the posterior midgut and overview images are shown highlighting the increase in intestinal diameter and in clonal growth upon L-Glu supplementation. Clones were analyzed 7 days after clone induction at 29°C. h, L-Glu supplementation promotes growth of ISC lineages. ISC lineages were marked by MARCM (genotype: hsFlp, UAS::GFP;;tub::Gal4,FRT82B,tub::Gal80/FRT82B). Cell numbers in GFP+ ISC clones were counted 7 days after heat shock induction and re-feeding. i, Related to Fig.1b. Mitotic figures and gut width measured after L-Glu refeeding. mGluR112b is a null allele of mGluR. For pH3 number, n=12 per condition, for gut width measurement, n=8 per condition. Averages and s.e.m. are shown. P values from Student’s t-test for a (middle), b, c, g, h and i, from one-way ANOVA for a (left and right) and e. The sample size is as follows: n=8 per condition for a (left), n=7 per condition for a (middle), n=11 per condition for a (right), n=12 per condition for b and c , n=9 per condition for d, n= 11 per condition for e (left), n=6 per condition for e (right), n=6 per condition for g, n=14 per condition for i (left) and n=9 for i (right)). For h, clones (n=32 for control and n= 42 for glutamate food) from 5 guts were analyzed. Data shown in a, e, and g are representative of 3 independently performed experiments, and those shown in b, c, h and i are representative from 2 separate experiments. n.s.: not significant.
Extended Data Figure 3
Extended Data Figure 3. ISC regulation by EAAT1
a, Eaat1 transcript is enriched in the anterior midgut. In situ hybridization with antisense RNA probes against eaat1 (detected using NBT/BCIP; sense probes shown in bottom panels). Guts over-expressing Eaat1 in ECs (Eaat1OE), or depleted of eaat1 in ECs (Eaat1RNAi) used as positive/negative controls. b, Expression pattern of Eaat1::Gal4 in midgut. Expression of eaat1::GAL4>UAS::GFP (green) in anterior midgut (AM) and posterior midgut (PM) is shown in higher magnification in the lower panels. Cell membranes highlighted by anti-armadillo staining (red). c, Knockdown efficiency of Eaat1 RNAi line determined by qRT-PCR. Eaat1RNAi (BL43287) was used to knock down Eaat1 in the gut using NP1::Gal4, tub::Gal80ts (29°C for 10 days). NP1Gal4ts (NP1::Gal4; tub::Gal80ts) drives expression in ECs throughout the gut when flies are shifted to 29°C. 10 guts were pooled for RNA extraction and three independent groups were repeated for evaluation. d, Knocking down eaat1 in ECs promotes ISC proliferation. Distribution of mitotic ISCs and percentage of Delta positive cells in intestines of flies in which eaat1 was knocked down in ECs shown in the middle panels. Representative image from confocal microscopy is shown on the right. Arrowheads point to select ISCs identified by anti-Dl staining (Dl, white). e, Overexpressing eaat1 in EC suppresses L-Glu-mediated ISC proliferation. Eaat1 was over-expressed in ECs using NP1Gal4ts (NP1::Gal4; tub::Gal80ts) at 29°C. Flies were shifted to 29°C before hatching, then maintained on normal food (01.-0.3% L-Glu) for 4 days. Flies were then starved (with water) for another 2days. Mitotic index was determined in intestines of flies refed with 1% glutamate for 6hrs as shown in a. f, Upd3 transcript in whole guts quantified by qRT-PCR (transcript levels normalized to actin5C). g, Knocking down eaat1 in ECs by NP1::Gal4ts does not increase JAK/STAT signaling activity in the posterior midgut. 2xSTAT::GFP is an activity reporter for JAK/STAT signaling (green). Apoptosis in ECs is indicated by TUNEL staining (bottom panel, apoptotic nuclei in red). As a positive control, Bleomycin (25ug/ml) treatment strongly induces 2xSTAT::GFP expression in visceral muscle and epithelium, results in widespread TUNEL positive nuclei in the intestinal epithelium, and substantially increases Upd3 transcripts in the posterior midgut. Averages and s.e.m. are shown, P values are from ANOVA for d (middle) and f; from Student’s t-test for c, d (left and right) and e. The sample size is n=3 independent samples for each condition in c, n=12 guts for each condition (mitotic figures), and n=14 guts for Control and n=24 guts for Eaat1RNAi (percentage of Delta positive cells) in d. n=15 for Control and n=21 guts for Eaat1OE in e. n=3 independent samples for each condition in f. For d and e, a representative experiment is shown (three biological replicates). For a, b, g, representative images from a representative of two independent experiments are shown (a: n=8 for each condition; b: n=12; g (left): n=12 per condition, and g (right): n=9 per condition).
Extended Data Figure 4
Extended Data Figure 4. Neuronal projections and GCaMP3 fluorescence pattern in the intestinal epithelium
a, Schematic showing neuronal projections in adult Drosophila gastrointestinal tract (modified from Olds et al, 2014). Only three segments are innervated by neurons from the brain: Crop, Proventriculus (PV) and Foregut, Hindgut (HG) Pylorus, and the Rectum (R). b, No glutamatergic neurites are observed in the posterior midgut (,). All neurites are stained by anti-HRP staining in white. mCD8GFP driven by VGlutGal4CNS (a glutamatergic neuron driver readily expressed in adults) labels all glutamatergic neurons. Glutamatergic neurons are also detected by VGlut (vesicular glutamate transporter) immunostaining. Higher magnification is shown on the right. c, Summary of neurites innervating the Drosophila GI tract (see also Cognini et al, 2011). While L-Glu in the diet may stimulate glutamatergic neurons innervating the intestine, and a role for these neurons in stimulating ISC activity under certain circumstances cannot be ruled out, the widespread induction of ISC proliferation throughout the gut, as well as the ISC-specific requirement for mGluR suggests that the locally restricted glutamatergic innervation is not directly involved in stimulating ISC proliferation. d, VGlutGAL4CNS>mCD8GFP and anti-VGlut stain the presynaptic neurons of 3rd instar larval NMJs. HRP (white) stains all neurites. e, Detection of Ca2+ levels in the Drosophila posterior midgut (fixed tissue). Ubiquitous expression of UAS::GCaMP3 (green) in the posterior midgut using actin5C::GAL4 reveals high Ca2+ levels in subsets of small, basally located cells (likely to be ISCs and EBs; asterisks), and at the brushed border of ECs (arrows). Superficial view in top panels, sagittal view in bottom panels. (Right) Actin5C::Gal4 drives expression of mCD8GFP homogeneously in the posterior midgut. Armadillo (red) marks cell boundaries. In ECs, Ca2+ is enriched in the microvilli (marked with arrows), potentially to facilitate Ca2+ dependent absorption and innate immune processes . f, Ca2+ concentration is higher in ISCs than in EBs. ISCs and EBs are labeled by expression of mCherry (red) under the control of esgGAL4. Ca2+ in these cells is detected using GCaMP3 (green). Su(H)Gbe::lacZ marks EBs (white in top panels) and Delta marks ISCs (white in lower panels). g, Quantification of relative Ca2+ levels in ISCs versus EBs measured as fluorescence ratio between GCaMP3 and mCherry. Note the high variability of [Ca2+] in ISCs. Averages and s.e.m. are indicated. P values from Student’s t-test. n=56 cell pairs from 5 different guts. Four independent experiments were performed. One representative image from 5 flies in a single experiment (two independent duplicates) is shown in b, e and f. One representative image from 6 larvae in a single experiment (two independent duplicates) is shown in d.
Extended Data Figure 5
Extended Data Figure 5. Ca2+ oscillations in ISCs
a, Typical ex vivo recording of Ca2+ oscillations in ISCs from young flies. GCaMP::GFP (green) and mCherry (red) are expressed specifically in ISCs. 56 frames with 15 second intervals are shown (see materials and methods for details). Frames were exported from ZEN software. Genotype: UAS::GCaMP3; esg::GAL4, UAS::mCherry; Su(H)Gbe::Gal80, tub::GAL80ts. b, Traces of Ca2+ oscillations in ISCs of intestines incubated with EGTA(5mM) or 2-APB (10µM) for 5–10 minutes and then recorded immediately. c, Ca2+ oscillation frequency of ISCs incubated in AHL with or without EGTA, CdCl2 (5 µM) or LaCl3 (5mM). Values for individual ISCs (collected from 3–4 different guts) are plotted, d, Ca2+ oscillation in ISCs is inhibited by LaCl3. Scheme of oscillation parameters is shown on the left. The local amplitude of oscillation spikes and the baseline Ca2+ level between oscillations were derived from Gaussian fits on detected oscillation spikes. Average oscillation frequencies and average baselines are shown. e, Observed Ca2+ oscillation pattern in ISCs is independent of the genetic reporter system used. Oscillation frequency and average fluorescence ratio are compared between different genetic Calcium reporters: UASGCaMP3, UAS::tdTomato-2A–GCaMP5 and UAS-IVS-GCaMP6s. Genetic reporters are expressed specifically in ISCs using esgGal4ts; Su(H)Gbe::Gal80. f, Ca2+ oscillation pattern in ISCs of guts incubated with or without Isradipine (10µg/ml incubation in AHL medium). Isradipine inhibits L-type VGCCs to paralyze visceral muscles. Averages and s.e.m. are shown. P value from ANOVA for c and e. Other P values from Student’s t-test. Individual ISCs pooled from 3–4 guts were plotted in c, e and f. The sample size for c is n = 12, 8, 9, 14; for e, n = 12, 16, 13, 14, 20, 24; and for f, n = 22, 14, 25, 22 (from left to right for each panel). Two independent experiments were performed for b-d, and three independent experiments for e and f.
Extended Data Figure 6
Extended Data Figure 6. Glutamate feeding modulates Ca2+ oscillation pattern through mGluR/Gαq/PLCβ pathway
a, Automated quantification of oscillation parameters in recordings from wild-type and mGluRRNAi expressing intestines refed L-Glu containing or control food (compare Fig. 3A). Average oscillation frequencies and average baselines are shown. b, 10% L-Glu feeding inhibits Ca2+ oscillations. Ca2+ oscillations recorded in animals after 6–8h refeeding with 10% L-Glu and incubation of the intestine in AHL supplemented with 10% L-Glu. Prolonged incubation (20 min) in 10% L-Glu causes further decrease of average GCaMP3 fluorescence. c, Manual and automated quantification of oscillation parameters on recordings from individual guts of the indicated genotypes. Values for individual cells from 3–4 guts are plotted on the left. Values for individual cells from single guts are shown in the third and fourth panels. Typical traces of recordings for individual cells are shown in the middle and the corresponding oscillation parameters calculated automatically by Gaussian fits in Mathematica 8.0 are shown on the right. Average oscillation frequencies and average baselines are shown. d, Gαq, but not other Gα subunits (GαO, GαS or Gαi) is required for Ca2+ oscillations in ISCs. While knockdown of Gαq, G β 13F and Plc β impairs Ca2+ oscillations, oscillation frequency was not affected when GαO, GαS or Gαi were knocked down in ISCs for 8 days at 29°C (driver genotype is UAS::GCaMP3; esg::Gal4, UAS::mCherry, Su(H)Gbe::Gal80, tub::Gal80ts. Pertussis Toxin (UAS::PTX) was used to specifically inhibit Gαq. Typical traces are shown on the right. e, Average oscillation frequencies and average baselines from Gaussian fits are shown. f, Voltage Gated Calcium Channel (VGCC) components Cavβ or Cac are not required for Ca2+ oscillations in ISCs. Oscillations are also not affected in ISCs expressing molecules expected to affect plasma membrane potential (ΔOrk1 (hyperpolarizing) and UAS-NaChBac (hypo-polarizing)). Driver Genotype: UAS::GCaMP3; esg::GAL4, UAS::mCherry; Su(H)Gbe::Gal80, tub::GAL80ts. Averages and s.e.m. are shown. P values in d, f and the right charts of panel c are from ANOVA; P values for a, b and e and the left charts of c are from Student t-test. Individual ISCs pooled from 3–4 guts are plotted in b-d and f. The sample size for a and e is n=3; for b n =10, 8, 12, 17, 15, 20, 10, 11; for c, n = 16, 20, 17, 12; for d, n =15, 18, 13, 22, 22, 10, 8, 9; and for f, n = 13, 15, 15, 14, 16 (from left to right for all panels). For c, values for individual cells from single guts are shown in the third and fourth panels. Data are representative of two independent experiments for d-f, and for three independent experiments for a-c.
Extended Data Figure 7
Extended Data Figure 7. Prolonged increase of [Ca2+]cyto promotes ISC proliferation
a, Typical traces of Ca2+ recordings of indicated genotypes. Transgenes were induced at 29°C for 4 days and 3–4 guts of each genotype were recorded. Thapsigargin concentration was 2 µM in the medium while recording. Genotypes: UAS::GCaMP3; esg::GAL4, UAS::mCherry; Su(H)Gbe::Gal80, tub::GAL80ts combined with w1118 for control or with the indicated transgenes. b, Knockdown of SERCA in ISCs, but not EBs promotes ISC proliferation. SERCA was knocked down using esg::Gal4 (targeting ISCs+EBs), Su(H)Gbe::Gal4 (EBs), or esg::GAL4; Su(H)Gbe::GAL80 (ISCs) combined with tub::Gal80ts by incubating at 29°C for 4 days. ISCs and/or EBs are labeled by nlsGFP in green and mitotic ISCs are stained by pH3 (red). Number of dividing ISCs (pH3+) per gut were quantified and analyzed. c, Knocking down SERCA or Pmca promotes growth of ISC-derived clones. Typical MARCM clones expressing SercaRNAi, PmcaRNAi and StimRNAi 7 days after induction are shown. ISC clones are marked in green and pH3 staining was used to detect dividing ISCs. Note: SercaRNAi clones contain many more, but smaller cells, resulting in similar clonal area compared to wild-type. Quantification is shown on the right. d, (Left) Mitotic figures quantified in intestines of flies homozygous for SERCAkum170, a temperature sensitive SERCA loss of function allele. Flies were exposed to heat shock (42°C, 5 min for two consecutive days, this permanently inactivates SERCA, and proliferation was assessed 7days after heat shock. (Right) Size of MARCM clones of ISCs homozygous for Sercakum170 analyzed 7 days after clone induction. e, MARCM clones of ISCs homozygous for the Stim null allele, StimA ,analyzed 7 days after clone induction. Dashed lines delineate individual clones (GFP green, DAPI blue, Armadillo (red membrane), Prospero (red nuclei), Dl (white). Dl channel is shown separately in grayscale. Quantification of clone sizes (cells/clone) is shown on the right. f, Guts of the indicated genotypes visualized in basal views (6 panels) and in cross section (2 panels). In basal views, ISCs are identified by Dl immuno-staining (red) and GFP (green). In cross sections, visceral muscle is identified by Phalloidin staining (red), and ISCs/EBs by GFP (green). DAPI is blue in all panels. Averages and S.E.M. are shown, P value from ANOVA for c, the other P values from Student’s t-test. For mitotic figures in b, n=11 for each genotype. For mitotic figures in d (left), n=10 for each condition. For clonal analysis in c, clones (FRT40A, n=50; SercaRNAi, n=42; StimRNAi, n=40; PmcaRNAi, n=56) from 8–10 guts were quantified. For clonal analysis in d (right), clones (FRT42D, n=80; Sercakum170, n=60) from 10 guts were quantified. For clonal analysis in e (FRT19A, n=120; stimA, n=102) from 7 guts were assessed. For panel a, traces from individual ISCs from a representative gut of each indicated genotype are shown, 3–4 guts were recorded for each experiment and two independent experiments were performed. For panel b-f, one of the three independent experiments is presented.
Extended Data Figure 8
Extended Data Figure 8. Time course analysis of Notch activity in ISC lineage after manipulation of Ca2+ signaling
a, ISC lineage. After an asymmetric division, ISCs (expressing Delta) activate Notch in EBs (thus activating Su(H)Gbe::LacZ). EBs with high Notch activity differentiate into polyploid ECs (expressing Pdm1), EBs with low Notch activity differentiate into EEs (expressing Prospero). b, ISC proliferation rates (mitotic nuclei / gut) at different time points after perturbation of N or Ca2+ signaling. Number of days after shift to 29°C is listed. c-e, Representative images of guts perturbed as in b, immuno-stained for Su(H)Gbe::lacZ (bGal, red, reporter for Notch activity) and for Dl (white). GFP green, DAPI blue. For 7d timepoint, higher mag images (boxed area) of bGal channel are shown in lower row in grayscale. Note that knockdown of Notch results in rapid loss of Su(H)Gbe::lacZ+ cells and accumulation of Dl+ cells. SERCA knockdown results in loss of Su(H)Gbe::LacZ only after prolonged expression (14 days), even though proliferation is induced more strongly than with NRNAi already at 4 days. Su(H)Gbe::lacZ expression is not lost in PMCARNAi or CRTC over-expressing (OE) guts, although proliferation is induced as strongly as in NRNAi expressing guts at 4 days. Quantification of ratio of Delta positive cells and GbeLacZ positive cells in the gut after at the indicated timepoints after shift to 29°C is shown in panel e. f, Quantification of Prospero+ cells of posterior midguts (PM) in which cytosolic Ca2+ was increased by knocking down SERCA or PMCA, or by over-expressing Stim and Orai using esgts. Increased numbers of EEs (an indication of impaired N signaling) were only observed in animals in which SERCA was knocked down for a prolonged period of time (14 days 29°C). Anti-Prospero stains EE cell nuclei. g, Clonal analysis of ISC differentiation process after manipulation of Ca2+ signaling or N activity. ISC MARCM clones of Control, NotchRNAi, SercaRNAi, or PmcaRNAi were analyzed at 4 days or 7 days after heat shock induction. Clones (marked in GFP) are circled in dashed line. The nuclei of differentiated cells are stained by Pdm1 in red. Although PmcaRNAi clones are significantly larger, differentiation process is largely normal based on Pdm1 staining. While differentiation of SercaRNAi clones at 7d AHS is significantly perturbed based on the Pdm1 staining, comparing with surrounding WT EC cells. As expected, no Pdm1 positive cells were observed in NRNAi clones. h, Related to panel g, clone size and percentage of Pdm1 positive cells per clone was quantified 4days after heat shock (AHS) induction. i, NotchRNAi induced proliferation can be partially rescued by knocking down Ca2+ signaling components, such as STIM or CanB2. Mitotic index was shown on right. j, Inhibition of Serca stimulates ISC proliferation even when N signaling is induced by over expression of NICD. Averages and s.e.m. are shown. P values (*, P<0.05; **, P<0.01; ***, P<0.001; n.s, not significant) are from ANOVA (between control and first four perturbations) in panel b, e-f (between control and PmcaRNAi, and stimOE;OraiOE) and h-i, and from Student’s t- test (between SERCARNAi and SERCARNAi; STIMRNAi) in panel b, f (between control and PmcaRNAi), and j. For b, mitotic cells are calculated at indicated timepoints for each genotype: 4d, Control (n=16), PmcaRNAi (8), CRTCOE (9), NotchRNAi (12), SercaRNAi (14) , SercaRNAi;StimRNAi (9); 7d, Control (12), PmcaRNAi (10), CRTCOE (9), NotchRNAi (11), SercaRNAi (10) , SercaRNAi;StimRNAi (8); 14d , Control (6), PmcaRNAi (18), CRTCOE (9), NotchRNAi (12), SercaRNAi (8) , SercaRNAi;StimRNAi (11); For c-e, cells in posterior midgut from 4–7 guts of each genotype and time point were analyzed. For e, fraction of bGal+ or Dl+ cells in 100–200 total cells counted in a field of the posterior midgut for each condition was quantified. Average and s.e.m. for the following number of guts (left to right) n= 4, 4, 5, 4, 4, 4, 4, 7, 4, 6, 4, 4, 4, 5, 4, 4, 4, 5, 4, 4, 5, 4, 6, 5, 4, 4, 5, 4, 5, 5, 6, 4, 5, 7, 5, 6, 4, 5. For f, Prospero positive cells of indicated genotype at 4 days (n=5 guts) and 14 days (n=7 guts) were analyzed. For clonal analysis in g-h, clones (FRT40A, n=50; SERCARNAi , n=45; NRNAi, n=30; and PMCARNAi, n=43) were analyzed. For mitotic analysis in panel i and j, n=12 for each genotype. Data shown in b-f and i are representative of two independent experiments and those shown in g-h and j represent one of the triplicate experiments.
Extended Data Figure 9
Extended Data Figure 9. Cytosolic Ca2+ regulates ISC proliferation through CaN/CRTC pathway
a, Acute knock-down of Serca in ISCs does not induce ER stress. Phospho-eIF2alpha (red, a PERK-mediated phosphorylation and marker of ER stress; see also ), is only weakly detected in control ISCs. No significant increase of phospho-eIF2alpha staining is observed in ISCs expressing SERCARNAi, while Tunicamycin treatment (a bona fide inducer of ER stress; 50µM, 24hrs) increases phospho-eIF2a strongly in ISCs (asterisk). Quantification of average fluorescent intensity of p-eIF2alpha was shown on right. b, Elevating ER folding capacity by over-expressing spliced Xbp1 (Xbp1s) does not limit ISC proliferation in SERCA loss of function conditions. Representative images shown on the left. Mitotic ISCs stained by anti-pH3 staining (red). Mitotic index quantified on the right‥ c, Elevated cytosolic [Ca2+] induces proliferation without perturbing EGFR pathway activity. Indicated Ca2+ signaling components were knocked down or over-expressed using esgts;UAS::nlsGFP. dpERK staining as a readout of EGFR pathway activity was quantified after 4 day induction at 29°C. InR was overexpressed using esgts;UAS::mCD8GFP as a positive control. d, Proliferation of Serca deficient ISCs is suppressed when CaN subunits are silenced simultaneously, but not when CaMKI and CaMKII are knocked down. e, Proliferation of ISCs in which cytosolic [Ca2+] is increased by over-expression of STIM and Orai, or by knock down of PMCA, is rescued when CaNB2 is silenced simultaneously‥ f, Overexpression of constitutive active forms of CaN catalytic subunits (CanA14F, Pp2B14D, CanA1) promotes ISC proliferation. Mitotic figures were quantified after 4 days of transgene expression at 29°C‥ g, CaN is required for growth of ISC lineages. Quantification of clone sizes of MARCM clones homozygous for the null allele CanB2KO, or expressing dsRNA against CanB2 (canB2RNAi), or constitutively active CanA14Fact. h, Loss of CRTC (homozygosity for null allele crtc25-3) rescues increased ISC proliferation when Pmca is knocked down or when Pp2B-14Dact is over-expressed using esg::Gal4, tub::Gal80ts (esgts). i, Over-expression of CRTC promotes ISC proliferation. Mitotic index of intestines over-expressing HA-tagged forms of wild type (UAS::CRTC-HA) or constitutively nuclear forms of CRTC (UAS::CRTC-SA-HA) using esg::GAL4ts was analyzed after 4 days of incubation at 29°C. j, Increasing cytosolic Ca2+ promotes ISC proliferation via Ca2+/Calcineurin/CRTC pathway. Guts of indicated genotypes were dissected and stained with anti-pH3 (indicating mitotic ISCs), anti-Armadillo (arm, labeling cell boundaries) and anti-Prospero (Pro, labeling entero-endocrine cells). k, CRTC overexpression is sufficient to promote ISC proliferation when Gaq or IP3R are silenced. l, CREB and its partner CBP are required for ISC survival, while over-expressing CREB promotes proliferation. Representative images of intestines in which CREB and CBP were genetically perturbed in ISC/EBs using esg::GAL4. Increased numbers of GFP+ ISCs/EBs are observed when CREB is over-expressed, while a significant loss of GFP+ cells is observed when CREB or CBP are knocked down. Guts are stained for Armadillo (membrane, white) and Prospero (nuclear, white) to identify EEs and ECs; DAPI is blue. Genotype: esg::GAL4; UAS::nlsGFP; tub::Gal80ts / UAS::X m, Knockdown efficiency of RNAi lines determined by qRT-PCR. PmcaRNAi (BL31572) and CanB2RNAi(BL27270) were used to knock down respective genes in the gut using NP1::Gal4, tub::Gal80ts (29°C for 10 days). mGluRRNAi (BL41668) was used to knock down mGluR in the brain using elav::GAL4. Expression levels were normalized using actin5C and to un-induced controls (NP1::Gal4/+; tubGal80ts/+ or elav::Gal4/+). Effectiveness of other constructs used has been reported in the literature: UAS::GaqRNAi and UAS::PLCβRNAi were obtained from and verified by Ha et. al. , UAS::CamKIRNAi (BL26726), UAS::CamKIIRNAi (BL 29401), UAS::IP3RRNAi (BL25937), and UAS::RyRRNAi (BL28919) were verified by Shim et al. , and UAS::SercaRNAi (BL 44581) by Roti et al. . Average and s.e.m. are shown throughout. P values from Student’s t-test in b, and g-h, and from ANOVA for a, c, d-f, i and k. For a and c, fluorescence intensities for peIF2alpha (a) or dpERK (c) in 30–50 ISCs/EBs doublets in single fields of several independent posterior midguts were averaged for each condition. Averages and s.e.m. shown represent the following sample sizes: a, Control, n=5 guts, SercaRNAi, n=5, Tunicamycin, n=6; c, Control, n=6, SercaRNAi, n=4, CRTCOE, n=9, and PmcaRNAi, n=8. For mitotic analysis in b, d-f, h-i and k: b, n=13 guts for control, n=10 for the rest; d, n=17 for each genotype; e, n=18 for control, n=12 for the rest; f and k, n=11 each genotype; and i, n=12 for each condition. For clonal analysis in g, clones (FRT42D, n=56 clones; CanB2KO, n=60; FRT40A, n=50; CanB2RNAi, n=70; FRT82B, n=62; CanA14FACT, n=58) from 10 guts each were assessed. One representative image from 10 flies in a single experiment (two independent experiments) is shown in j and l. Data shown in a-i, and k are representative of three independent experiments. Data in m is average and s.e.m. from n=3 technical replicates of samples pooled from 10 guts each for Pmca and CanB2, 4 heads each for mGluR. Representative of two independent experiments.
Extended Data Figure 10
Extended Data Figure 10. Ca2+ oscillation pattern as an indicator of ISC proliferation status
a, Typical traces of live recordings of indicated genotypes. Genotype for GCaMP3 control: w1118 X UAS::GCaMP3; esg::GAL4, UAS::mCherry; Su(H)Gbe::Gal80, tub::GAL80ts. Genotype for bicistronic control: w1118 X; esg::GAL4, UAS::tdTomato-2A–GCaMP5;Su(H)Gbe::Gal80, tub::GAL80ts b, Ca2+ oscillation patterns of ISCs in which proliferation was stimulated or inhibited by genetic or environmental perturbations: knockdown of Notch, over-expression of InR, Unpaired2 or RasV12, infection with Ecc15, or aging results in high proliferative activity. Over-expression of InRDN and CncC inhibits proliferation of ISCs. c, Acute Ecc15 infection transiently increases cytosolic [Ca2+] while decreasing oscillations in ISCs. d, Acute Ecc15 infection increases cytosolic Ca2+ while decreasing oscillations in ISCs as determined using the bi-cistronic Calcium reporter UAS::tdTomato-P2A–GCaMP5G. e, ISCs in which proliferation is impaired exhibit more frequent oscillations than controls. Oscillation frequency of ISCs from indicated genotypes is plotted individually (3 guts for each genotype and each dots represents one ISC). f, Expressing InRDN in ISCs is sufficient to inhibit stress- or diet- induced proliferation. Quantification of mitotic figures of indicated genotype is shown. For Bleomycin treatment, flies were dry starved for 4hrs before feeding on 25ug/ml (final) Bleomycin for 24hrs. For refeeding, Flies were maintained on normal food for 4 days at 29°C, then starved for 2 days, and re-fed with yeast supplemented food. Genotype: esg::Gal4, UAS::GFP; Su(H)Gbe::Gal80, tub::Gal80ts / UAS::InRDN. g, ISC proliferation induced by oral infection with Ecc15 or by Bleomycin treatment is suppressed by silencing IP3R or Orai. Mitotic figures were analyzed 6 hrs after oral infection with Ecc15 or 24 hrs after feeding with Bleomycin . h, Elevated cytosolic [Ca2+] in ISCs activated by oral infection with Ecc15 or by Bleomycin treatment. This elevation is suppressed by silencing IP3R or Orai. i, ISC proliferation induced by Bleomycin treatment or Ecc15 infection is suppressed by silencing CRTC or IP3R or CanB2, or in Crtc25-3 homozygous mutants. mGluR, in turn, is not required for Bleomycin-induced proliferation. Mitotic figures were analyzed 24 hrs after feeding with Bleomycin or 6 hrs after oral infection with Ecc15. j, Quantification of mitotic figures in animals of the indicated genotypes. ISC proliferation induced by over-expression of InR or Hep can be suppressed by knockdown of IP3R, Crtc, Stim, or CanB2 (see also Fig. 4a). k, mGluR is not required for Ecc15 - induced proliferation and changes in cytosolic Ca2+. Mitotic figures and Ca2+ oscillation patterns analyzed 6hrs after oral infection. l, Increasing cytosolic [Ca2+] promotes ISCs proliferation in JAK/STAT loss of function conditions. JAK/STAT pathway (Dome and Hop) is required for ISC proliferation induced by Ecc15 infection. Increasing cytosolic [Ca2+] by knocking down Pmca (left) or Serca (right) is sufficient to rescue ISC proliferation. m, Knocking down Fos can substantially suppress CRTC over-expression induced ISC proliferation. n, Left, segregation of active and resting ISCs into Ca2+ oscillation modes as calculated by automatic peak detection and Gaussian fits. As shown for ‘manual’ calculations in Figure 4, Ca2+ oscillation patterns segregate into two modes associated with the proliferative status of the ISCs. ISCs in which the core components of Ca2+ homeostatic machinery are perturbed exhibit both low oscillation frequency and low average signal intensity (lower left corner). Transition from quiescence to active proliferation upon L-Glu feeding is indicated by the blue arrow. Right: ISC activity does not segregate when local oscillation amplitudes are plotted against oscillation frequency, suggesting that the primary driver of ISC proliferation is not the amplitude of individual Ca2+ spikes, but the increase in basal or average cytosolic Ca2+ concentration within ISC. Average and s.e.m. are shown. P values from ANOVA in b, h, i j (left), and l (right); P values from Student’s t-test in c-d, f-g, k, m, j (right) and l (left). For Ca2+ recordings in b-e, h and k, individual ISCs pooled from 3–4 guts were plotted. The sample size for b is n = 10, 14, 14, 12, 16, 18, 9, 12, 11, 20, 22, 38, 29, 12, 19, 8, 12; for c, n = 7, 8, 9, 7, 13, 18, 10, 7; for d, n =14, 16, 15, 18; for e, n = 5, 4, 5, 9, 4, 6, 8, 6, 5; for h, n =12, 11, 12, 11, 12, 14, 12, 11, 17, 12, 14, 11, 19, 9, 10, 8; for k, n=11, 12, 11, 11, 13, 10, 11, 11 (from left to right for all panels). For mitotic analysis in f-g, n = 12, 10, 10, 10, 12, 11, 10, 12, 12, 14, 10, 9, 9, 10, 9, 9, 10, 13; and in i-m, n = 13, 12, 11, 18, 11, 18, 12, 13, 13, 12, 10, 10, 13, 9, 12, 12, 16, 12, 9, 10, 10, 8, 9, 9, 10, 9, 12, 13, 13, 14, 14, 15, 12, 10, 19, 10, 12, 10, 9, 8, 8, 9, 10 (from left to right for all panels). Data in a-h, j and m are representative of three independently performed experiments, and those shown in i, k and l are a composite from two separate experiments.
Figure 1
Figure 1. Glutamate regulates ISC proliferation and gut growth through mGluR
a, Schematic of starvation / refeeding experiments performed. b, Mitotic figures (phospho-histone H3 expressing nuclei), gut length, gut width, and number of Delta (Dl) expressing and non-expressing cells / field in the posterior midgut (PM). Averages and s.e.m. are shown. P values are from Student’s t –test. For mitotic figures, n=14 flies for each genotype, representative of three independent experiments shown. For gut length, width, and cell numbers, n=9 for each control condition, n=12 flies for each mGluRNAi condition, representative of two independent experiments.
Figure 2
Figure 2. Dietary L-Glu influences ISC [Ca2+] oscillations and proliferation through the mGluR/Gαq/Plcβ pathway
a, Experimental setup for live recordings of Ca2+ oscillations in ISCs. b, Representative traces of GCaMP3/mCherry ratios in individual wild-type ISCs (pooled from 4 guts; 50 frames, 15 second intervals). c, Representative frames from live recording (frame and time in minutes indicated). Arrowheads mark typical ISCs. d, [Ca2+] oscillation frequency and average GCaMP3/mCherry ratio in ISCs of flies of the indicated genotypes re-fed for 4hrs. e, L-Glu – induced proliferation analyzed after Gαq and Plcβ were knocked down in ISCs for 7 days. Averages and s.e.m.; P values from Student’s t-test (N.S.: not significant). In d, individual ISCs pooled from 4–5 guts (n = 12, 14, 18, 30, 12, 13, 17, 15, 9, 10, 13, 11 cells from left to right). In e, n = 13, 16, 10, 11, 11, 12 guts from left to right. Representative of 6 experiments in b and c, of three experiments in d and e. f, Regulation of Ca2+ homeostasis in non-excitable cells. GPCR/IP3R cascade causes release of Ca2+ (red dots) from the ER. A decline of [Ca2+] in the ER is sensed by the Stim-Orai complex and induces extracellular Ca2+ influx into the cytoplasm (Store-operated Ca2+ entry, SOCE). Excessive cytoplasmic Ca2+ is pumped into the ER by SERCA or out of the cell by PMCA.
Figure 3
Figure 3. CaN/CRTC regulates ISC proliferation in response to elevated cytosolic Ca2+
a, Ca2+ oscillation patterns in ISCs perturbed as indicated. b, Mitotic figures in guts of 2–3 day old flies maintained at 29°C for 4 days. c, Cross section of posterior midguts of the indicated genotypes. Visceral muscle identified by Phalloidin (red), and ISCs/EBs by GFP (green). DAPI blue. d, Mitotic figures in control or crtc null mutants (crtc25-3) combined with SERCA knockdown. e, Mitotic figures in control or crtc25-3 homozygotes after re-feeding. f, Mitotic figures in indicated genotypes after re-feeding. Averages and s.e.m. in all cases. a, individual ISCs (pooled from 4–5 different guts). P values from ANOVA. n = 13, 12, 13, 10, 16, 12, 14, 8, 17, 11, 21, 12, 11, 10, 16, 12, 8, 6, 20, 12 cells from left to right. Representative of three experiments. b, one-way ANOVA (left and middle) and Student’s t-test (right). n = 22, 24, 15, 13, 16, 15, 22, 18, 12, 16 guts. Representative of two experiments. d, one-way ANOVA. n = 12, 22, 11, 19 guts. Representative of two experiments. e, Student’s t-test. n = 12, 8, 10, 8 guts. Representative of three experiments. f, ANOVA. n = 10, 12, 11, 11, 10, 12 guts. Representative of two experiments. N.S.: not significant; ***: P<0.001; ****: P<0.0001.
Figure 4
Figure 4. Ca2+ signaling integrates stress and mitogenic signals to stimulate ISC proliferation
a, Mitotic figures in indicated genotypes. b, Frequency of [Ca2+] oscillations and average fluorescence ratio in individual ISCs of indicated genotypes. c, Quantification of mitotic figures in the midgut, and of [Ca2+] in ISCs of the indicated genotypes. d, Quantification of mitotic figures in the midgut of the indicated genotypes. e, ISC [Ca2+] oscillation patterns segregate into three different modes (shaded areas) that correlate with proliferative activity. ISCs with perturbed Ca2+ signaling machinery are proliferation deficient. Blue arrows indicate ISC activation upon L-Glu feeding or Ecc15 infection. Orange arrow indicates return to quiescence 24 hrs after Ecc15 infection. Averages and s.e.m. in all cases. a, Student’s t-test. n = 12, 12, 11, 14, 20, 14, 14, 15 guts from left to right. Representative of two experiments. b, ANOVA. n = 18, 27, 15, 15, 10, 11, 25, 20, 15, 22, 22, 17 cells. Representative of three experiments. c, Student’s t-test. For mitotic figures, n = 12, 18, 10, 9 guts. Representative of two experiments. For Ca2+ recordings, individual ISCs pooled from 4–5 guts. n = 11, 12, 15, 19, 8, 14, 10, 16 cells. Representative of three experiments. d, Student’s t-test. n = 9, 12, 11, 11, 12, 12, 13, 12 guts from left to right. Representative of two experiments. e, Averages and s.e.m. of oscillation frequency and average fluorescence ratio are plotted for each condition.

Comment in

References

    1. O’Brien LE, Soliman SS, Li X, Bilder D. Altered modes of stem cell division drive adaptive intestinal growth. Cell. 2011;147:603–614. - PMC - PubMed
    1. Buchon N, Broderick NA, Lemaitre B. Gut homeostasis in a microbial world: insights from Drosophila melanogaster. Nat Rev Microbiol. 2013;11:615–626. - PubMed
    1. Biteau B, Hochmuth CE, Jasper H. Maintaining tissue homeostasis: dynamic control of somatic stem cell activity. Cell Stem Cell. 2011;9:402–411. - PMC - PubMed
    1. Lemaitre B, Miguel-Aliaga I. The Digestive Tract of Drosophila melanogaster. Annu Rev Genet. 2013;47:377–404. - PubMed
    1. Ayyaz A, Jasper H. Intestinal inflammation and stem cell homeostasis in aging Drosophila melanogaster. Front Cell Infect Microbiol. 2013;3:98. - PMC - PubMed

References (Methods)

    1. Grandison RC, Piper MD, Partridge L. Amino-acid imbalance explains extension of lifespan by dietary restriction in Drosophila. Nature. 2009;462:1061–1064. - PMC - PubMed
    1. Lee WC, Micchelli CA. Development and characterization of a chemically defined food for Drosophila. PLoS One. 2013;8:e67308. - PMC - PubMed
    1. Ja WW, et al. Prandiology of Drosophila and the CAFE assay. Proc Natl Acad Sci U S A. 2007;104:8253–8256. - PMC - PubMed
    1. Olds WH, Xu T. Regulation of food intake by mechanosensory ion channels in enteric neurons. Elife. 2014;3 - PMC - PubMed
    1. Cognigni P, Bailey AP, Miguel-Aliaga I. Enteric neurons and systemic signals couple nutritional and reproductive status with intestinal homeostasis. Cell Metab. 2011;13:92–104. - PMC - PubMed

Publication types