. 2015 Dec 2:8:207.
doi: 10.1186/s13068-015-0391-z. eCollection 2015.

Transcriptional program for nitrogen starvation-induced lipid accumulation in Chlamydomonas reinhardtii

Affiliations

Transcriptional program for nitrogen starvation-induced lipid accumulation in Chlamydomonas reinhardtii

Adrián López García de Lomana et al. Biotechnol Biofuels. .

Abstract

Background: Algae accumulate lipids to endure different kinds of environmental stresses including macronutrient starvation. Although this response has been extensively studied, an in depth understanding of the transcriptional regulatory network (TRN) that controls the transition into lipid accumulation remains elusive. In this study, we used a systems biology approach to elucidate the transcriptional program that coordinates the nitrogen starvation-induced metabolic readjustments that drive lipid accumulation in Chlamydomonas reinhardtii.

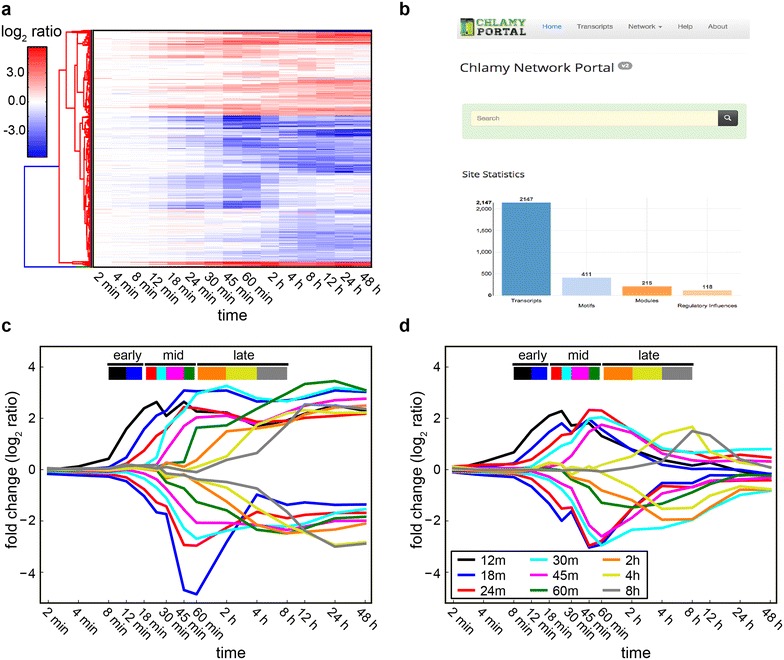
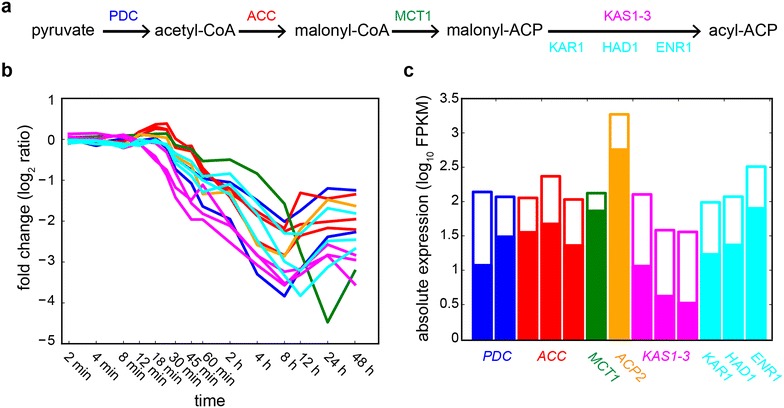
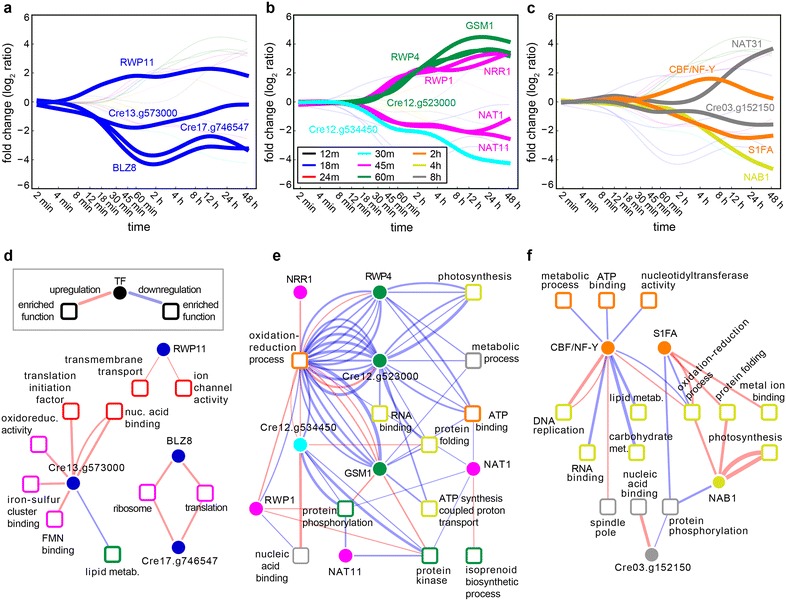
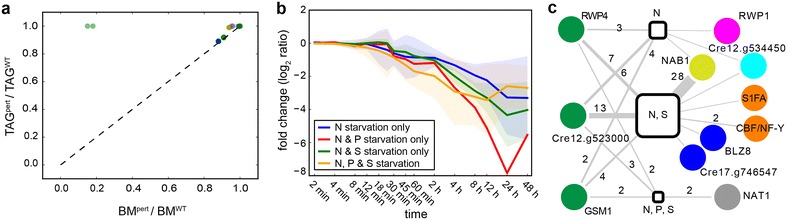
Results: We demonstrate that nitrogen starvation triggered differential regulation of 2147 transcripts, which were co-regulated in 215 distinct modules and temporally ordered as 31 transcriptional waves. An early-stage response was triggered within 12 min that initiated growth arrest through activation of key signaling pathways, while simultaneously preparing the intracellular environment for later stages by modulating transport processes and ubiquitin-mediated protein degradation. Subsequently, central metabolism and carbon fixation were remodeled to trigger the accumulation of triacylglycerols. Further analysis revealed that these waves of genome-wide transcriptional events were coordinated by a regulatory program orchestrated by at least 17 transcriptional regulators, many of which had not been previously implicated in this process. We demonstrate that the TRN coordinates transcriptional downregulation of 57 metabolic enzymes across a period of nearly 4 h to drive an increase in lipid content per unit biomass. Notably, this TRN appears to also drive lipid accumulation during sulfur starvation, while phosphorus starvation induces a different regulatory program. The TRN model described here is available as a community-wide web-resource at http://networks.systemsbiology.net/chlamy-portal.

Conclusions: In this work, we have uncovered a comprehensive mechanistic model of the TRN controlling the transition from N starvation to lipid accumulation. The program coordinates sequentially ordered transcriptional waves that simultaneously arrest growth and lead to lipid accumulation. This study has generated predictive tools that will aid in devising strategies for the rational manipulation of regulatory and metabolic networks for better biofuel and biomass production.

Keywords: Chlamydomonas reinhardtii; Lipid accumulation; Metabolic network; Network modeling; Phenotypic transition; Transcriptional regulatory network.


Figures

Fig. 1
Fig. 1
Transcriptional response of C. reinhardtii to N starvation and lipid accumulation. a Heatmap representation for the hierarchical clustering of the log2 expression changes in 2,147 post-filtered set of transcripts. Red (blue) indicates a relative increase (decrease) of expression. Color intensities are proportional to fold change magnitude. b Default view of the front page of the Chlamy Network Portal. In the portal, 2,147 transcripts are organized into 215 modules, 118 regulatory influences and 411 motifs. The site includes a powerful Apache Solr-based faceted search and navigation tools. The portal content is also linked to other information resources like Phytozome, STRING, GO categories and relevant literature. c, d Differentially expressed transcripts organized as a sequential set of transcriptional waves: 17 monotonic transcriptional waves composed of 125 transcriptional modules and 1,482 transcripts (c), and 15 transient transcriptional waves of 55 transcriptional modules and 758 transcripts (d). Each line represents average fold change for a given transcriptional wave. The timestamp on each wave reflects the timepoint at which transcript level change crosses a twofold threshold
Fig. 2
Fig. 2
FA biosynthesis pathway is transcriptionally downregulated during N starvation. a Schematic view of the reaction steps for FA biosynthesis and the enzymes that catalyze them. b Expression profile for transcripts encoding enzymes highlighted in (a). c Absolute expression values for FA biosynthesis transcripts in log10 FPKM (open bars represent absolute expression level at time t = 0 while solid bars represent levels at t = 8 h). PDC pyruvate dehydrogenase complex, ACC acetyl-CoA carboxylase, MCT1 malonyl-CoA:ACP transacylase, ACP2 acyl carrier protein, KAS β-ketoacyl-(ACP) synthase, KAR1 3-ketoacyl-ACP reductase, HAD1 β-hydroxyacyl-ACP dehydratase, ENR1 enoyl-ACP-reductase
Fig. 3
Fig. 3
Expression dynamics and network of predicted transcriptional influences. ac Top panels show TR expression dynamics: each profile is labeled with the relevant TR it represents. df Network of predicted transcriptional influences from TRs (circle nodes) on enriched GO terms (square nodes) through transcriptional modules (edges). Edge color indicates transcriptional activation (red) or repression (blue) influenced of a TR on the transcriptional module. Edge thickness is inversely proportional to the distance between the TR and the transcriptional module. Nodes are colored using the same pattern as in Fig. 1c, d, e.g., blue represents a differential expression acquired at time 18 min after N starvation
Fig. 4
Fig. 4
Metabolic targets for higher relative TAG to biomass ratio. a Model-predicted consequences of transcriptional downregulation on relative TAG per unit biomass. Dots represent prediction for 57 metabolic enzymes whose downregulation resolves in increased TAG per unit biomass (above the diagonal, ρ > 1). Among these 57 metabolic targets, only 10 genes (blue dots) are uniquely downregulated in N starvation, and 40 genes are also downregulated during S starvation (green dots). Five genes are downregulated in N, S and P (orange dots) and just one, Cre02.g082750, is downregulated in N and P only (red dot). b Average expression profiles during N starvation for the metabolic targets grouped as in a. c Network of transcriptional regulatory influences on metabolic targets. Each circle node represents a TR (colored as in Fig. 3). Edges represent the predicted regulatory influence of a given TR on specific genes across the different starvation responses (squared nodes). Edge labels indicate the number of genes regulated by each TR, one if no label is present

References

    1. Wijffels RH, Barbosa MJ. An outlook on microalgal biofuels. Science. 2010;329:796–799. doi: 10.1126/science.1189003. - DOI - PubMed
    1. Gimpel JA, Specht EA, Georgianna DR, Mayfield SP. Advances in microalgae engineering and synthetic biology applications for biofuel production. Curr Opin Chem Biol. 2013;17:489–495. doi: 10.1016/j.cbpa.2013.03.038. - DOI - PubMed
    1. Weers PMM, Gulati RD. Growth and reproduction of Daphnia galeata in response to changes in fatty acids, phosphorus, and nitrogen in Chlamydomonas reinhardtii. Limnol Oceanogr. 1997;42:1584–1589. doi: 10.4319/lo.1997.42.7.1584. - DOI
    1. Matthew T, Zhou W, Rupprecht J, Lim L, Thomas-Hall SR, Doebbe A, et al. The metabolome of Chlamydomonas reinhardtii following induction of anaerobic H2 production by sulfur depletion. J Biol Chem. 2009;284:23415–23425. doi: 10.1074/jbc.M109.003541. - DOI - PMC - PubMed
    1. Wang ZT, Ullrich N, Joo S, Waffenschmidt S, Goodenough U. Algal lipid bodies: stress induction, purification, and biochemical characterization in wild-type and starchless Chlamydomonas reinhardtii. Eukaryot Cell. 2009;8:1856–1868. doi: 10.1128/EC.00272-09. - DOI - PMC - PubMed

LinkOut - more resources