. 2015 Dec 4:5:17830.
doi: 10.1038/srep17830.

Muscle networks: Connectivity analysis of EMG activity during postural control

Affiliations

Muscle networks: Connectivity analysis of EMG activity during postural control

Tjeerd W Boonstra et al. Sci Rep. .

Abstract

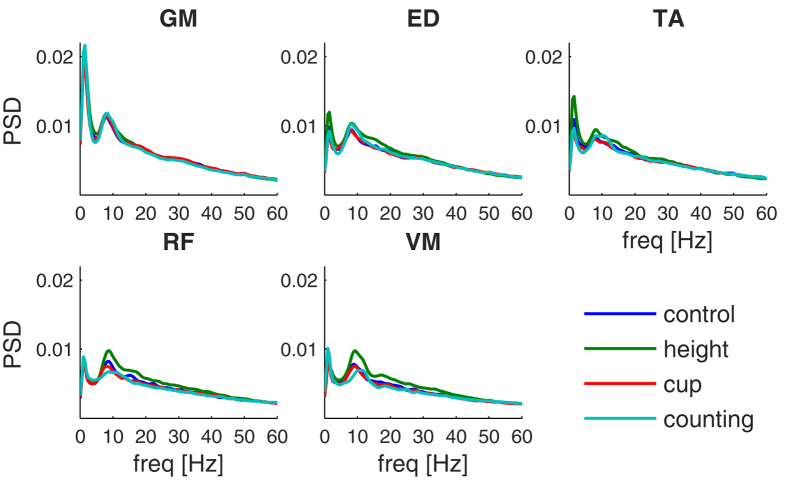
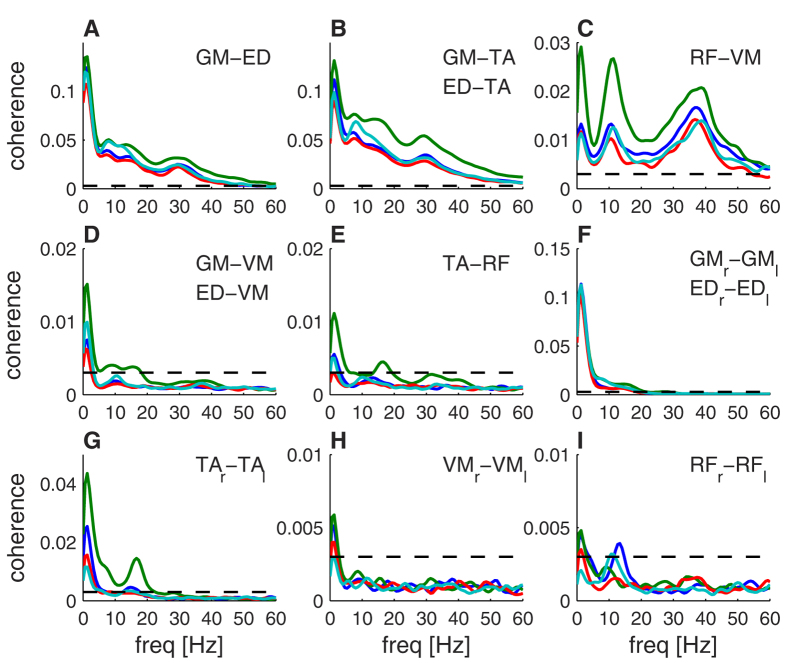
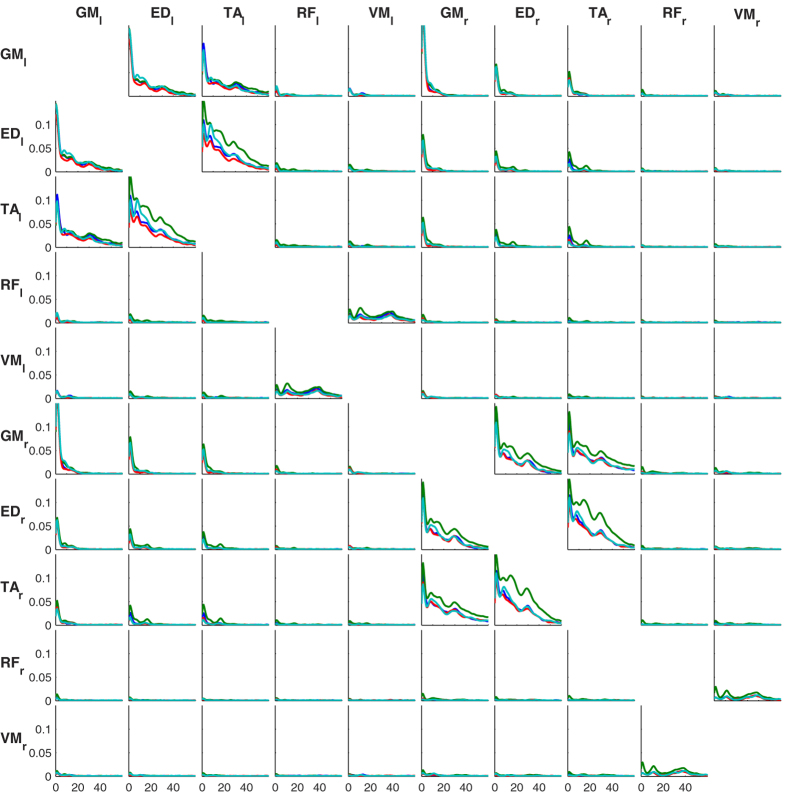
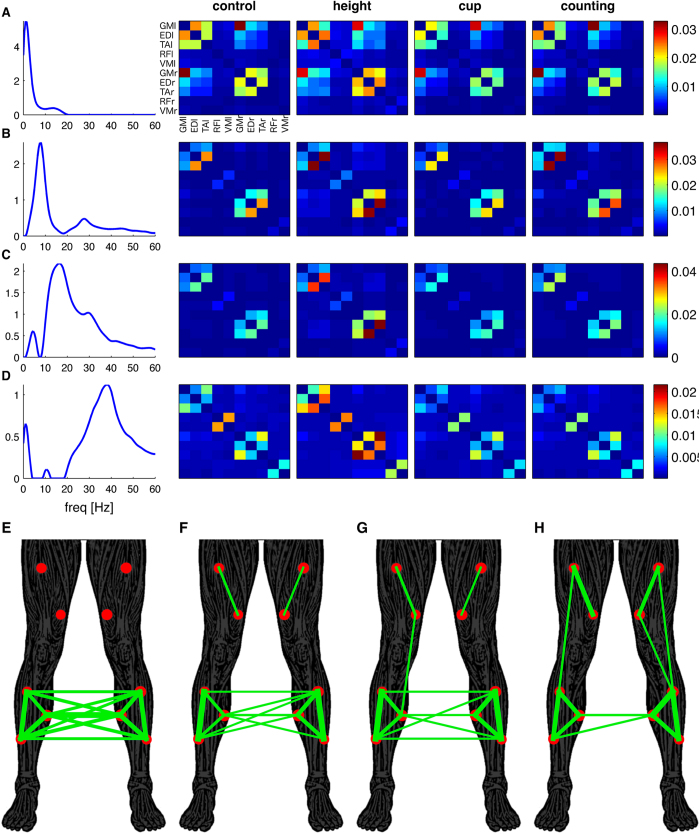
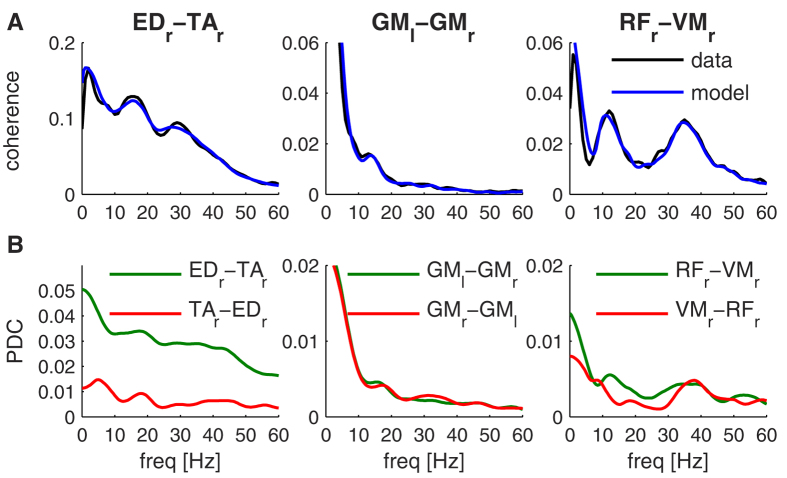
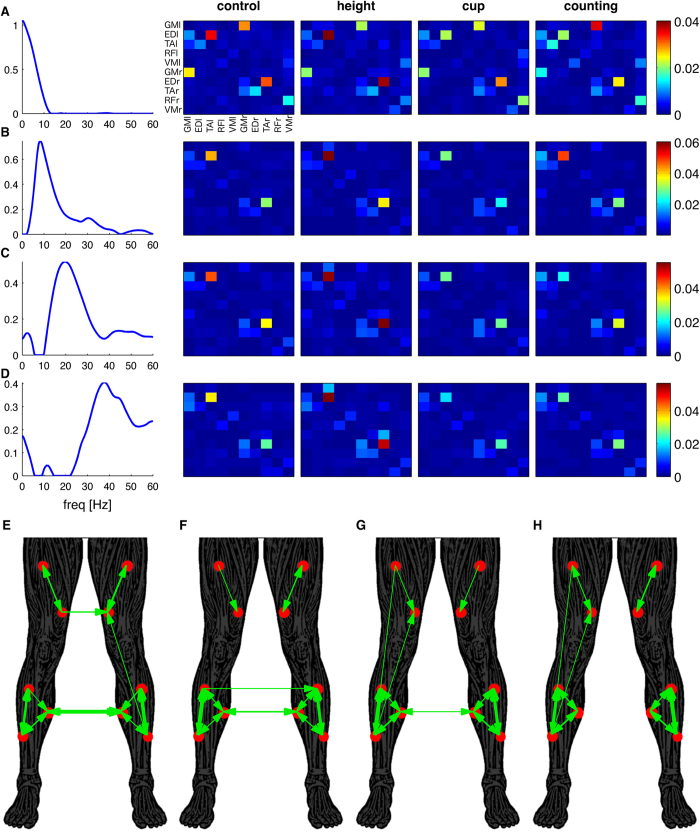
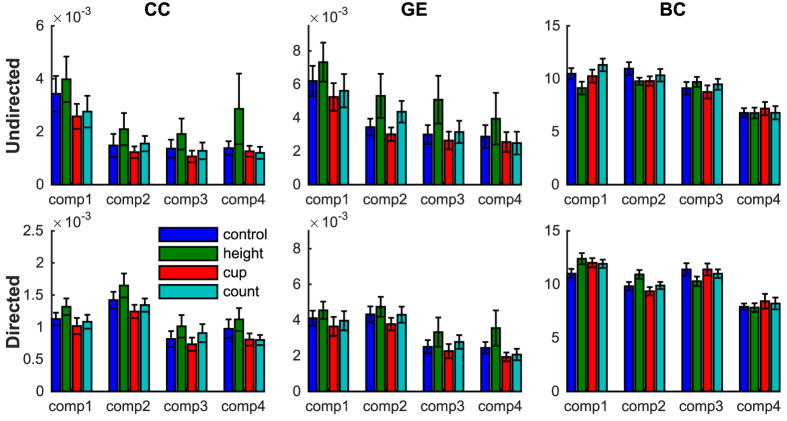
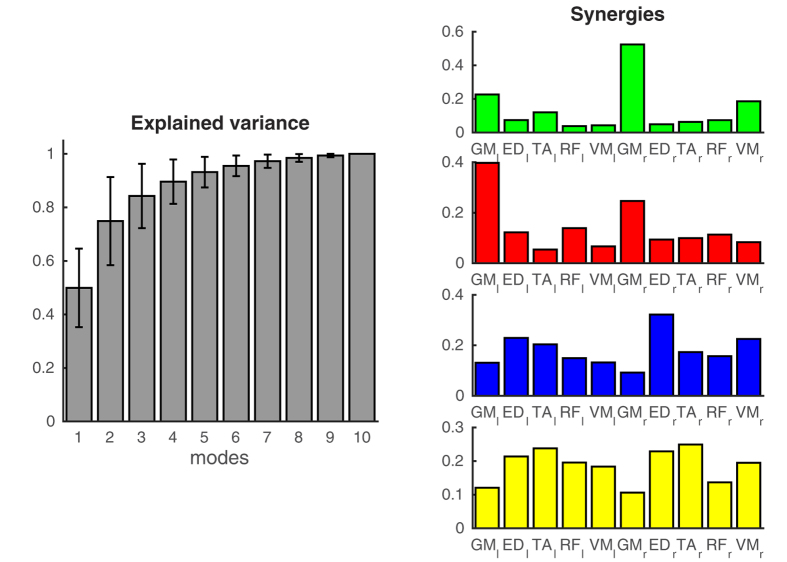
Understanding the mechanisms that reduce the many degrees of freedom in the musculoskeletal system remains an outstanding challenge. Muscle synergies reduce the dimensionality and hence simplify the control problem. How this is achieved is not yet known. Here we use network theory to assess the coordination between multiple muscles and to elucidate the neural implementation of muscle synergies. We performed connectivity analysis of surface EMG from ten leg muscles to extract the muscle networks while human participants were standing upright in four different conditions. We observed widespread connectivity between muscles at multiple distinct frequency bands. The network topology differed significantly between frequencies and between conditions. These findings demonstrate how muscle networks can be used to investigate the neural circuitry of motor coordination. The presence of disparate muscle networks across frequencies suggests that the neuromuscular system is organized into a multiplex network allowing for parallel and hierarchical control structures.


Figures

Figure 1
Figure 1. Normalized power spectral density (PSD) of the EMG envelope.
PSD are shown for different muscles (GM: gastrocnemius, ED: extensor digitorum longus, TA: tibialis anterior, RF: rectus femoris, VM: vastus medialis) and in different conditions (blue = control, green = height, red = hold cup, cyan = counting). Power spectra were averaged across homologous muscles, trials and subjects and normalized to total power.
Figure 2
Figure 2. Intermuscular coherence for different conditions and muscle groups.
(A) Between agonists in lower leg (GM-ED), (B) antagonists in lower leg (GM-TA, ED-TA), (C) antagonist in upper leg (RF-VM), (D) extensors in lower and upper leg (GM-VM, ED-VM), (E) flexors in lower and upper leg (TA-RF), (F) homologous extensors in lower leg (GMr-GMl, EDr-EDl), (G) homologous flexors in lower leg (TAr-TAl), (H) homologous flexor in lower leg (VMr-VMl), (I) homologous extensors in lower leg (RFr-RFl). Dashed lines show the 95% confidence intervals obtained through phase randomization of the EMG signals. Experimental conditions are reflected by line color (blue = control, green = height, red = cup, cyan = counting).
Figure 3
Figure 3. Intermuscular coherence between all muscle combinations.
Coherence is shown between all 5 leg muscles (GM, ED, TA, RF and VM) on both sides (left indicated with a subscripted l, right with subscripted r) and for all conditions (blue = control, green = height, red = cup, cyan = counting).
Figure 4
Figure 4. Undirected muscle networks obtained using non-negative matrix factorization of intermuscular coherence.
The frequency content of the coherence spectra of all muscle combinations, conditions and subjects are decomposed into four components (A–D). Each factor is characterized by the extracted feature (frequency spectrum in the left column) and the loadings of this feature in original spectra. The right columns show the average loading across subjects for each condition separately (control, height, cup and counting). These loadings give the strength of the edges between the 10 nodes of each muscle network. Panels (E–H) show the binarised networks obtained using proportional thresholds (top 30%) for the networks corresponding to the frequency components in panels (A–D) respectively. The threshold was 0.0059, 0.0019, 0.0019 and 0.0014 for panels E-H, respectively. Connection strength is reflected by the width of the lines.
Figure 5
Figure 5. Coherence and partial directed coherence (PDC) obtained from MVAR model.
(A) Comparison between coherence estimated from the empirical data using Welch method and coherence derived from the coefficients of the MVAR models that were fitted to the data. Intermuscular coherence between three muscle pairs are displayed (EDr-TAr, GMl-GMr, RFr-VMr); (B) PDC derived from the coefficients of the same MVAR models. In contrast to coherence estimates, PDC is a directed measure and connectivities in both directions are plotted.
Figure 6
Figure 6. Directed muscle networks obtained using non-negative matrix factorization of PDC.
The frequency content of the coherence spectra of all muscle combinations, conditions and subjects are decomposed into four components (A–D). Each factor is characterized by the frequency spectrum and the loadings of this feature in original spectra. The right columns show the average loading across subjects for each condition (control, height, cup and counting). Panels (E–H) show the binarised directed networks obtained using proportional thresholds (top 15%) for the networks corresponding to the frequency components in panels (A–D), respectively. The threshold was 0.0020, 0.0015, 0.0028 and 0.0018 for panels E–H, respectively. The arrows show the direction of connectivity. The width of the arrow reflects the connection strength.
Figure 7
Figure 7. Summary statistics of complex network.
Network metrics were used to statistically compare the muscle networks across conditions (blue = control, green = height, red = cup, cyan = counting) and frequencies (comp1 = 0–5 Hz, comp2 = 5–12 Hz, comp3 = 12–25 Hz, comp4 = 25–45 Hz). Clustering coefficient (CC), global efficiency (GE) and betweenness-centrality (BC) were assessed for the undirected networks obtained from intermuscular coherence (top row) and for the directed networks obtained from PDC (bottom row). Error bars reflect the standard error of the mean.
Figure 8
Figure 8. Muscle synergies extracted from EMG envelopes.
The left panel shows the cumulative of the variance explained by the 10 principal components. On average, four components are required to explain 90% of the variance. The right panels show the four synergies extracted using non-negative matrix factorization.

References

    1. Buzsaki G. & Draguhn A. Neuronal oscillations in cortical networks. Science 304, 1926–1929 (2004). - PubMed
    1. Engel A. K., Fries P. & Singer W. Dynamic predictions: oscillations and synchrony in top-down processing. Nat Rev Neurosci 2, 704–716 (2001). - PubMed
    1. Fries P. A mechanism for cognitive dynamics: neuronal communication through neuronal coherence. Trends Cogn Sci 9, 474–480 (2005). - PubMed
    1. Gray C. M. & Singer W. Stimulus-specific neuronal oscillations in orientation columns of cat visual cortex. Proc Natl Acad Sci USA 86, 1698–1702 (1989). - PMC - PubMed
    1. Varela F., Lachaux J. P., Rodriguez E. & Martinerie J. The brainweb: phase synchronization and large-scale integration. Nat Rev Neurosci 2, 229–239 (2001). - PubMed

Publication types