. 2015 Dec 4:6:8971.
doi: 10.1038/ncomms9971.

Systematic pan-cancer analysis of tumour purity

Affiliations

Systematic pan-cancer analysis of tumour purity

Dvir Aran et al. Nat Commun. .

Erratum in

Abstract

The tumour microenvironment is the non-cancerous cells present in and around a tumour, including mainly immune cells, but also fibroblasts and cells that comprise supporting blood vessels. These non-cancerous components of the tumour may play an important role in cancer biology. They also have a strong influence on the genomic analysis of tumour samples, and may alter the biological interpretation of results. Here we present a systematic analysis using different measurement modalities of tumour purity in >10,000 samples across 21 cancer types from the Cancer Genome Atlas. Patients are stratified according to clinical features in an attempt to detect clinical differences driven by purity levels. We demonstrate the confounding effect of tumour purity on correlating and clustering tumours with transcriptomics data. Finally, using a differential expression method that accounts for tumour purity, we find an immunotherapy gene signature in several cancer types that is not detected by traditional differential expression analyses.


Figures

Figure 1
Figure 1. Tumour purity of TCGA cancers types.
(a) Pairwise correlations between tumour purity methods used in 21 cancer types and all samples combined. Grey cells: data not available from both purity methods. Correlations between the genomic-based methods are high in most cancer types. Correlations with IHC are low, yet always positive. (b) Violin plots of CPE tumour purity in 21 cancer types. The cancers were ordered according to median purity.
Figure 2
Figure 2. Tumour purity and mutational burden.
Scatter plot of median number of mutations per tumour sample for each of the 21 cancer types (log 10 scale) versus median tumour purity as calculated by CPE. Pearson coefficient is presented. The least-squares line presented was calculated without the five outliers coloured in lighter blue.
Figure 3
Figure 3. Tumour purity and prognosis.
(a) CPE tumour purity in different histological subtypes in lower-grade glioma (LGG), breast (BRCA), cervix (CESC) and thyroid (THCA) tumour subtypes. Sample numbers are in parentheses. One-way analysis of variance (ANOVA) P values are presented. (b) CPE tumour purity levels in different histological grading methods. Histological grade is shown in kidney renal clear cell carcinoma (KIRC), LGG and prostate adenocarcinoma (PRAD). Breslow's depth value grouped in stages is shown in melanoma (SKCM). In LGG, the purity level of glioblastoma (GBM), which is grade 4, is shown as a reference. In PRAD, the grade is of the primary pattern. One-way ANOVA P values are presented. (c) Kaplan–Meier survival plot in LGG and KIRC patients with low purity (3rd tertile) and high purity (1st tertile). Log rank P values are presented.
Figure 4
Figure 4. Tumour purity confounds co-expression analysis.
(a) The problem of co-expression without accounting for sample purity. Top panel: correlation of expression between colony-stimulating factor 1 receptor (CSF1R) and Janus kinase 3 (JAK3) in bladder urothelial carcinoma (BLCA). Lower panels: high linear correlation between tumour purity and expression of those genes. The y axis is in log scale, and the fitted line is in log scale accordingly. There is no known interaction between these genes. (b) Co-expression matrix of top 5,000 genes according to gene expression s.d. Cell(i,j) is the Spearman coefficient between expression of gene i and gene j. Genes were clustered according to the Euclidean distance between them. Bottom vector: coloured by the correlation of the genes with purity. The four major clusters are boxed; average correlation of genes with purity in the cluster is shown. Group A is highly enriched with genes negatively correlated with purity. Group C has only genes positively correlated with purity. (c) Scatter plot of co-expression correlations (x axis) versus partial correlation of co-expression controlling for CPE purity levels (y axis) in all 21 cancer types. Analysis was restricted to the top 1,000 genes according to gene expression standard deviation in each cancer type, and the plot shows correlations with a Spearman coefficient >0.5. The colours correspond to the multiplication of the correlation of the co-expressed genes with purity. (d) Scatter plot of the difference in correlation between regular co-expression and purity controlled pair of genes (x axis) versus the pairwise multiplication of the co-expressed genes with purity. Red line: kernel smoothing regression of the data.
Figure 5
Figure 5. Tumour purity confounds molecular subtyping.
(a) Boxplot of molecular subtypes as a function of tumour purity in glioblastoma (GBM). The numbers of samples associated with the subtypes are in parentheses. One-way analysis of variance P value is presented on top. The central red mark is the median; the edges of the box are the 25th and 75th percentiles. (b) Same as a for lung adenocarcinoma samples (LUAD). (c) Distributions of the Spearman coefficient of genes with purity in GBM (up) and LUAD (down). Blue curves: distributions for all genes; red curves: the 840 and 506 genes used for classifying the subtypes in GBM and LUAD, respectively. Kolmogorov–Smirnov P values are on top.
Figure 6
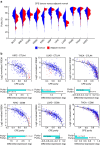
Figure 6. Differential expression analysis adjusted to tumour purity.
(a) Violin plots of CPE purity in 13 TCGA types. Blue distributions: tumour samples; red distributions: non-tumour adjacent normal tissue. (b) CTLA-4 and CD86 expression profiles (y axis) versus CPE purity levels (x axis) in kidney renal clear cell carcinoma (KIRC), lung adenocarcinoma (LUAD) and thyroid carcinoma. Black curve: linear fit for purity and expression. For presentation purposes, the y axis uses a log2 scale. Bottom vertical bars: differential expression levels in log2 scale as calculated by DESeq2 in a traditional analysis (purity−) and adjusted analysis (purity+).
Figure 7
Figure 7. Enriched pathways of differential expression adjusted for tumour purity.
Pathway analysis of genes whose ranks advanced significantly in purity+ compared with purity−. The plot shows pathways that were enriched in at least one of the cancer types. Black: highly enriched; white: no enrichment. Analysis was performed using Ingenuity Pathway Analysis.

References

    1. Joyce J. A. & Pollard J. W. Microenvironmental regulation of metastasis. Nat. Rev. Cancer 9, 239–252 (2009). - PMC - PubMed
    1. Hanahan D. & Weinberg R. A. Hallmarks of cancer: the next generation. Cell 144, 646–674 (2011). - PubMed
    1. Junttila M. R. & de Sauvage F. J. Influence of tumour micro-environment heterogeneity on therapeutic response. Nature 501, 346–354 (2013). - PubMed
    1. Schreiber R. D., Old L. J. & Smyth M. J. Cancer immunoediting: integrating immunity's roles in cancer suppression and promotion. Science 331, 1565–1570 (2011). - PubMed
    1. Pages F. et al.. Immune infiltration in human tumours: a prognostic factor that should not be ignored. Oncogene 29, 1093–1102 (2010). - PubMed

Publication types