

Age- and Level-Dependence of Fatty Infiltration in Lumbar Paravertebral Muscles of Healthy Volunteers
- PMID: 26635285
- PMCID: PMC7960169
- DOI: 10.3174/ajnr.A4596
Age- and Level-Dependence of Fatty Infiltration in Lumbar Paravertebral Muscles of Healthy Volunteers
Abstract
Background and purpose: Normative age-related decline in paravertebral muscle quality is important for reference to disease and risk identification in patients. We aimed to establish age- and vertebral level-dependence of paravertebral (multifidus and erector spinae) muscle volume and fat content in healthy adult volunteers.
Materials and methods: In this prospective study multifidus and erector spinae fat signal fraction and volume at lumbar levels L1-L5 were measured in 80 healthy volunteers (10 women and men per decade, 20-62 years of age) by 2-point Dixon 3T MR imaging. ANOVA with post hoc Bonferroni correction compared fat signal fraction and volume among subgroups. Pearson and Spearman analysis were used for correlations (P < .05).
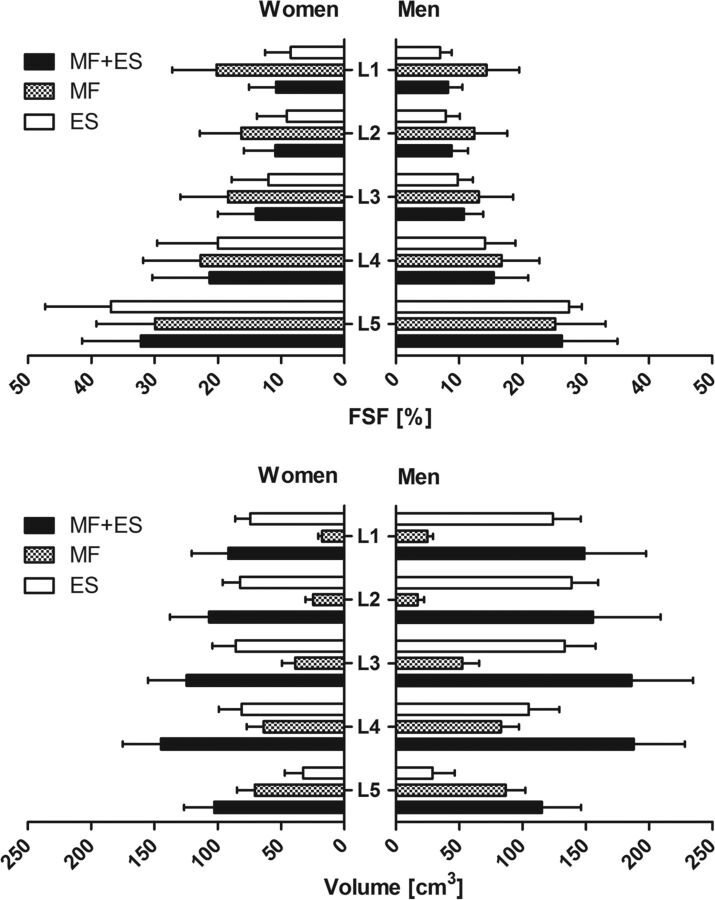
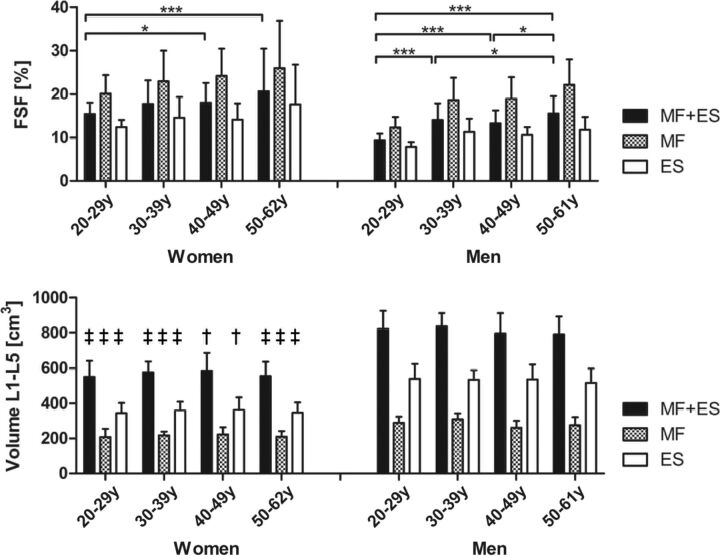
Results: Fat signal fraction was higher in women (17.8% ± 10.7%) than men (14.7% ± 7.8%; P < .001) and increased with age. Multifidus and erector spinae volume was lower in women (565.4 ± 83.8 cm(3)) than in men (811.6 ± 98.9 cm(3); P < .001) and was age-independent. No differences in fat signal fraction were shown between the right and left paravertebral muscles or among the L1, L2, and L3 lumbar levels. The fat signal fraction was highest at L5 (women, 31.9% ± 9.3%; men, 25.7% ± 8.0%; P < .001). The fat signal fraction at L4 correlated best with total lumbar fat signal fraction (women, r = 0.95; men, r = 0.92, P < .001). Total fat signal fraction was higher in the multifidus compared with erector spinae muscles at L1-L4 for both sexes (P < .001).
Conclusions: Lumbar paravertebral muscle fat content increases with aging, independent of volume, in healthy volunteers 20-62 years of age. Women, low lumbar levels, and the multifidus muscle are most affected. Further study examining younger and older subjects and the functional impact of fatty infiltrated paravertebral muscles are warranted.
© 2016 by American Journal of Neuroradiology.
Figures
References
Publication types
MeSH terms
Grants and funding
LinkOut - more resources
Full Text Sources