. 2015 Nov 26:6:1046.
doi: 10.3389/fpls.2015.01046. eCollection 2015.

Association Mapping in Scandinavian Winter Wheat for Yield, Plant Height, and Traits Important for Second-Generation Bioethanol Production

Affiliations

Association Mapping in Scandinavian Winter Wheat for Yield, Plant Height, and Traits Important for Second-Generation Bioethanol Production

Andrea Bellucci et al. Front Plant Sci. .

Abstract

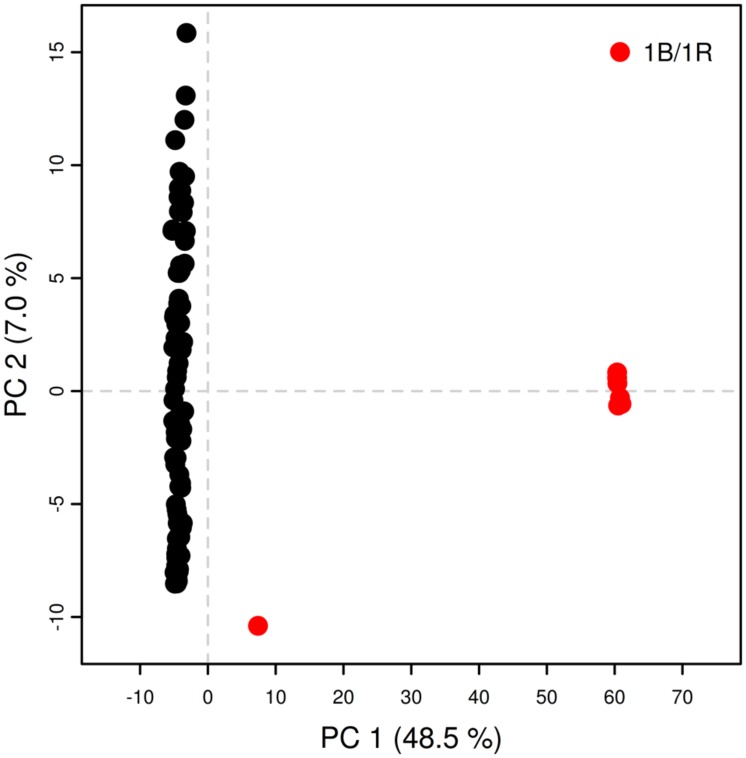
A collection of 100 wheat varieties representing more than 100 years of wheat-breeding history in Scandinavia was established in order to identify marker-trait associations for plant height (PH), grain yield (GY), and biomass potential for bioethanol production. The field-grown material showed variations in PH from 54 to 122 cm and in GY from 2 to 6.61 t ha(-1). The release of monomeric sugars was determined by high-throughput enzymatic treatment of ligno-cellulosic material and varied between 0.169 and 0.312 g/g dm for glucose (GLU) and 0.146 and 0.283 g/g dm for xylose (XYL). As expected, PH and GY showed to be highly influenced by genetic factors with repeatability (R) equal to 0.75 and 0.53, respectively, while this was reduced for GLU and XYL (R = 0.09 for both). The study of trait correlations showed how old, low-yielding, tall varieties released higher amounts of monomeric sugars after straw enzymatic hydrolysis, showing reduced recalcitrance to bioconversion compared to modern varieties. Ninety-three lines from the collection were genotyped with the DArTseq(®) genotypic platform and 5525 markers were used for genome-wide association mapping. Six quantitative trait loci (QTLs) for GY, PH, and GLU released from straw were mapped. One QTL for PH was previously reported, while the remaining QTLs constituted new genomic regions linked to trait variation. This paper is one of the first studies in wheat to identify QTLs that are important for bioethanol production based on a genome-wide association approach.

Keywords: GWAS; QTL; Triticum aestivum L.; ligno-cellulosic biomass; recalcitrance.


Figures

FIGURE 1
FIGURE 1
Intra-chromosomal linkage disequilibrium (LD) decay in the historical Scandinavian winter wheat collection separated for type of marker. Markers on chromosome 1B were omitted from calculations. r2-values of LD are plotted as a function of the distance between pairs of markers considered. Blue line: r2-values of the 95th percentile for unlinked (>50 cM) markers. Red line: second-degree smoothed loess curve.
FIGURE 2
FIGURE 2
Principal component analysis for PAVs on 1B linkage group 1. Red circles: lines presenting 1B/1R translocation; black circles: remaining lines.
FIGURE 3
FIGURE 3
Principal coordinate analysis of population structure using genotypic data. Red circles: lines presenting 1B/1R translocation; green circles: cluster of modern varieties; black circles: remaining lines not showing a specific clustering pattern.
FIGURE 4
FIGURE 4
Manhattan plots for genome wide association study (GWAS) of GY (grain yield), PH (plant height), and GLU (glucose released after enzymatic hydrolysis of biomass). On the x-axis the A, B, and D genomes are in red, green, and blue, respectively. Different color tones correspond to different chromosomes within the same genome from 1 to 7. Chromosomes containing two linkage groups are represented by vertical dotted lines separating them. The dashed horizontal line indicates the significant threshold at –log10(p-value) = 3.
FIGURE 5
FIGURE 5
Boxplot of trait variation for genotypes showing different alleles at significant markers. For plant height QTL on 6A between 1.14 and 4.89 cM, only the most significant marker out of seven (SNP 1090816) is shown.

References

    1. Alexandersson E., Jacobson D., Vivier M. A., Weckwerth W., Andreasson E. (2014). Field-omics-understanding large-scale molecular data from field crops. Front. Plant Sci. 5:286 10.3389/fpls.2014.00286 - DOI - PMC - PubMed
    1. Bates D., Maechler M., Bolker B., Walker S. (2014). lme4: Linear Mixed-Effects Models Using Eigen and S4. Available at: http://CRAN.R-project.org/package=lme4
    1. Beales J., Turner A., GriYths S., Snape J. W., Laurie D. A. (2007). A Pseudo-Response Regulator is misexpressed in the photoperiod insensitive Ppd-D1a mutant of wheat (Triticum aestivum L.). Theor. Appl. Genet. 115 721–733. 10.1007/s00122-007-0603-4 - DOI - PubMed
    1. Bekiaris G., Lindedam J., Peltre C., Decker S. R., Turner G. B., Magid J., et al. (2015). Rapid estimation of sugar release from winter wheat straw during bioethanol production using FTIR-photoacoustic spectroscopy. Biotechnol. Biofuels 8:85 10.1186/s13068-015-0267-2 - DOI - PMC - PubMed
    1. Bentley A. R., Scutari M., Gosman N., Faure S., Bedford F., Howell P., et al. (2014). Applying association mapping and genomic selection to the dissection of key traits in elite European wheat. Theor. Appl. Genet. 127 2619–2633. 10.1007/s00122-014-2403-y - DOI - PubMed