. 2015 Dec 4;11(12):e1004559.
doi: 10.1371/journal.pcbi.1004559. eCollection 2015 Dec.

Gene Expression Switching of Receptor Subunits in Human Brain Development

Affiliations

Gene Expression Switching of Receptor Subunits in Human Brain Development

Ossnat Bar-Shira et al. PLoS Comput Biol. .

Abstract

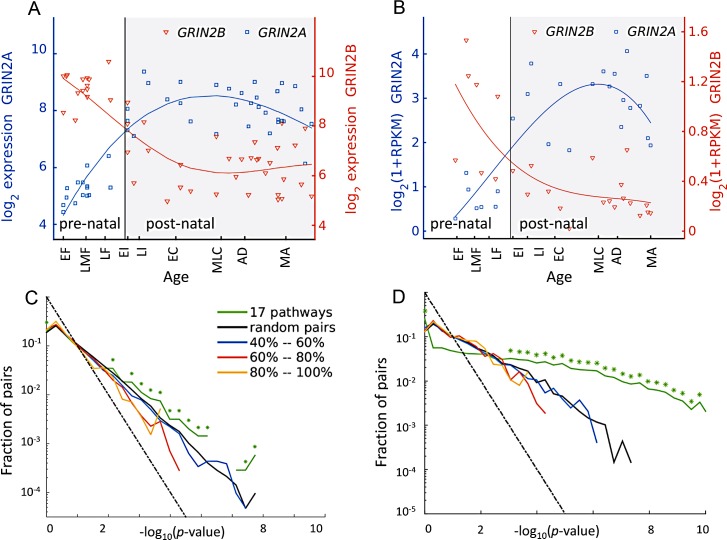
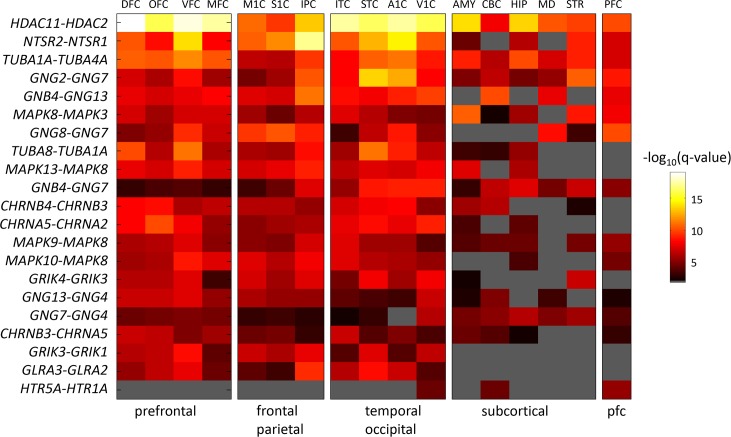
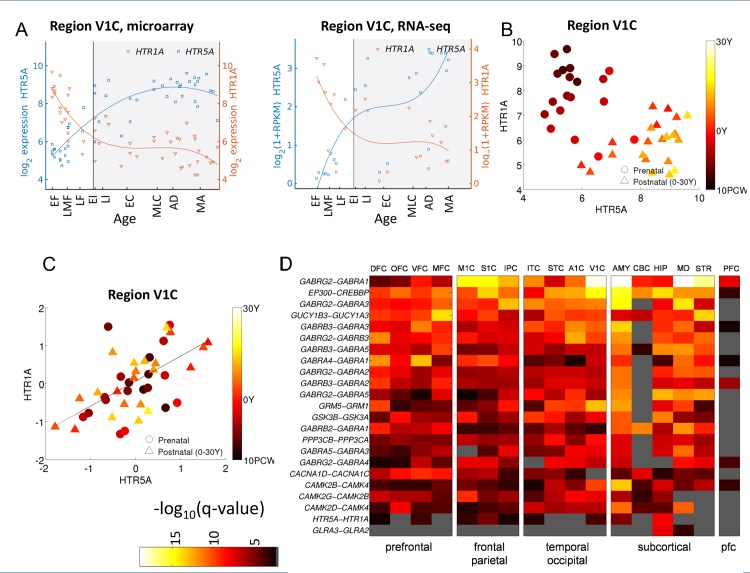
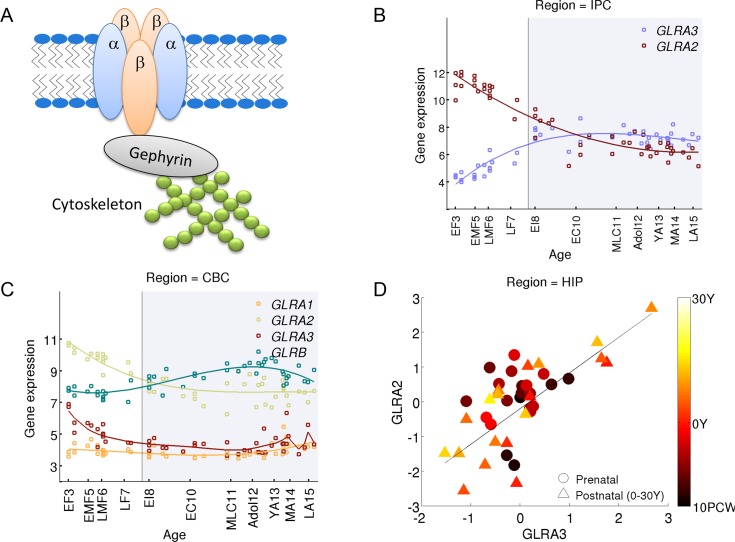
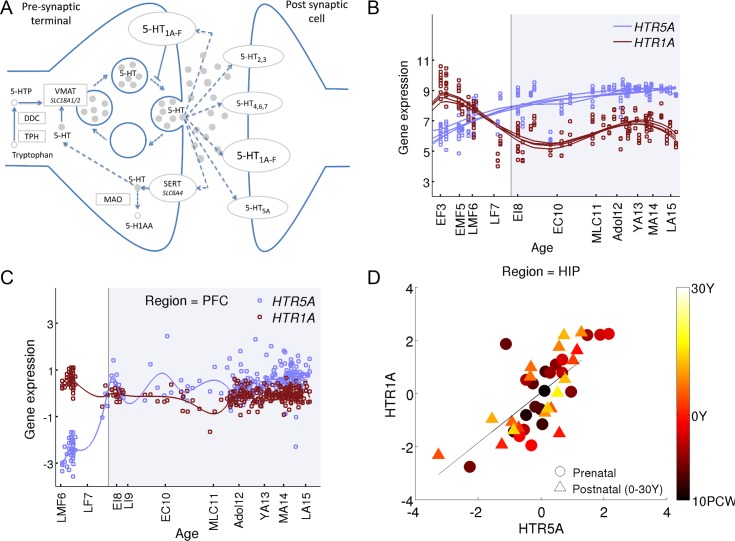
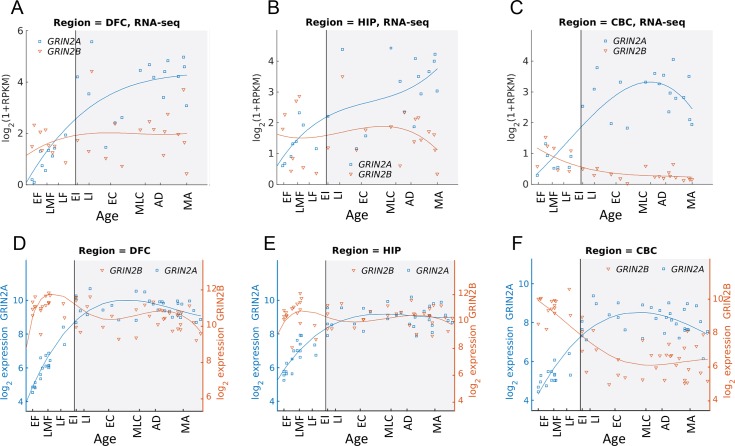
Synaptic receptors in the human brain consist of multiple protein subunits, many of which have multiple variants, coded by different genes, and are differentially expressed across brain regions and developmental stages. The brain can tune the electrophysiological properties of synapses to regulate plasticity and information processing by switching from one protein variant to another. Such condition-dependent variant switch during development has been demonstrated in several neurotransmitter systems including NMDA and GABA. Here we systematically detect pairs of receptor-subunit variants that switch during the lifetime of the human brain by analyzing postmortem expression data collected in a population of donors at various ages and brain regions measured using microarray and RNA-seq. To further detect variant pairs that co-vary across subjects, we present a method to quantify age-corrected expression correlation in face of strong temporal trends. This is achieved by computing the correlations in the residual expression beyond a cubic-spline model of the population temporal trend, and can be seen as a nonlinear version of partial correlations. Using these methods, we detect multiple new pairs of context dependent variants. For instance, we find a switch from GLRA2 to GLRA3 that differs from the known switch in the rat. We also detect an early switch from HTR1A to HTR5A whose trends are negatively correlated and find that their age-corrected expression is strongly positively correlated. Finally, we observe that GRIN2B switch to GRIN2A occurs mostly during embryonic development, presumably earlier than observed in rodents. These results provide a systematic map of developmental switching in the neurotransmitter systems of the human brain.


Conflict of interest statement

The authors have declared that no competing interests exist.

Figures

Fig 1
Fig 1. Condition-dependent variants of the NR2 subunits of human NMDA receptors.
(A) The expression profiles of GRIN2A and GRIN2B, the two genes encoding NR2A and NR2B in human cerebellum (CBC). The expression level of GRIN2B (NR2B) declines during prenatal and early childhood, while the expression level of GRIN2A (NR2A) rises during that period. (B) Same as A for RNA-seq Brainspan data [34]. (C) Distribution of correlation values across various gene pairs ad regions in the data of [32]. The curve marked ‘pathways’ corresponds to the all pairs from the brain-related keg pathways. Curves marked with percentages correspond to sets of gene pairs whose sequence overlap is in the designated range, based on biomart overlap measure. Asterisks mark bins of the histogram where the observed number pairs in the 17 pathways is significantly larger (permutation test, p <10–3) from that obtain at random. Dashed line shows the fraction expected at random. (D) Same as C for RNA-seq Brainspan data [34].
Fig 2
Fig 2. Dissimilarity significance of the top 20 genes in 17 brain regions measured by Kang et al. [32] and in the prefrontal cortex measured by Colantouni et al. [33].
Colors correspond to negative log 10(p-values) of Pearson correlation. Gray pixels denote regions in which the range of expression levels (maximum-minimum) was below 1.5 for at least one gene, or an insignificant q-value. The bottom row shows dissimilarity for an interesting pair of serotonin receptors. Brain regions are grouped and sorted as follows: prefrontal: DFC, OFC, VFC, MFC; frontal-parietal: M1C, S1C, IPC; temporal-occipital: ITC, STC, A1C, V1C; subcortical: AMY, CBC, HIP, MD, STR; prefrontal data from [33]: PFC. Region codes are listed in the Methods section. The genes coding for histone deacetylase, HDAC2 and HDAC11 exhibit significant dissimilarity levels in all brain areas. The genes coding for Neurotensin receptor NTSR1 and NTSR2 exhibit significant dissimilarity mainly in cortical regions and the striatum.
Fig 3
Fig 3. Age-corrected correlation.
(A) An example of fitting a cubic spline[80] to the expression of HTR1A and HTR5A in the primary visual cortex (V1C). Circles denote measured data points and solid lines denote a cubic spline fit. (B) Expression levels of HTR1A and HTR5A. Circles denote the expression of prenatal subjects, triangles of postnatal. The color scale denotes the age of each donor, with older subjects in light yellow and young subjects in dark. The expression is anti-correlated (ρ = -0.58). (C) After removing the population effect of age, the expression of HTR1A and HTR5A is positively correlated across subjects (ρ = 0.53, q-value < 10−4, Pearson). (D) The magnitude of age-corrected correlation (residuals) of 20 CDV pairs, ranked by the mean correlation over regions.
Fig 4
Fig 4. A novel CDV pair in the glycine receptor subunits GLRA2 and GLRA3.
(A) A diagram of glycine receptor components (B) The gene expression profiles of glycine receptor subunits as measured by Kang et al. (2011) in the human posterior inferior parietal cortex (IPC). (C) The gene expression profiles of glycine receptor subunits as measured by Kang et al. (2011) in the human cerebellar cortex. (D) Subject to subject age corrected correlation within two age groups, prenatal (10PCW-birth), and postnatal (0-30Y).
Fig 5
Fig 5. A novel CDV pair of serotonin-receptor genes HTR1A and HTR5A.
(A) A diagram of the serotonergic synapse. (B) The gene expression profiles of HTR1A and HTR5A serotonin receptors as measured by [32] in four regions of the human prefrontal cortex: dorsolateral, medial, orbital and ventrolateral prefrontal cortex. (C) The gene expression profiles of HTR1A and HTR5A serotonin receptors as measured by [33] in the prefrontal cortex. (D) Subject to subject correlation, after removing the population effect of age, between the expression levels of HTR1A and HTR5A within two age groups, prenatal (10PCW-birth), and postnatal (0-30Y) in the hippocampus.
Fig 6
Fig 6. Timing and spatial differences of the NR2A/2B developmental switch.
In human cortex (RNA-seq:A, microarrays: D) and Hippocampus (RNA-seq:B; microarrays:E) childhood expression level of NR2B exhibit little significant change, and NR2A may be rising slowly. In the cerebellum (RNA-seq: C; microarrays: F), a more significant switch is observed. In all cases, the largest changes in expression levels occur before birth, and much smaller changes are observed postnatally.

References

    1. Aoki-Kinoshita KF, Kanehisa M. Gene annotation and pathway mapping in KEGG. Methods Mol Biol. 2007;396: 71–91. - PubMed
    1. Kanehisa M, Goto S. KEGG: kyoto encyclopedia of genes and genomes. Nucleic Acids Res. 2000;28: 27–30. http://www.pubmedcentral.nih.gov/articlerender.fcgi?artid=102409&tool=pm... - PMC - PubMed
    1. Viswanathan GA, Nudelman G, Patil S, Sealfon SC. BioPP: a tool for web-publication of biological networks. BMC Bioinformatics. 2007;8: 168 - PMC - PubMed
    1. Laurie DJ, Wisden W, Seeburg PH. The distribution of thirteen GABAA receptor subunit mRNAs in the rat brain. III. Embryonic and postnatal development. J Neurosci. 1992;12: 4151–72. http://www.ncbi.nlm.nih.gov/pubmed/1331359 - PMC - PubMed
    1. Laurie DJ, Bartke I, Schoepfer R, Naujoks K, Seeburg PH. Regional, developmental and interspecies expression of the four NMDAR2 subunits, examined using monoclonal antibodies. Mol Brain Res. 1997;51: 23–32. http://www.sciencedirect.com/science/article/pii/S0169328X97002064 - PubMed

Publication types

MeSH terms