Review
. 2016 Jul;57(7):1111-25.
doi: 10.1194/jlr.R051904. Epub 2015 Dec 4.

Lipoprotein (a): impact by ethnicity and environmental and medical conditions

Affiliations
Review

Lipoprotein (a): impact by ethnicity and environmental and medical conditions

Byambaa Enkhmaa et al. J Lipid Res. 2016 Jul.

Abstract

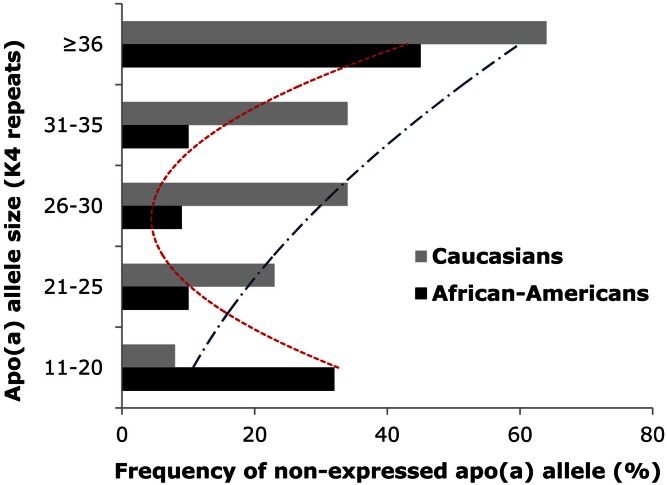
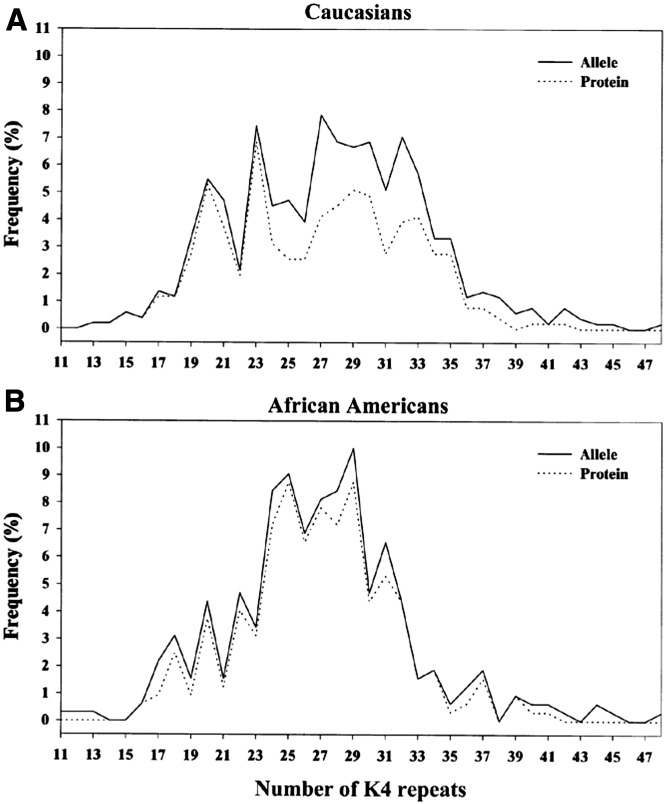
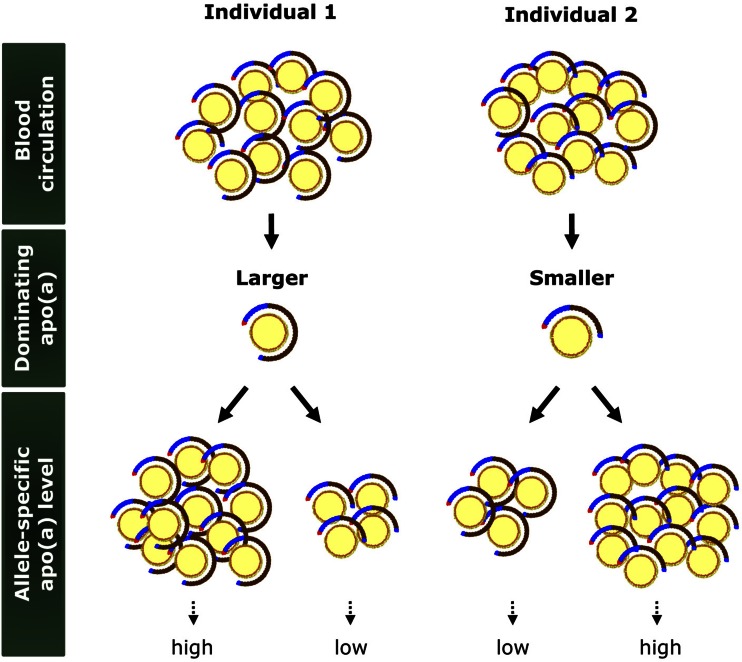
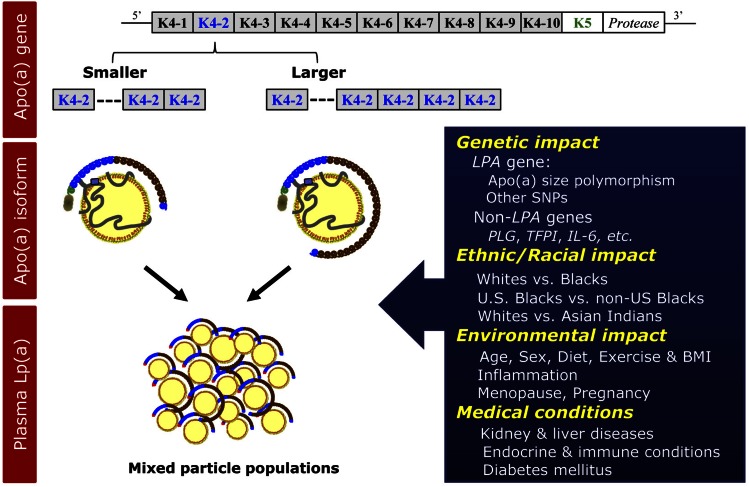
Levels of lipoprotein (a) [Lp(a)], a complex between an LDL-like lipid moiety containing one copy of apoB, and apo(a), a plasminogen-derived carbohydrate-rich hydrophilic protein, are primarily genetically regulated. Although stable intra-individually, Lp(a) levels have a skewed distribution inter-individually and are strongly impacted by a size polymorphism of the LPA gene, resulting in a variable number of kringle IV (KIV) units, a key motif of apo(a). The variation in KIV units is a strong predictor of plasma Lp(a) levels resulting in stable plasma levels across the lifespan. Studies have demonstrated pronounced differences across ethnicities with regard to Lp(a) levels and some of this difference, but not all of it, can be explained by genetic variations across ethnic groups. Increasing evidence suggests that age, sex, and hormonal impact may have a modest modulatory influence on Lp(a) levels. Among clinical conditions, Lp(a) levels are reported to be affected by kidney and liver diseases.

Keywords: apolipoprotein (a) size; demographic and clinical characteristics; diabetes; genetics; kidney and liver disease; populations.


Figures

Fig. 1.
Fig. 1.
Frequency distributions of nonexpressed apo(a) alleles across apo(a) size ranges in African-Americans and Caucasians. In general, within an individual, the larger apo(a) isoform is more likely to be nonexpressed at the protein level than the smaller isoform. This trend is more apparent in Caucasians with a gradual rise in the nonexpressed allele frequency with an increasing number of KIV repeats (21). Among African-Americans, a more U-shaped distribution was observed.
Fig. 2.
Fig. 2.
Frequency distribution of apo(a) alleles and isoforms in Caucasians (A) and African-Americans (B). Alleles are represented by the solid lines and apo(a) protein isoforms by the dashed lines (the dashed lines are not shown where they coincide with the solid lines). The isoform distribution was calculated by dividing the total number of protein bands detected by the total number of alleles, separately for each population. Homozygotes (n = 15) were excluded, as it was not possible to determine whether the single apo(a) protein band corresponded to one or two proteins. The African-American distribution had a narrower and taller peak while the Caucasian distribution was wider. Among Caucasians, nonexpressed alleles (the gap between the allele and isoform curves) were most frequent in the mid-range, whereas among African-Americans, they were fairly evenly distributed across apo(a) sizes. This figure was originally published in (21). © The American Society for Biochemistry and Molecular Biology.
Fig. 3.
Fig. 3.
Lp(a) and allele-specific apo(a) levels. Due to a high heterozygosity index at the genetic level, the total plasma Lp(a) level represents two particle populations, one carrying smaller size apo(a) and the other carrying larger size apo(a), in the majority of individuals. Depending on the dominance pattern of apo(a), some individuals have higher allele-specific apo(a) levels with larger apo(a) sizes (Individual 1) and others have higher allele-specific apo(a) levels with smaller apo(a) sizes (Individual 2).
Fig. 4.
Fig. 4.
Regulation of plasma Lp(a) levels. Lp(a) levels are primarily regulated by the apo(a) gene size polymorphism, i.e., copy number of KIV repeats. In addition, recent evidence suggests a role for other SNPs in the LPA, as well as non-LPA genes in the regulation of plasma Lp(a) levels. As noted in the Fig. 3, in the majority of individuals, two different populations of Lp(a) particles carrying different-sized apo(a) contribute to the overall plasma Lp(a) level. Lp(a) levels differ substantially between various ethnic/racial groups with higher levels in Blacks than in Whites. Evidence also supports a modulatory effect of age, sex, and hormones, although with a modest size on plasma Lp(a) levels. Among clinical conditions, Lp(a) levels are reported to be affected by kidney and liver diseases. K, kringle.

References

    1. Dahlén G., Berg K., Gillnäs T., and Ericson C.. 1975. Lp(a) lipoprotein/pre-beta1-lipoprotein in Swedish middle-aged males and in patients with coronary heart disease. Clin. Genet. 7: 334–341. - PubMed
    1. Frick M. H., Dahlen G., Berg K., Valle M., and Hekali P.. 1978. Serum lipids in angiographically assessed coronary atherosclerosis. Chest. 73: 62–65. - PubMed
    1. Berg K., Dahlen G., and Borresen A. L.. 1979. Lp(a) phenotypes, other lipoprotein parameters, and a family history of coronary heart disease in middle-aged males. Clin. Genet. 16: 347–352. - PubMed
    1. Kostner G. M., Avogaro P., Cazzolato G., Marth E., Bittolo-Bon G., and Qunici G. B.. 1981. Lipoprotein Lp(a) and the risk for myocardial infarction. Atherosclerosis. 38: 51–61. - PubMed
    1. Guyton J. R., Dahlen G. H., Patsch W., Kautz J. A., and Gotto A. M. Jr. 1985. Relationship of plasma lipoprotein Lp(a) levels to race and to apolipoprotein B. Arteriosclerosis. 5: 265–272. - PubMed