. 2015 Dec 3;163(6):1484-99.
doi: 10.1016/j.cell.2015.10.065.

A Dynamic Protein Interaction Landscape of the Human Centrosome-Cilium Interface

Affiliations

A Dynamic Protein Interaction Landscape of the Human Centrosome-Cilium Interface

Gagan D Gupta et al. Cell. .

Abstract

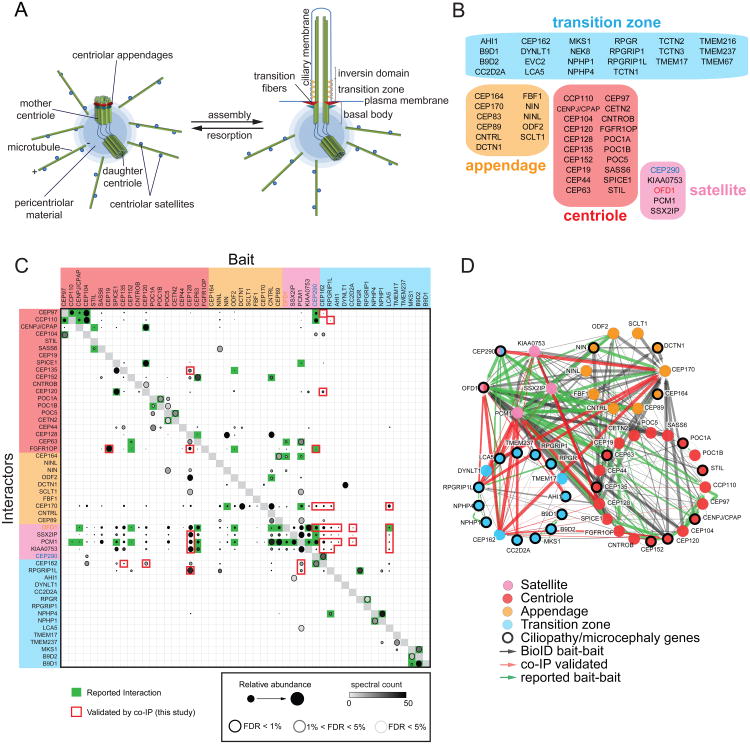
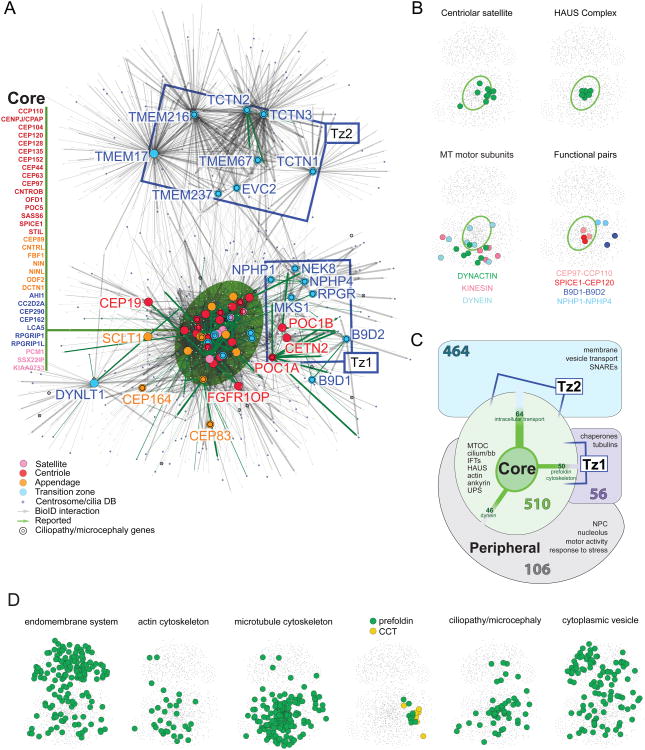
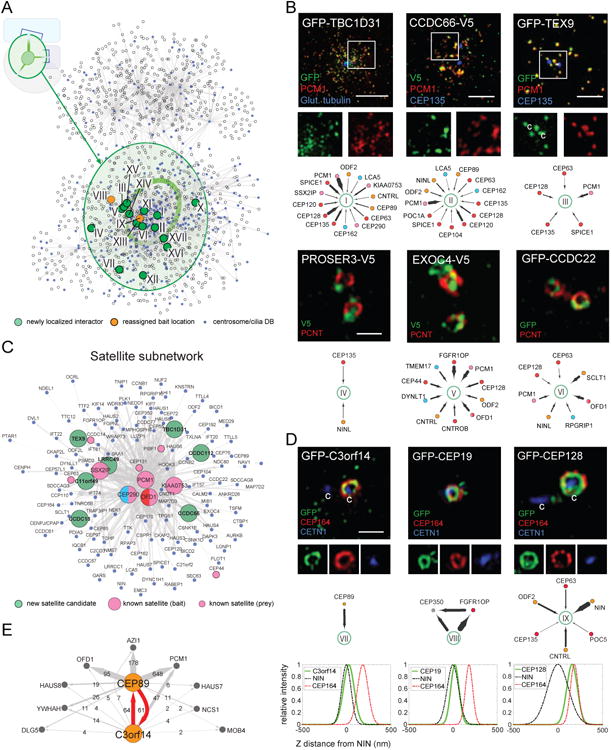
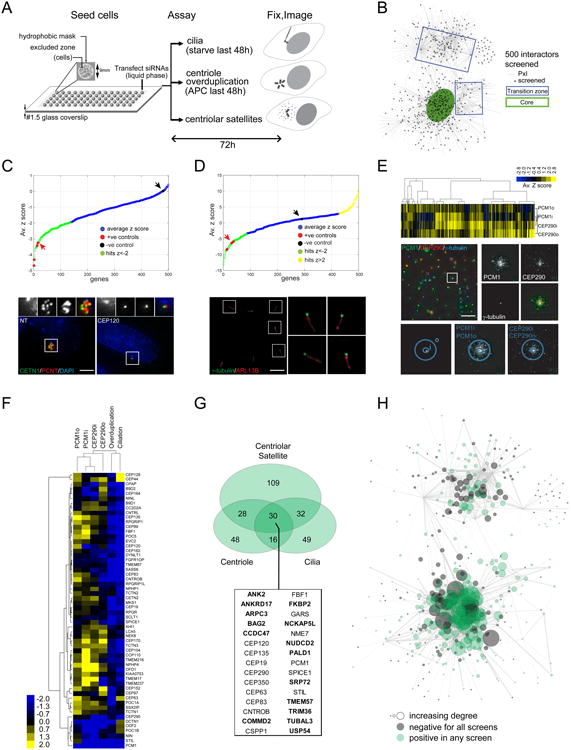
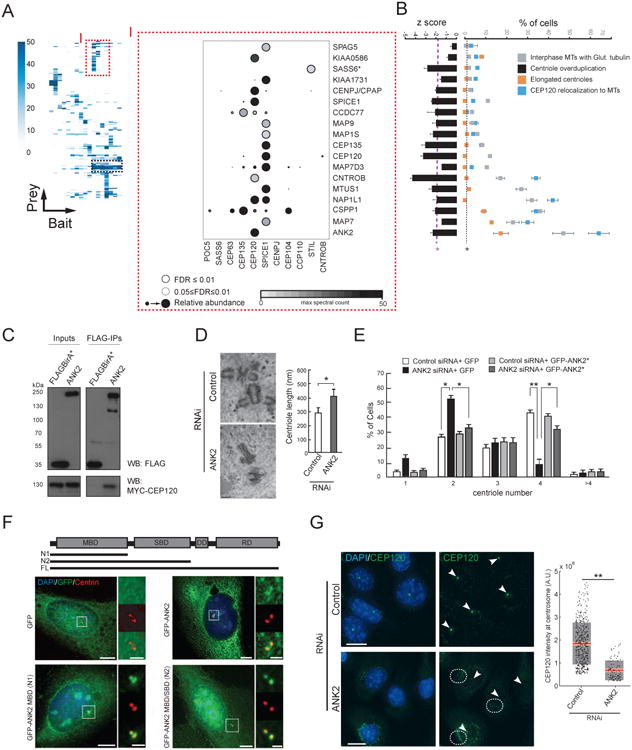
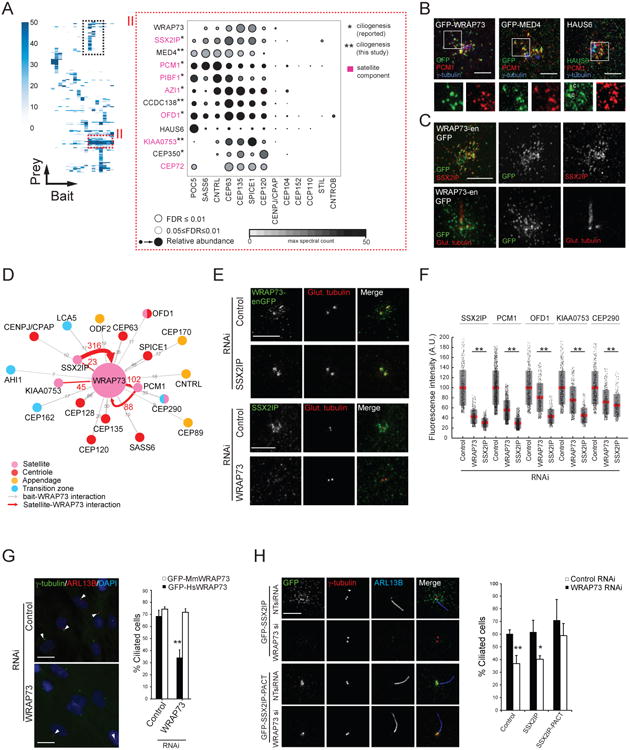
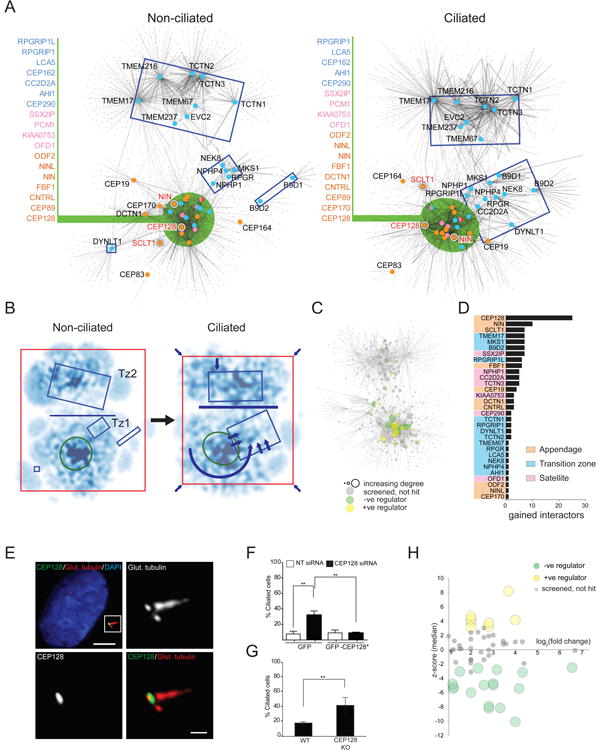
The centrosome is the primary microtubule organizing center of the cells and templates the formation of cilia, thereby operating at a nexus of critical cellular functions. Here, we use proximity-dependent biotinylation (BioID) to map the centrosome-cilium interface; with 58 bait proteins we generate a protein topology network comprising >7,000 interactions. Analysis of interaction profiles coupled with high resolution phenotypic profiling implicates a number of protein modules in centriole duplication, ciliogenesis, and centriolar satellite biogenesis and highlights extensive interplay between these processes. By monitoring dynamic changes in the centrosome-cilium protein interaction landscape during ciliogenesis, we also identify satellite proteins that support cilia formation. Systematic profiling of proximity interactions combined with functional analysis thus provides a rich resource for better understanding human centrosome and cilia biology. Similar strategies may be applied to other complex biological structures or pathways.


Figures

Figure 1
Figure 1. Proximity Mapping Of The Centrosome-Cilium Interface
A. Schematic representation of the mammalian centrosome and centrosome/basal body-primary cilium interface. Distal and subdistal appendages are indicated in red and blue, respectively. B. Bait proteins used in this study, grouped and color-coded according to primary localization. Note that CEP290 and OFD1 localize to both centriolar satellites and transition zone/centriole, respectively. C. Mass spectrometry Dot Plot view of bait-bait interactions. Dot shading (grey – black gradient) indicates total number of spectral counts detected for each prey protein. Dot size indicates relative abundance of prey protein in each BioID analysis. Confidence levels for each bait-bait interaction according to SAINT (significance analysis of interactome; (Teo et al., 2014)) false discovery rate (FDR) are indicated by dot border (light grey <5% FDR; black <1% FDR). Green boxes, previously reported interaction; red box border, BioID bait-bait interaction validated here by co-IP. Four previously reported bait-bait interactions were verified by co-IP as controls (green box highlighted with red border). Baits not interacting with any other bait protein omitted for clarity. D. Bait-bait PxIs detected in our study. Each node (color-coded circle) represents a unique bait protein associated with the indicated centrosome-cilium substructure. 70 previously reported (green edges), and 206 new (black edges) bait-bait interactions were detected. 30 bait-bait PxIs validated by co-IP highlighted in red. Edge thickness is proportional to peptide counts (maximum number of counts detected in a single MS analysis, or MaxSpec).
Figure 2
Figure 2. Topology Mapping Of The Centrosome-Cilium Interface
A. Self-organized, prefuse force-directed topology map (based on peptide count sum of two MS runs) of the centrosome-cilium BioID interactome, consisting of 4046 PxIs amongst 1405 proteins. Bait proteins represented by larger, color-coded nodes; interactors represented by small grey nodes. CCDB proteins are highlighted in blue; proteins linked to ciliopathies or microcephalies highlighted by a black ring. Previously reported PxIs highlighted by green edges; edge thickness proportional to MaxSpec. ‘Core’ component location highlighted by a green ellipse; bait proteins localized to this cluster are listed at left. Ciliary transition zone baits not located in the “core” region cluster into two additional topologically distinct zones (Tz1, Tz2) indicated with blue boxes. B. Functional module locations in the topology map. Map position of components of the indicated protein group overlaid on a thumbnail of the topology map. Green ellipse indicates “core” location (from Figure 2A). Functional protein groups highlighted in the indicated colors. C. “Clustergram” schematic of the BioID interactome, depicting the four primary map regions, the number of proteins specific to each cluster, and functional groups of interest relevant to each topological region. Polypeptides shared between groups are indicated by connecting edges, where edge thickness is proportional to the number of shared proteins (cluster-cluster connections with <15 shared interactors not shown; see Table S3 for details). D. Locations of enriched Gene Ontology (GO) categories or gene groups in the dataset (as indicated) overlaid on the network topology map. See also Table S3.
Figure 3
Figure 3. Identification Of New Centrosome/Satellite Components
A. Network layout of the BioID dataset, with the”core” region (see Figure 2C) highlighted in green. Newly assigned (green nodes) or re-assigned (orange nodes) centrosome components (labeled with roman numerals) are highlighted. CCDB proteins indicated in blue. B. (top) 3D-SIM micrographs of RPE-1 cells transiently expressing the indicated proteins, and labelled with the indicated antibodies. Centrioles, where apparent, marked with”c”. Scale bar 2.5μm, insets 1.8×. (bottom) Subnetworks highlighting PxIs of interest, color-coded based on primary localization as in Figure 1B, edge thickness proportional to MaxSpec. C. Simplified centriolar satellite subnetwork generated from PCM1, SSX2IP, KIAA0753, CEP290 and OFD1 interactomes. D. 3D-SIM micrographs of RPE-1 cells, as in B. Scale bar 1μm, inset panels 1×, 1×, and 0.8×, from left to right. (middle) Subnetworks highlighting PxIs of interest. (bottom) Intensity profile plots of relative Z axial positioning for the indicated proteins (green fit) with respect to reference markers NIN (subdistal; dashed black fit) and CEP164 (distal; dashed red fit). E. BioID analysis of C3orf14 and CEP89 (orange nodes); shared PxIs (grey) and peptide counts indicated.
Figure 4
Figure 4. Functional Screening Of Network Components
A. Schematic overview of high-throughput microscopy screens (see Experimental Procedures for details). B. Distribution of the screened network components in the BioID topology map. Screened polypeptides highlighted in black. C. (top) Z-score distribution of centriole overduplication screen (from Table S5). Positive controls (CEP120, PLK4, STIL, SASS6) highlighted in red; screen hits (Z-score < -2) indicated in green, and negative control (NT, non-targeting siRNA) in black, see arrows. (bottom) Representative micrographs from the screen, showing NT (bottom left panel) or a positive control (CEP120 siRNA; bottom right panel) cell with centriole(s) boxed in white (insets of centriole region in the small panels above). Scale bar 2μm, insets 1.8×. D. (top) Z-score distribution of cilia screen (from Table S5). Positive controls highlighted in red; hits indicated in green and yellow, negative control highlighted in black (see arrows). (bottom) Representative micrograph of a field of RPE-1 cells from the cilia screen, with γ-tubulin (green)-labelled puncta boxed in white and insets showing examples of primary cilia labelled with anti-ARL13B (red). Scale bar 6μm, insets 3×. E. (top) Distribution of Z-scores for four parameters measured in the satellite morphology screen, as defined by dilating the centrosomal signal near (“i”) or outside (“o”) the centrosome, for the satellite markers PCM1 and CEP290 (see bottom panels for example, and Experimental Procedures for details; from Table S5). Z-scores were subjected to unsupervised hierarchical clustering and the resulting heat map is shown. (middle) Representative micrograph of a field of control HeLa cells from the satellite screen, with a γ-tubulin (blue)-labelled spot boxed in white, and insets showing typical centrosomal and centriolar satellite patterns for the three channels. Scale bar 40μm, insets 2.5×. F. Z-scores in each of the three screens for the 58 baits used in this study were subjected to clustering, as in E. G. Area-proportional Venn diagram of the three screen hit populations. 30 genes that scored in all three screens are listed; genes not in CCDB are indicated in bold. H. Topology map of the screened subset of network components. Grey nodes were not hits in any screen, green nodes positive in any screen; node size corresponds to indegree (number of incoming connections) for each screened polypeptide.
Figure 5
Figure 5. Local Proximity Profiles Identify Functional Clusters: (I) ANK2 Is A Component Of A MT Stability Module That Regulates Centriole Duplication
A. (left) Hierarchical clustering reveals modules with similar proximity profiles (dashed boxes). Peptide counts (MaxSpec) indicated for each interactor (from complete cluster map in Table S6). (right) Mass spectrometry DotPlot of selected baits from the region of the CEP120/SPICE1 cluster denoted by “I” (as in Figure 1C, see legend). *SASS6 was not part of this interactor group, and is included here as a control (see B). B. (left) Interactors (presented in the same order as in A) were profiled for suppression of centriole amplification (see Figure 4A); (right) Qualitative phenotypes related to MT organization (see legend and Experimental Procedures). Dashed purple (overduplication assay) or black (all other assays) lines represent 1.9 and 2 S.D. of the mean of negative control values (*p<0.05, N>100, three replicates), respectively. Negative control values for MT phenotypes were <2% in all cases (not shown). C. Western blots (as indicated) of input (left) or FLAG IP (right) conducted on lysates from 293 T-REx cells stably expressing FLAGBirA* (tag alone; control) or FLAGBirA*-ANK2, transfected with MYC-CEP120. D. (left) Electron micrographs of U-2 OS Tet-inducible Myc-PLK4 cells transfected with control (top) or ANK2 (bottom) siRNA for 72 h. At 48 h post-transfection, hydroxyurea and tetracycline were added for 24 h to arrest cells in S-phase and induce centriole overduplication. (right) Average centriole length (±S.D.) in each population (*p=0.03, Student's t-test, N>15). Scale bar 200nm. E. Effect of ANK2 depletion on centriole number. U-2 OS lines carrying Tet-inducible GFP or the siRNA-resistant GFP-ANK2 (GFP-ANK2*) transgenes were transfected with control or ANK2 siRNA for 72 h. At 48 h post-transfection, tetracycline and hydroxyurea were added to induce ANK2 expression, and arrest cells in S-phase for 24 h. Cells were fixed and labelled with anti-centrin, and the number of centrioles per cell was counted. Bar graph, percent cells with indicated centriole number (N>300, 3 replicates, *p<0.05, **p<0.01). F. Full length (FL) and truncation constructs of GFP-ANK2 (top) were transfected into U-2 OS cells, and (left) IF microscopy was used to characterize localization at the centriole (boxed in white) with a marker (centrin). (right) Insets from top to bottom: GFP; centrin ; pseudocolor merge. Scale bar 10μm, insets 3×. G. Representative micrographs (left) of U-2 OS cells treated with control (top) or ANK2 (bottom) siRNA, and labelled with antibodies to endogenous CEP120 (green). White arrowheads denote centrosomal CEP120 puncta. Cytoplasmic regions where CEP120 has relocalized are encircled by white dashes. Scale bar 15μm. (right) Quantification of CEP120 levels at the centrosome (N>300, three replicates, **p<0.01, Student's t-test). Grey region denotes 2 S.D. from the mean (red line) and pink region denotes the 95% confidence interval.
Figure 6
Figure 6. Local Proximity Profiles Identify Functional Clusters: (II) WRAP73 Is Required for Ciliogenesis
A. (left) Hierarchical clustering reveals a second interactor group with similar proximity profiles (boxed regions; see Figure 5A). (right) Centriolar satellite enriched cluster “II” represented as a Dot Plot of spectral counts. Known satellite components labelled in pink. *previously associated with ciliogenesis; **candidate ciliogenesis regulators. B. 3D-SIM micrographs of RPE-1 cells transiently expressing the indicated proteins (except HAUS6, which was endogenously detected), and labelled with the indicated antibodies. Centrioles, where apparent, are marked with “c”. Scale bar 2.5μm. Insets 1.8×. C. 3D-SIM micrographs of a non-ciliated (top) or ciliated (bottom) RPE-1-WRAP73-GFP knock-in cell (denoted WRAP73-enGFP) labelled with the indicated antibodies. Scale bar 3μm. D. WRAP73 BioID subnetwork. Interactors (along with associated peptide counts) indicated according to legend. E. (top) 3D-SIM images of control (NT siRNA) or SSX2IP-depleted RPE-1-WRAP73-GFP knock-in cells (WRAP73-enGFP) labelled with anti-GFP and anti-poly-glutamylated tubulin. Scale bar 2μm. (bottom) IF analysis of control (NT siRNA) and WRAP73-depleted RPE-1 cells labelled with the indicated antibodies. Scale bar 5μm. F. Mean fluorescence intensity of the indicated proteins (top) in a region surrounding the centrosome (see “i” parameter in 4E) in WRAP73- and SSX2IP-depleted cells. Grey region denotes 2 S.D. from the mean (red line), pink region denotes 95% confidence interval. **p<0.01 by Student's t-test, N>400. G. (left) IF analysis of control and WRAP73-depleted RPE-1 cells labelled with DAPI and the indicated antibodies. Arrowheads indicate ciliated cells. Scale bar 20μm. (right) Percentage ciliated cells (N>100 cells per replicate, three replicates) in serum-starved RPE-1 cells stably expressing GFP-tagged human or mouse WRAP73; **p<0.01 by Student's t-test. H. (left) IF analysis (as indicated) of control (NT siRNA) and WRAP73-depleted RPE-1 cells stably expressing either GFP-SSX2IP or GFP-SSX2IP-PACT. Scale bar 5μm. (right) Percentage ciliated cells (N>100 cells per replicate, three replicates) in serum-starved RPE-1 (control) or RPE-1 cells stably expressing GFP-SSX2IP or GFP-SSX2IP-PACT, treated with the indicated siRNA; *p<0.05, **p<0.01 by Student's t-test.
Figure 7
Figure 7. Modulation Of The Proximity Interaction Landscape During Ciliogenesis
A. Self-organized prefuse force directed BioID-based topology network (as in Figure 2) of appendage, centriolar satellite and transition zone bait proteins in cells maintained under standard (non-ciliated; left) or serum-starved (ciliated; right) culture conditions. B. Kernel density representation of non-ciliated and ciliated topology maps, with darker regions representing higher node density. Rectangles highlight specific bait-containing regions, as in A. Horizontal blue line highlights the interaction interface between Tz2 and the remainder of the topology map; arrows depict TZ re-organization and network contraction. C. Distribution of cilia screen hits (negative regulators in green; positive regulators in yellow; not scoring grey; not tested white) overlaid on the ciliated topology map. Node diameter proportional to indegree. D. Number of gained cilia screen hits in serum-starved 293 T-REx cells, ranked by bait. Baits with no such interactors omitted for clarity. E. CEP128 localization (boxed in white) in serum-starved RPE-1 cells labeled with the indicated antibodies. Scale bar 5μm, inset 0.5μm. F. Cycling RPE-1 cells stably expressing GFP or siRNA-resistant GFP-CEP128 (GFP-CEP128*) transfected with control (NT siRNA) or CEP128 siRNA for 72 h. Percentage ciliated cells; N>200 cells per replicate, three replicates, **p<0.01 by Student's t-test. G. Percent ciliated cells in cycling control or CEP128 knockout RPE-1 cells; **p<0.01 by Student's t-test, N>100, three replicates. H. Median z-scores of ciliation efficiency versus log2 fold-change peptide count for each of 57 CEP128 interactors that were enriched by ciliogenesis induction. Significant z-scores labelled in yellow or green, as indicated.

References

    1. Alves-Cruzeiro JM, Nogales-Cadenas R, Pascual-Montano AD. CentrosomeDB: a new generation of the centrosomal proteins database for Human and Drosophila melanogaster. Nucleic acids research. 2014;42:D430–436. - PMC - PubMed
    1. Andersen JS, Wilkinson CJ, Mayor T, Mortensen P, Nigg EA, Mann M. Proteomic characterization of the human centrosome by protein correlation profiling. Nature. 2003;426:570–574. - PubMed
    1. Balczon R, Bao L, Zimmer WE, Brown K, Zinkowski RP, Brinkley BR. Dissociation of centrosome replication events from cycles of DNA synthesis and mitotic division in hydroxyurea-arrested Chinese hamster ovary cells. The Journal of cell biology. 1995;130:105–115. - PMC - PubMed
    1. Choi H, Larsen B, Lin ZY, Breitkreutz A, Mellacheruvu D, Fermin D, Qin ZS, Tyers M, Gingras AC, Nesvizhskii AI. SAINT: probabilistic scoring of affinity purification-mass spectrometry data. Nature methods. 2011;8:70–73. - PMC - PubMed
    1. Comartin D, Gupta GD, Fussner E, Coyaud E, Hasegan M, Archinti M, Cheung SW, Pinchev D, Lawo S, Raught B, et al. CEP120 and SPICE1 cooperate with CPAP in centriole elongation. Curr Biol. 2013;23:1360–1366. - PubMed

Publication types