. 2015 Dec 3;163(6):1539-54.
doi: 10.1016/j.cell.2015.11.008.

The African Turquoise Killifish Genome Provides Insights into Evolution and Genetic Architecture of Lifespan

Affiliations

The African Turquoise Killifish Genome Provides Insights into Evolution and Genetic Architecture of Lifespan

Dario Riccardo Valenzano et al. Cell. .

Abstract

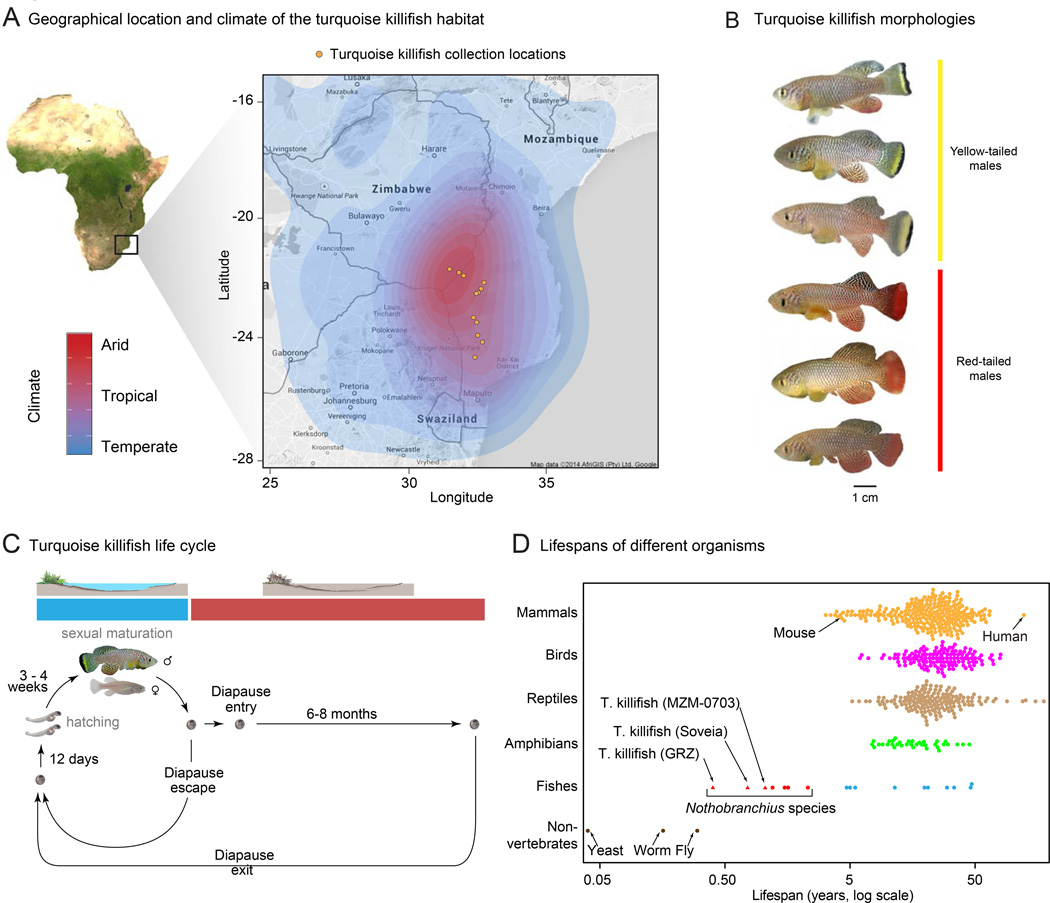
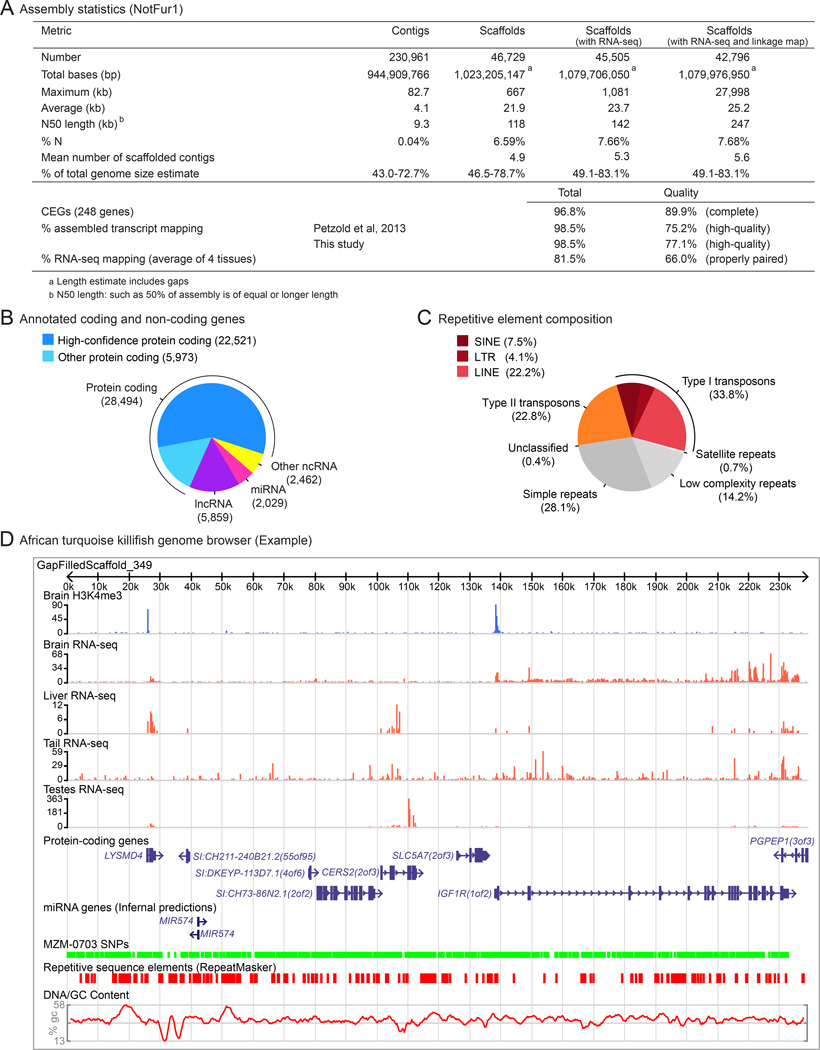
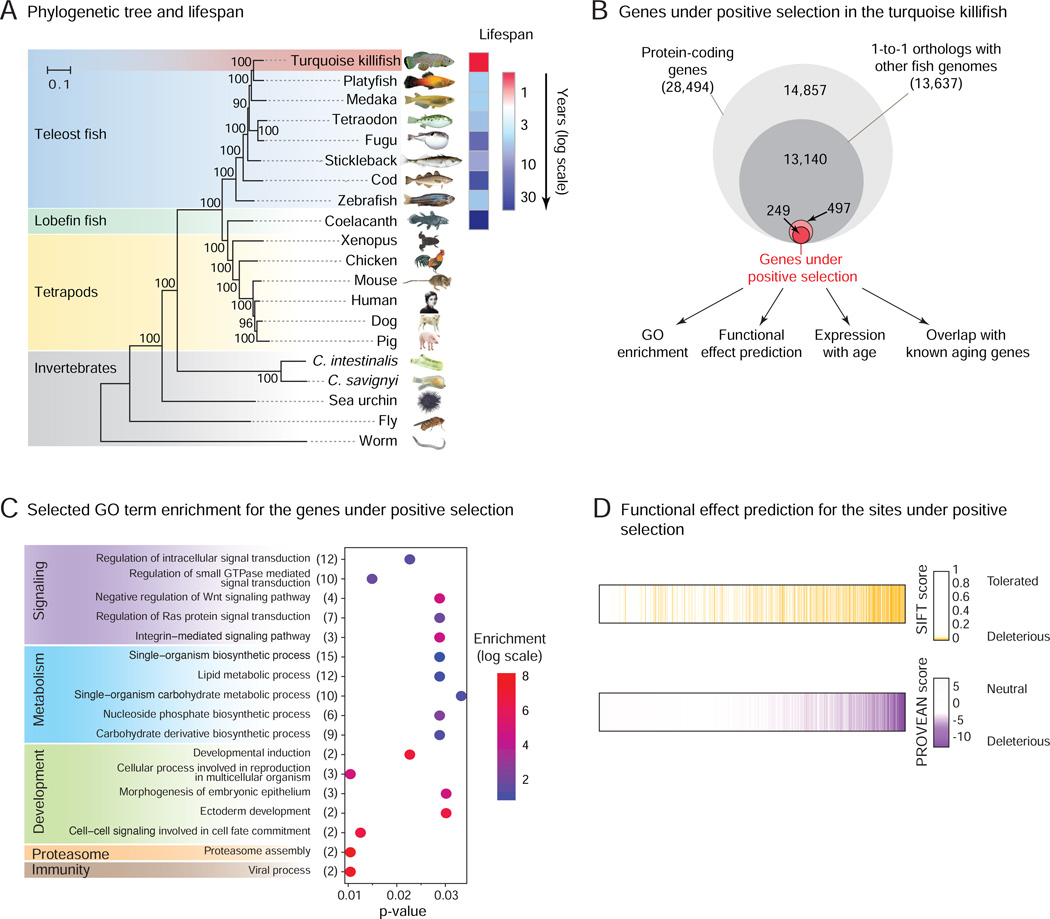
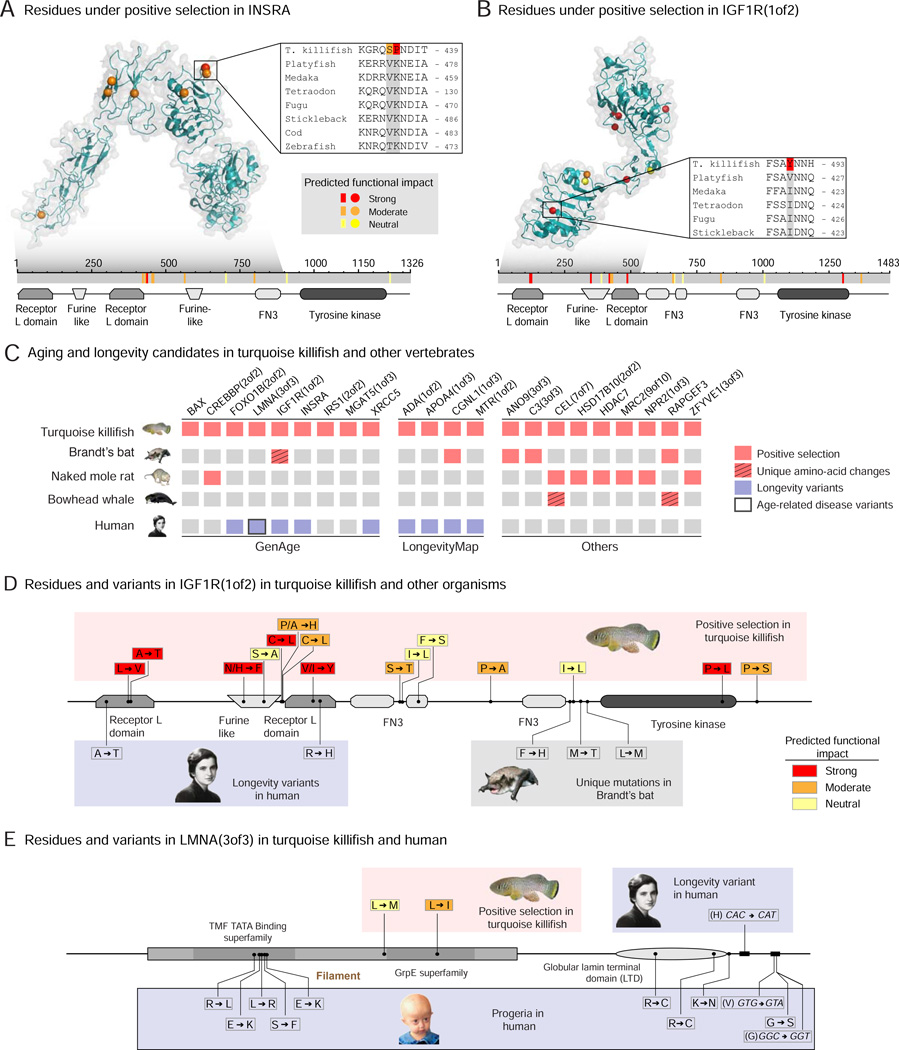
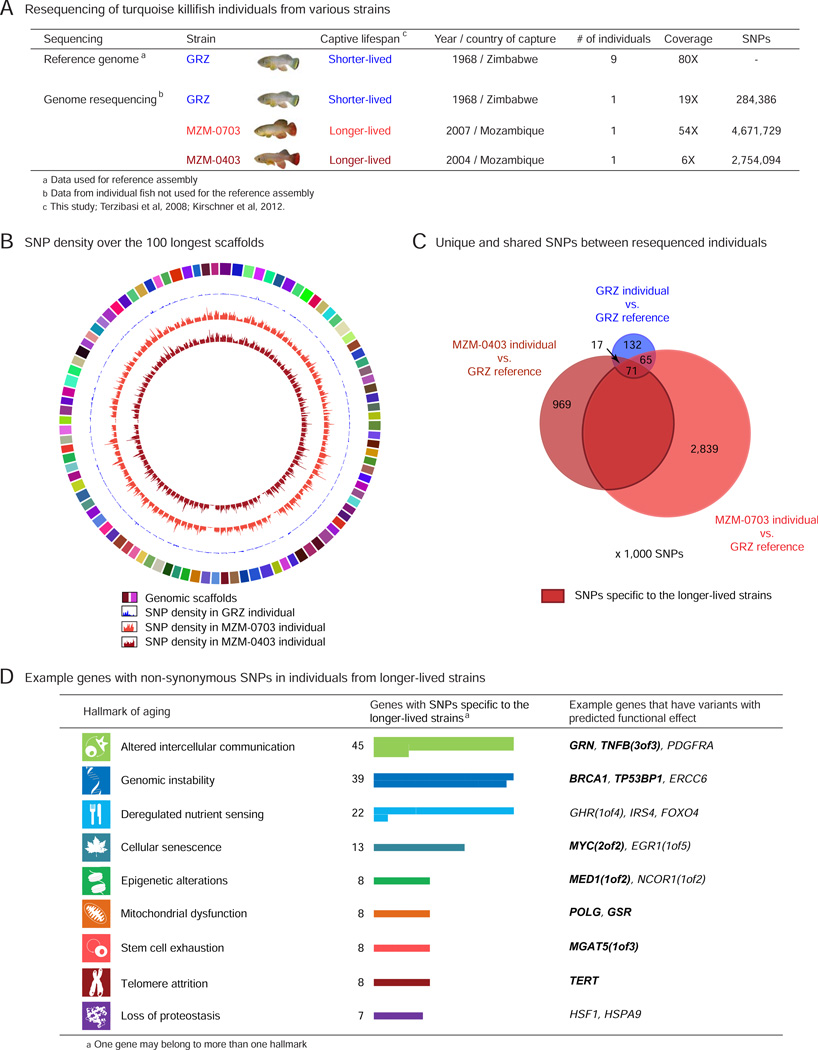
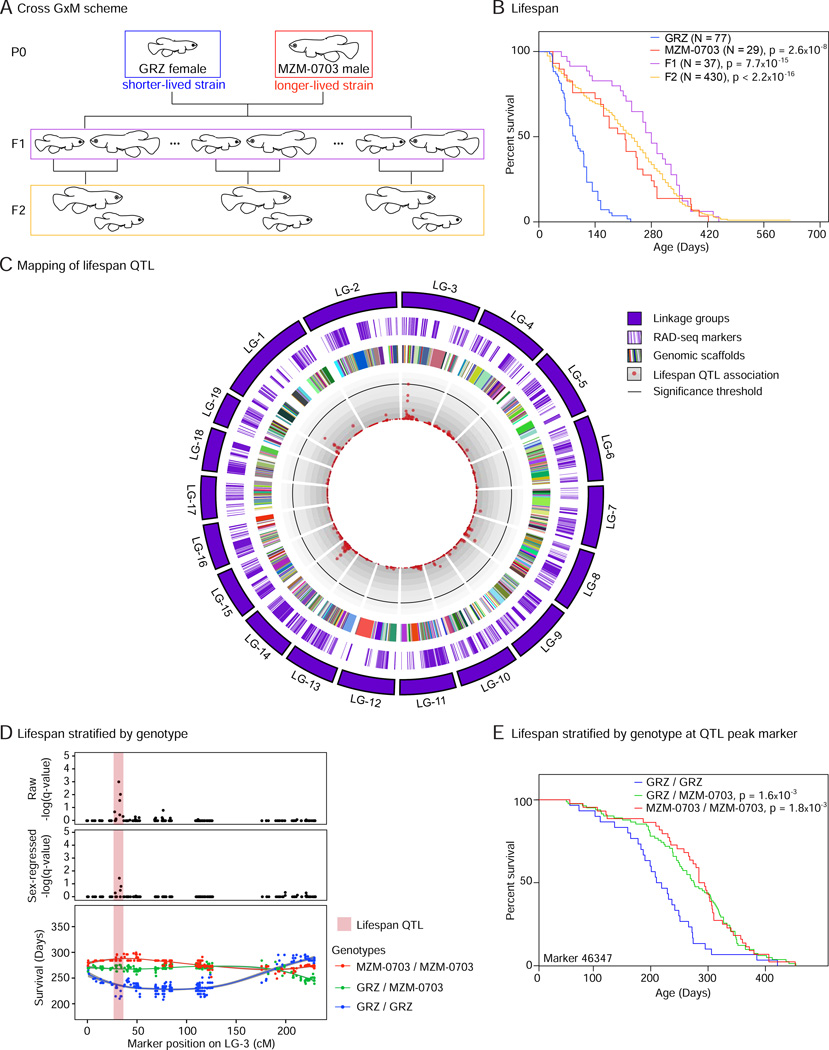
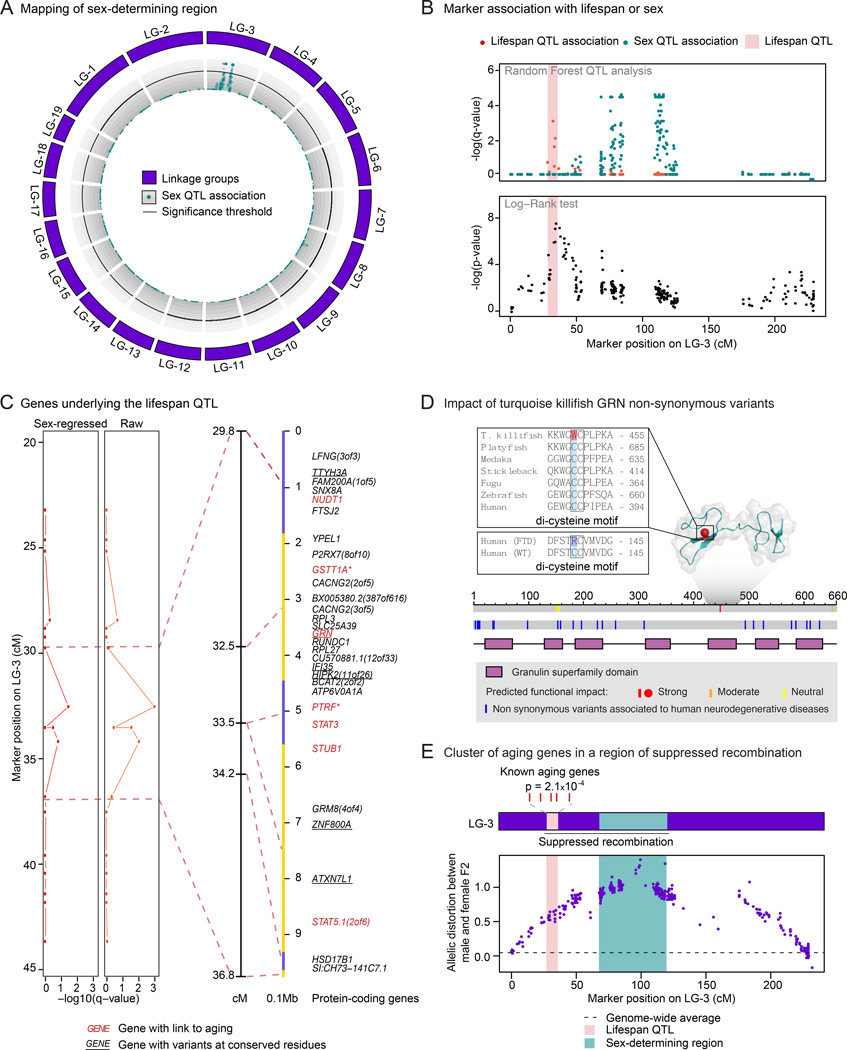
Lifespan is a remarkably diverse trait ranging from a few days to several hundred years in nature, but the mechanisms underlying the evolution of lifespan differences remain elusive. Here we de novo assemble a reference genome for the naturally short-lived African turquoise killifish, providing a unique resource for comparative and experimental genomics. The identification of genes under positive selection in this fish reveals potential candidates to explain its compressed lifespan. Several aging genes are under positive selection in this short-lived fish and long-lived species, raising the intriguing possibility that the same gene could underlie evolution of both compressed and extended lifespans. Comparative genomics and linkage analysis identify candidate genes associated with lifespan differences between various turquoise killifish strains. Remarkably, these genes are clustered on the sex chromosome, suggesting that short lifespan might have co-evolved with sex determination. Our study provides insights into the evolutionary forces that shape lifespan in nature.


Figures

Figure 1
Figure 1. The African turquoise killifish is a naturally short-lived vertebrate with multiple strains
A) Geographical distribution of turquoise killifish in the wild (orange dots). The climate of the area measured by the Koeppen-Geiger index (concentric contours). B) Examples of different morphological types in turquoise killifish males: yellow-tailed and red-tailed. C) Life cycle of the turquoise killifish. The turquoise killifish achieves sexual maturation and reproduces during the wet season. Diapausing embryos can survive through the dry season, when the ponds are desiccated. Diapause can be skipped in the laboratory, resulting in a short generation time. D) Nothobranchius species are among the shortest-lived vertebrates. Lifespan data for turquoise killifish strains are from our experimental data (age of the 10th percentile survivors) and are depicted by triangles. Lifespan of the strains can vary depending on housing conditions. Maximum lifespan data for the other organisms are from the AnAge database.
Figure 2
Figure 2. De novo sequencing and assembly of the reference genome of the African turquoise killifish
A) Assembly statistics for draft genome (NotFur1) for the reference turquoise killifish strain (GRZ). Scaffolds that are not captured by the linkage map remain unplaced. CEGs: core eukaryotic genes. See also Figures 6C, S1B, S1C. B) Number of annotated coding and non-coding genes in the reference turquoise killifish genome. High-confidence protein coding genes are genes with homologs in at least 10 species. lncRNA: long non-coding RNA; ncRNA: non-coding RNA; miRNA: microRNA. See also Figures S2E, S2F and Tables S1A,B. C) Repetitive element composition in the reference turquoise killifish genome. LINE: long interspersed nuclear element; SINE: short interspersed nuclear element; LTR: long terminal repeat. Type I transposons are RNA-mediated. Type II transposons are DNA-mediated. See also Tables S1C–E. D) Example of a genomic region containing insulin-like growth factor 1 receptor (IGF1RA).
Figure 3
Figure 3. Evolutionary analysis of the turquoise killifish genome
A) Phylogenetic tree of 20 animal species, including the turquoise killifish, based on 619 one-to-one orthologs (Table S2C). Number on nodes: level of confidence (% bootstrap support). Scale bar: evolutionary distance (substitution per site). Maximum lifespan data are from our experimental data (turquoise killifish) or from the AnAge database (other fish species), and represented as a heat map. B) Proportion and analysis of the genes under positive selection in the turquoise killifish compared to 7 other fish species after multiple hypothesis correction (FDR < 5%). See also Figure S3A. C) Selected GO term enrichment for the genes under positive selection in the turquoise killifish. The number of genes associated with each category is indicated in brackets after the term description, and enrichment values are indicated in colored scale. See also Table S3C. D) Predicted functional effect on the protein of residues under positive selection in the turquoise killifish have based on SIFT (top row) and PROVEAN (bottom row). Residues are ordered from left to right based on the rank-product of the SIFT and PROVEAN scores. Only sites scored by both methods are displayed. See also Figure S3B, Table S3D, and S4G.
Figure 4
Figure 4. Aging and longevity genes under positive selection in the turquoise killifish and with variants in long-lived species or in humans
A-B) Location of residues under positive selection and with putative functional consequences in insulin receptor A (INSRA) (A), IGF1R(1of2) (B) in the turquoise killifish. Top panels: crystal structure of human orthologs. Color represents the strength of functional impact. Grey shadow: region of the protein with available crystal structure. Insert: alignment of an example residue with strong functional effect in the turquoise killifish and other fish. Bottom panels: schematic of the residues mapped on the turquoise killifish protein sequence (grey). Colored bars: residues under positive selection with different functional impacts. The conserved protein domains and functional sites are also indicated. FN3: Fibronectin type-III repeats. (C) Aging and longevity candidates under positive selection in the short-lived turquoise killifish and their variation in long-lived animal species and in humans. Left: aging-related genes from the GenAge database (human and mouse combined, Table S4A). Middle: genes identified in association studies in humans from the LongevityMap database (Table S4A). Right: other genes that are also under positive selection or uniquely changed in other species with extreme longevity phenotype (naked mole rat, Brandt’s bat, bowhead whale). D) Location and variants of residues under positive selection in the turquoise killifish for IGF1R(1of2), and their location and variants in long-lived species and in human centenarians. Top: turquoise killifish variants, with the changed amino acid on the right. Color represents the strength of functional impact. Bottom: variants associated with centenarians in humans or residues with unique amino acid changes in long-lived Brandt’s bat mapped on the turquoise killifish sequence. The variants correspond to the amino acids on the right. E) Location and variants of residues under positive selection in the turquoise killifish for LMNA(3of3), and their location and variants in progeria and human centenarians. Top left: turquoise killifish variants, with the changed amino acid on the right. Top right: variants associated with centenarians in humans mapped onto the turquoise killifish sequence. Bottom: Variants in Hutchinson-Gilford Progeria Syndrome mapped onto the turquoise killifish sequence. These variants are the amino acids on the right. For the turquoise killifish, color represents the strength of functional impact.
Figure 5
Figure 5. Genetic variation in individuals from different strains of the turquoise killifish
A) Resequencing of individuals from different turquoise killifish strains (GRZ, MZM-0703, MZM-0403) with different reported lifespans in specific laboratory environments. SNPs: Single Nucleotide Polymorphisms. B) Circos plot of the 100 longest scaffolds showing SNP density in resequenced individuals from different turquoise killifish strains (GRZ, MZM-0703, MZM-0403) versus the reference GRZ assembly. C) Unique and shared SNPs between resequenced individuals from reported shorter-lived (GRZ) or longer-lived strains (MZM-0703 and MZM-0403) versus the reference GRZ assembly. Values in the Venn diagram should be multiplied by 1000 and are rounded for concision. D) Non-synonymous SNPs specific to individuals from the longer-lived strains (MZM-0403 and MZM-0703) in genes encompassing the hallmarks of aging. Aging-related genes were obtained from the GenAge database (human and mouse combined, Table S4A). All presented aging-related genes had at least one variant with predicted functional effect by both SIFT and PROVEAN (bolded genes) or by SIFT or PROVEAN (non bolded genes) (see also Table S5B).
Figure 6
Figure 6. Genetic architecture of lifespan using a cross between shorter-lived and longer-lived strains of the turquoise killifish
A) Scheme of cross GxM. A female from the shorter-lived GRZ strain was crossed with a male from the longer-lived MZM-0703 strain (P0) to generate F1 progeny. F1 individuals were mated to generate F2 progeny. B) Lifespan of the parental strains, F1, and F2 progeny of cross GxM in the captive conditions used in this study (pooled males and females). p-values for differential survival compared to GRZ individuals in Log-Rank tests are indicated. See Table S6A for complete statistics. C) Circos plot representing the linkage map of cross GxM and association of markers with lifespan by quantitative trait locus (QTL) analysis. The linkage map is composed of 19 linkage groups (LG). The association of each RAD-seq marker with differences in lifespan is represented as –log10 of the Random Forest Analysis q-value (red dots). The 5% FDR significance threshold is denoted by a black line. There is one marker above this threshold in LG-3 (lifespan QTL). Genomic scaffold length is scaled to genetic distance (cM) and not physical distance (bp). D) The lifespan QTL is non-transgressive. Upper panel: Raw −log10 (Random Forest Analysis q-value) for association of markers to individual fish lifespan. Middle panel: −log10 of the Random Forest Analysis q-values for association of markers to lifespan after sex regression to account for the possible effect of sex as a confounding variable. Bottom panel: Survival stratified by genotype associated with each marker on LG-3. Homozygotes with alleles coming from the long-lived MZM-0703 grandparent (red) exhibit highest survival at the ~35cM position on LG-3, whereas homozygotes with alleles coming from the short-lived GRZ grandparent (blue) exhibit lowest survival. Light red rectangle: lifespan QTL region. E) Lifespan of fish with different genotypes at the marker that is most significantly associated to the lifespan QTL (RAD-seq marker 46347). p-values for differential survival compared to individuals with the GRZ/GRZ genotype in Log-Rank tests are indicated. See also Table S6B for complete statistics.
Figure 7
Figure 7. The lifespan QTL is linked to the sex-determining region and contains a cluster of aging genes
A) Circos plot representing the association of markers with sex by QTL analysis in cross GxM. The association of each RAD-seq marker with sex is represented as −log10 of the Random Forest Analysis q-value (turquoise dots). The 5% FDR significance threshold is denoted by a black line. There is a cluster of markers above this threshold in LG-3 (sex-determining region). B) The lifespan QTL is distinct from the sex-determining region. Upper panel: Random Forest analysis for marker association with lifespan (red) or sex (turquoise). Lower panel: Log-Rank survival analysis in the F2 generation of cross GxM between homozygotes with alleles coming from GRZ grandparent vs. the MZM-0703 grandparent at each marker. Light red rectangle: Lifespan QTL region. C) Identification of the genes underlying the lifespan QTL on LG-3. Left panels: Sex-regressed or raw −log10 of the Random Forest Analysis q-value for association with lifespan. Dashed lines delimit the lifespan QTL. Right panels: lifespan QTL region on LG3 and corresponding anchored genomic scaffolds in alternating yellow and slate blue colors. Markers are linked to the mid-points of the scaffolds. Genes in red have been previously linked to aging in the GenAge database (human and mouse combined, Table S4A) or manually curated from the literature (asterisks, Table S7A). Underlined genes have non-synonymous variants at evolutionary-conserved residues. See also Figure S7B–S7G. D) Location of residues with putative functional consequences and associated to human neurodegenerative diseases on GRN in the turquoise killifish. Color represents the strength of functional impact. Top panel: NMR structure of human orthologous domain. Grey shadow: GRN domain with available NMR structure. Top insert: alignment of the residue with strong functional effect W449 in the turquoise killifish with other species (see also Figure S7D and Table S7H). Bottom insert: region surrounding a mutation found in human frontotemporal dementia (FTD) patients, involving an analogous di-cysteine motif residue. Bottom panel: schematic of the residues mapped on the turquoise killifish protein sequence (grey). E) Cluster of known aging genes in the lifespan QTL region, in a region of suppressed recombination. Top panel: schematic of the enrichment for known aging-related genes (from GeneAge, human and mouse combined) in the lifespan QTL region (p = 2.1x10⁻⁴, in Fisher’s exact test, compared to rest of the genome, p = 6.4x10⁻⁴ in Fisher’s exact test, compared to the rest of LG-3). Bottom panel: measure of suppressed recombination by allelic distortion between the male and female F2 progeny at each marker on LG-3. See also Figure S7H–S7I. Dash line indicates the genome-wide average for allelic distortion. Light red rectangle: lifespan QTL region. Turquoise rectangle: sex-determining region.

Comment in

References

    1. Ahmed Z, Sheng H, Xu YF, Lin WL, Innes AE, Gass J, Yu X, Wuertzer CA, Hou H, Chiba S, et al. Accelerated lipofuscinosis and ubiquitination in granulin knockout mice suggest a role for progranulin in successful aging. Am. J. Pathol. 2010;177:311–324. - PMC - PubMed
    1. Austad SN. Methusaleh’s Zoo: how nature provides us with clues for extending human health span. J. Comp. Pathol. 2010;142(Suppl 1):S10–S21. - PMC - PubMed
    1. Ayyadevara S, Dandapat A, Singh SP, Siegel ER, Shmookler Reis RJ, Zimniak L, Zimniak P. Life span and stress resistance of Caenorhabditis elegans are differentially affected by glutathione transferases metabolizing 4-hydroxynon-2-enal. Mech. Ageing Dev. 2007;128:196–205. - PMC - PubMed
    1. Baker M, Mackenzie IR, Pickering-Brown SM, Gass J, Rademakers R, Lindholm C, Snowden J, Adamson J, Sadovnick AD, Rollinson S, et al. Mutations in progranulin cause tau-negative frontotemporal dementia linked to chromosome 17. Nature. 2006;442:916–919. - PubMed
    1. Ballew BJ, Yeager M, Jacobs K, Giri N, Boland J, Burdett L, Alter BP, Savage SA. Germline mutations of regulator of telomere elongation helicase 1, RTEL1, in Dyskeratosis congenita. Hum. Genet. 2013;132:473–480. - PMC - PubMed

Publication types

LinkOut - more resources