. 2015 Dec 7:6:8866.
doi: 10.1038/ncomms9866.

Whole-genome sequencing reveals activation-induced cytidine deaminase signatures during indolent chronic lymphocytic leukaemia evolution

Affiliations

Whole-genome sequencing reveals activation-induced cytidine deaminase signatures during indolent chronic lymphocytic leukaemia evolution

S Kasar et al. Nat Commun. .

Abstract

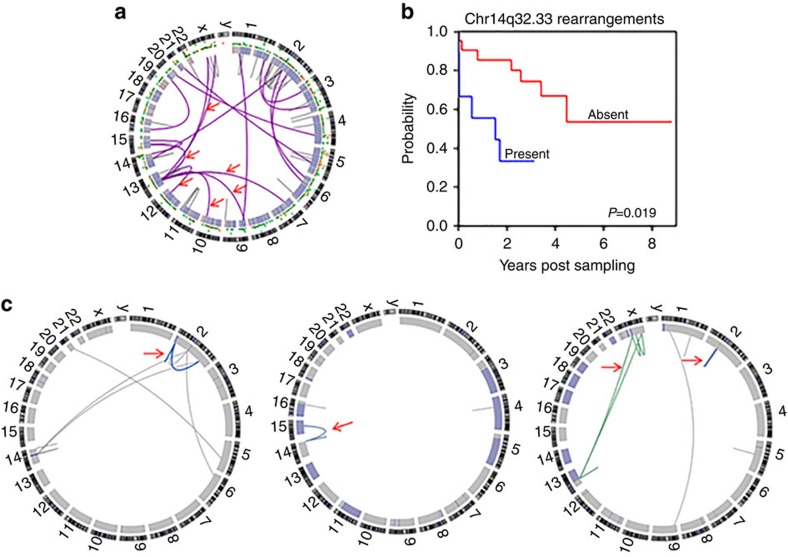
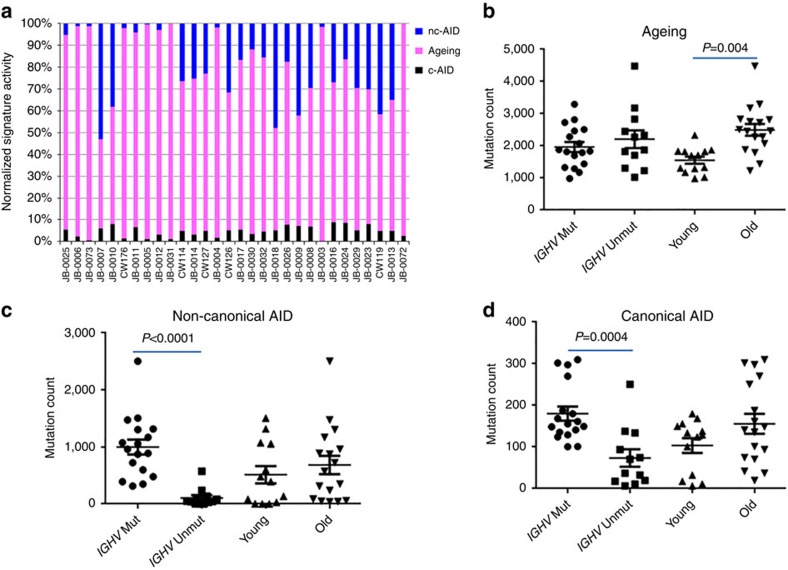
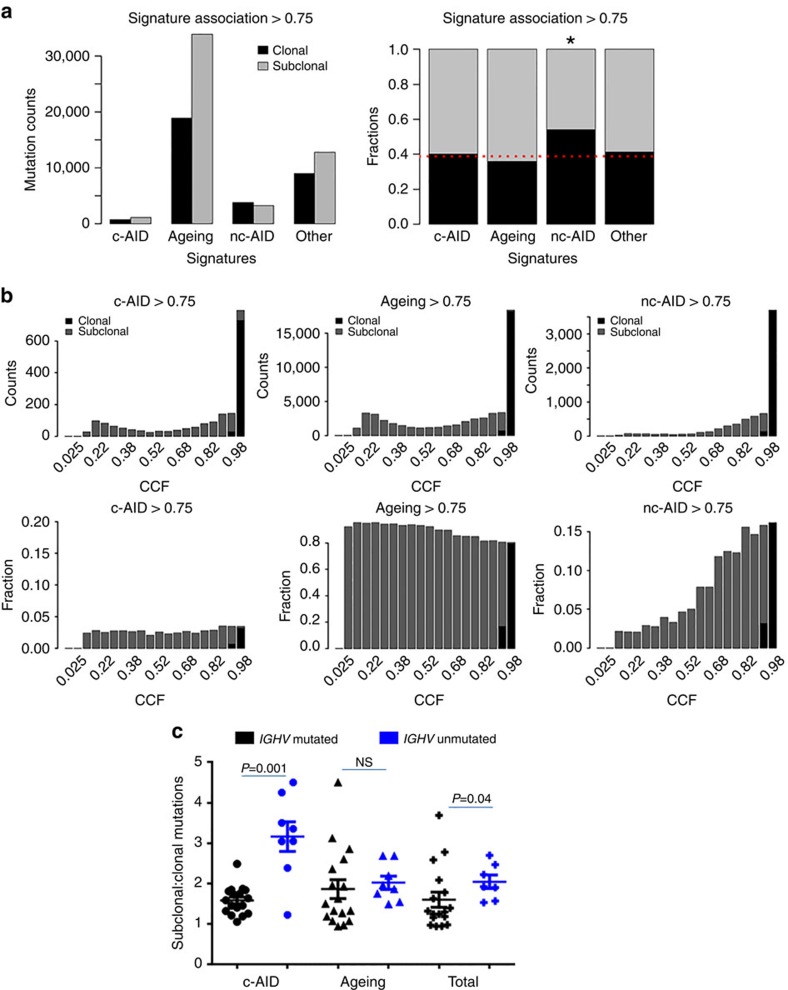
Patients with chromosome 13q deletion or normal cytogenetics represent the majority of chronic lymphocytic leukaemia (CLL) cases, yet have relatively few driver mutations. To better understand their genomic landscape, here we perform whole-genome sequencing on a cohort of patients enriched with these cytogenetic characteristics. Mutations in known CLL drivers are seen in only 33% of this cohort, and associated with normal cytogenetics and unmutated IGHV. The most commonly mutated gene in our cohort, IGLL5, shows a mutational pattern suggestive of activation-induced cytidine deaminase (AID) activity. Unsupervised analysis of mutational signatures demonstrates the activities of canonical AID (c-AID), leading to clustered mutations near active transcriptional start sites; non-canonical AID (nc-AID), leading to genome-wide non-clustered mutations, and an ageing signature responsible for most mutations. Using mutation clonality to infer time of onset, we find that while ageing and c-AID activities are ongoing, nc-AID-associated mutations likely occur earlier in tumour evolution.


Figures

Figure 1
Figure 1. Summary of structural rearrangements.
(a) Circos plot representing the structural rearrangements observed across 30 CLL genomes. Purple lines indicate inter-chromosomal rearrangements, grey lines indicate intra-chromosomal rearrangements; red arrows point to inter-chromosomal rearrangements giving rise to 13q deletion. (b) Kaplan–Meier curve showing the relationship between time to next treatment post sampling and rearrangements in Chr14q32.33 (5′IGH) in the vicinity of KIAA0125. (c) Circos plots depicting the presence of chained rearrangements detected by the ChainFinder algorithm. Red arrows indicate deletion bridges and inter-dependent chains. Left—1 chain near LPIN1, TRIB2 and TMEM194B genes on chr2; middle–1 chain near KIAA0125 on chr14 and ANP32A on chr15; right—chain 1 (blue) near SNAR-H, REG3G and CTNNA2 on chr2 and chain 2 (green) near ARMCX6, SAGE1, ZCCHC5 and ITM2A on chr23 and CYSLTR2, EBPL, RNASEH2B and KPNA3 on chr13. The genes listed here either fall within a deletion or are within 25kb of a chained rearrangement breakpoint.
Figure 2
Figure 2. Overview of somatic mutational landscape.
(a) Pie chart depicting the percentage of different types of sSNVs detected in our cohort genome-wide. (b) Bar chart of average mutation densities across different regions of the genome. n=30, error bars indicate ±s.e.m. (c) Dot plot of age at diagnosis in the older versus younger cohort. The horizontal line indicates median age. (d) Dot plot of time from diagnosis to sampling in the older versus younger cohort. (e) Bar chart comparing the mutation rate per MB genome-wide (total) and in coding regions in the entire cohort and in younger (n=13) versus older (n=17) patients. (f,g) Dot plot of average number of clonal and subclonal mutations total (f) and in coding regions (g) in younger versus older subgroups is shown. Error bars indicate ±s.e.m., P values were calculated using the Mann–Whitney U-test. NS, not significant (i.e. P>0.05).
Figure 3
Figure 3. Distribution of mutations in selected genes.
(a) Heatmap showing the presence of non-synonymous mutations in genes specified on the right. In the heatmap, white box = one event, black box=two events and gray=no events. The genes are classified based on potential functional significance as shown in the rightmost column. The top panel shows the clinical characteristics of each sample. The bar chart on the left indicates the percentage of cases with at least one mutation in the gene on the right. The bottom four rows in the heatmap represent the presence of mutations in IGLL5, rearrangement events and copy number alterations. The black box highlights samples with mutations in known CLL driver genes; the blue box highlights cases with no mutations in known cancer-associated genes. (b) Graphical representation of 5′UTR and coding mutations in the IGLL5 transcript. ***indicates mutations concentrated in the first intron. (c) Graphical representation of IGLL5-coding mutation alterations at the protein level.
Figure 4
Figure 4. Analysis of mutational signature in CLL.
(a) Frequency histogram of nearest mutation distance (NMD) shows bimodal distribution. (b) Estimated mutation contributions of the indicated mutational signatures detected upon inclusion of NMD as a factor in Bayesian NMF. (c) Number of clustered mutations (left) and non-clustered mutations (right) associated with canonical AID (green), ageing (blue) and non-canonical AID (purple) signature across samples. * Indicates cases with mutated IGHV.
Figure 5
Figure 5. Association of signatures with clinical characteristics.
(a) Percentage contribution of each of the mutational signatures to the overall mutation spectrum across samples. (bd) Dot plots showing total mutation counts associated with the indicated signatures in relation to age at diagnosis (younger versus older) and IGHV mutation status (mut versus unmut). Error bars indicate±s.e.m. P values were calculated using the Wilcoxon's Rank Sum Test.
Figure 6
Figure 6. c-AID mutations exhibit classical features of SHM.
(a) Ratio of mutation frequency within 2 kb of transcription start site (TSS) to the genome-wide mutation rate for each signature. (b) Genes were divided into four quartiles, Q1 through Q4, in order of increasing expression. Bar graph showing normalized mutation density of each signature per quartile.
Figure 7
Figure 7. Chronological order of mutational processes.
(a) Bar graph showing absolute number (left) and ratio (right) of clonal and subclonal mutations in the indicated categories (pms>0.75). ‘Other' includes mutations that were not assigned to any of the three signatures. *P<0.000001, P value was calculated using the Chi-square Test. (b) Distribution of CCF of mutations assigned to each signature; total number (top) and the fraction (bottom) of mutations for given CCF. (c) Ratio of subclonal:clonal mutations among mutations associated with either c-AID or ageing, compared with total mutations, shown divided by IGHV status. Note that pms>0.5 is shown here (P=0.001) since pms>0.75 had a low overall n, but a similar trend was observed with pms>0.75, P=0.055. We only considered cases with at least five c-AID-associated mutations, resulting in N(IGHV mut)=17 and N(IGHV unmut)=8 for pms>0.5. NS, not significant. (i.e. P<0.05). Error bars indicate±s.e.m. P values were calculated using the Mann Whitney U Test.

References

    1. Hallek M. et al. Guidelines for the diagnosis and treatment of chronic lymphocytic leukemia: a report from the International Workshop on Chronic Lymphocytic Leukemia updating the National Cancer Institute–Working Group 1996 guidelines. Blood 111, 5446–5456 (2008). - PMC - PubMed
    1. Dohner H. et al. Genomic aberrations and survival in chronic lymphocytic leukemia. N. Engl. J. Med. 343, 1910–1916 (2000). - PubMed
    1. Puente X. S. et al. Whole-genome sequencing identifies recurrent mutations in chronic lymphocytic leukaemia. Nature 475, 101–105 (2011). - PMC - PubMed
    1. Alexandrov L. B. et al. Signatures of mutational processes in human cancer. Nature 500, 415–421 (2013). - PMC - PubMed
    1. Tan V. Y. & Fevotte C. Automatic relevance determination in nonnegative matrix factorization with the beta-divergence. IEEE Trans. Pattern Anal. Mach. Intell. 35, 1592–1605 (2013). - PubMed

Publication types

MeSH terms

Substances