Comparative Study
. 2015 Dec 7:5:17898.
doi: 10.1038/srep17898.

mRNA Levels of Imprinted Genes in Bovine In Vivo Oocytes, Embryos and Cross Species Comparisons with Humans, Mice and Pigs

Affiliations
Comparative Study

mRNA Levels of Imprinted Genes in Bovine In Vivo Oocytes, Embryos and Cross Species Comparisons with Humans, Mice and Pigs

Zongliang Jiang et al. Sci Rep. .

Abstract

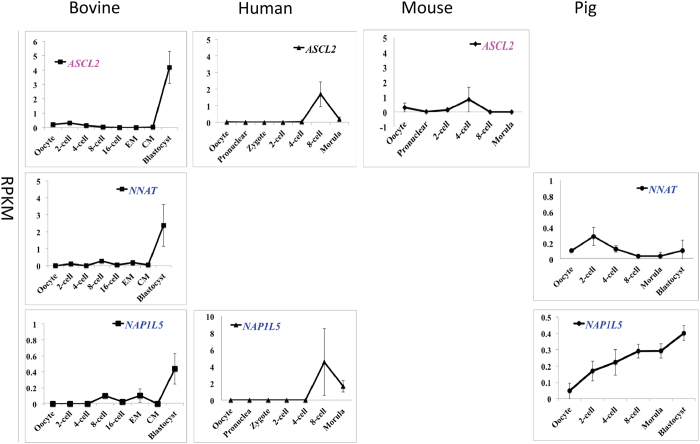
Twenty-six imprinted genes were quantified in bovine in vivo produced oocytes and embryos using RNA-seq. Eighteen were detectable and their transcriptional patterns were: largely decreased (MEST and PLAGL1); first decreased and then increased (CDKN1C and IGF2R); peaked at a specific stage (PHLDA2, SGCE, PEG10, PEG3, GNAS, MEG3, DGAT1, ASCL2, NNAT, and NAP1L5); or constantly low (DIRAS3, IGF2, H19 and RTL1). These patterns reflect mRNAs that are primarily degraded, important at a specific stage, or only required at low quantities. The mRNAs for several genes were surprisingly abundant. For instance, transcripts for the maternally imprinted MEST and PLAGL1, were high in oocytes and could only be expressed from the maternal allele suggesting that their genomic imprints were not yet established/recognized. Although the mRNAs detected here were likely biallelically transcribed before the establishment of imprinted expression, the levels of mRNA during these critical stages of development have important functional consequences. Lastly, we compared these genes to their counterparts in mice, humans and pigs. Apart from previously known differences in the imprinting status, the mRNA levels were different among these four species. The data presented here provide a solid reference for expression profiles of imprinted genes in embryos produced using assisted reproductive biotechnologies.


Figures

Figure 1
Figure 1. Levels of transcriptional expression of bovine imprinted genes that continuously decreased during pre-implantation development (mean ± SEM).
Paternally expressed genes are labeled in blue.
Figure 2
Figure 2. Transcriptional expression of bovine imprinted genes that were decreased first and then increased during bovine pre-implantation development (mean + SEM).
Maternally expressed genes are labeled in pink and genes that are not imprinted in a particular species are labeled in black. The lack of a graph indicates that the gene was not detected in that species.
Figure 3
Figure 3
Transcriptional expression of bovine imprinted genes that increased first and then decreased at the 2- or 4-cell stage (a), or at the 8-cell stage (a) (mean ± SEM). Maternally and paternally expressed genes are labeled in pink and blue, respectively. Genes that are not imprinted in a particular species are labeled in black. The lack of a graph indicates that the gene was not detected in that species.
Figure 4
Figure 4. Transcriptional expression of bovine imprinted genes that maintained relatively low expression and then peaked at blastocysts to high levels (mean ± SEM).
Maternally and paternally expressed genes are labeled in pink and blue, respectively. Genes that are not imprinted in a particular species are labeled in black. The lack of a graph indicates that the gene was not detected in that species.
Figure 5
Figure 5. Transcriptional expression of bovine imprinted genes that maintained relatively low expression and then peaked at blastocysts to low levels (mean ± SEM).
Maternally and paternally expressed genes are labeled in pink and blue, respectively. Genes that are not imprinted in a particular species are labeled in black. The lack of a graph indicates that the gene was not detected in that species.
Figure 6
Figure 6. Transcriptional expression of imprinted genes that maintained low expression during pre-implantation development (mean ± SEM).
Maternally and paternally expressed genes are labeled in pink and blue, respectively. Genes that are not imprinted in a particular species are labeled in black. The lack of a graph indicates that the gene was not detected in that species.

References

    1. Ferguson-Smith A. C. Genomic imprinting: the emergence of an epigenetic paradigm. Nature reviews. Genetics 12, 565–575, doi: 10.1038/nrg3032 (2011). - DOI - PubMed
    1. Lawson H. A., Cheverud J. M. & Wolf J. B. Genomic imprinting and parent-of-origin effects on complex traits. Nature reviews. Genetics 14, 609–617, doi: 10.1038/nrg3543 (2013). - DOI - PMC - PubMed
    1. O’Doherty A. M., MacHugh D. E., Spillane C. & Magee D. A. Genomic imprinting effects on complex traits in domesticated animal species. doi: D - NLM: PMC4408863 OTO - NOTNLM. - PMC - PubMed
    1. Chen Z. et al. Characterization of global loss of imprinting in fetal overgrowth syndrome induced by assisted reproduction. Proceedings of the National Academy of Sciences of the United States of America 112, 4618–4623, doi: 10.1073/pnas.1422088112 (2015). - DOI - PMC - PubMed
    1. Bischoff S. R. et al. Characterization of conserved and nonconserved imprinted genes in swine. Biology of reproduction 81, 906–920, doi: 10.1095/biolreprod.109.078139 (2009). - DOI - PMC - PubMed

Publication types

LinkOut - more resources