. 2015 Dec 7:5:15926.
doi: 10.1038/srep15926.

Ceramides And Stress Signalling Intersect With Autophagic Defects In Neurodegenerative Drosophila blue cheese (bchs) Mutants

Affiliations

Ceramides And Stress Signalling Intersect With Autophagic Defects In Neurodegenerative Drosophila blue cheese (bchs) Mutants

Sarita Hebbar et al. Sci Rep. .

Abstract

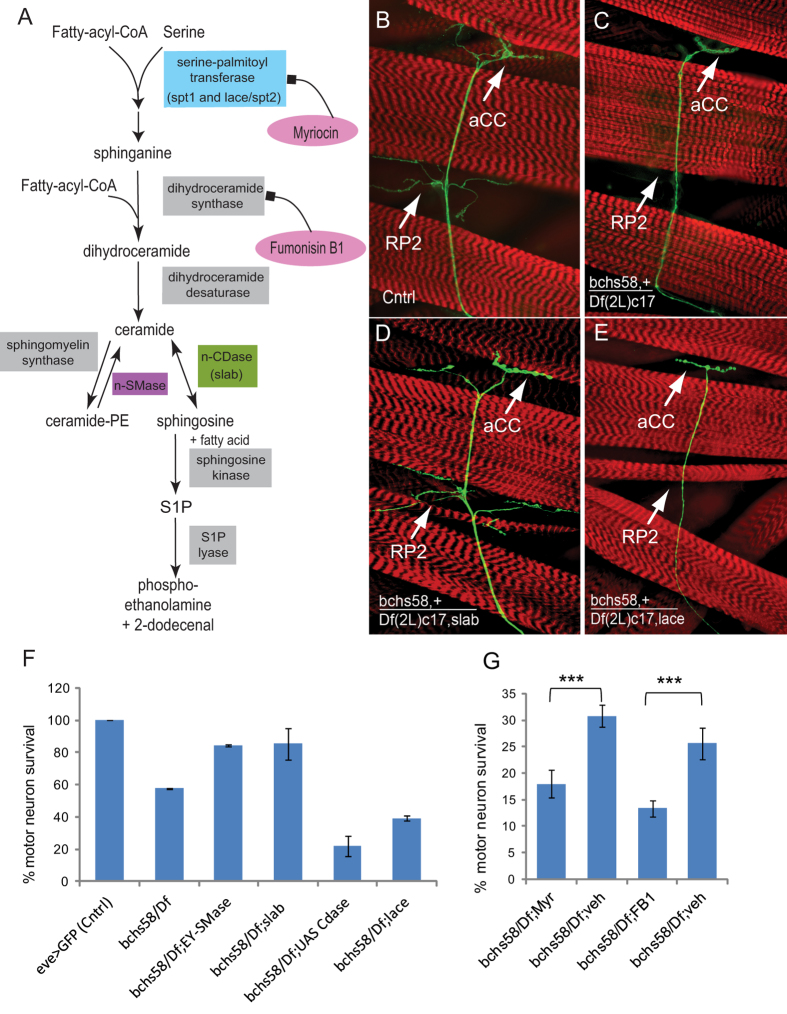
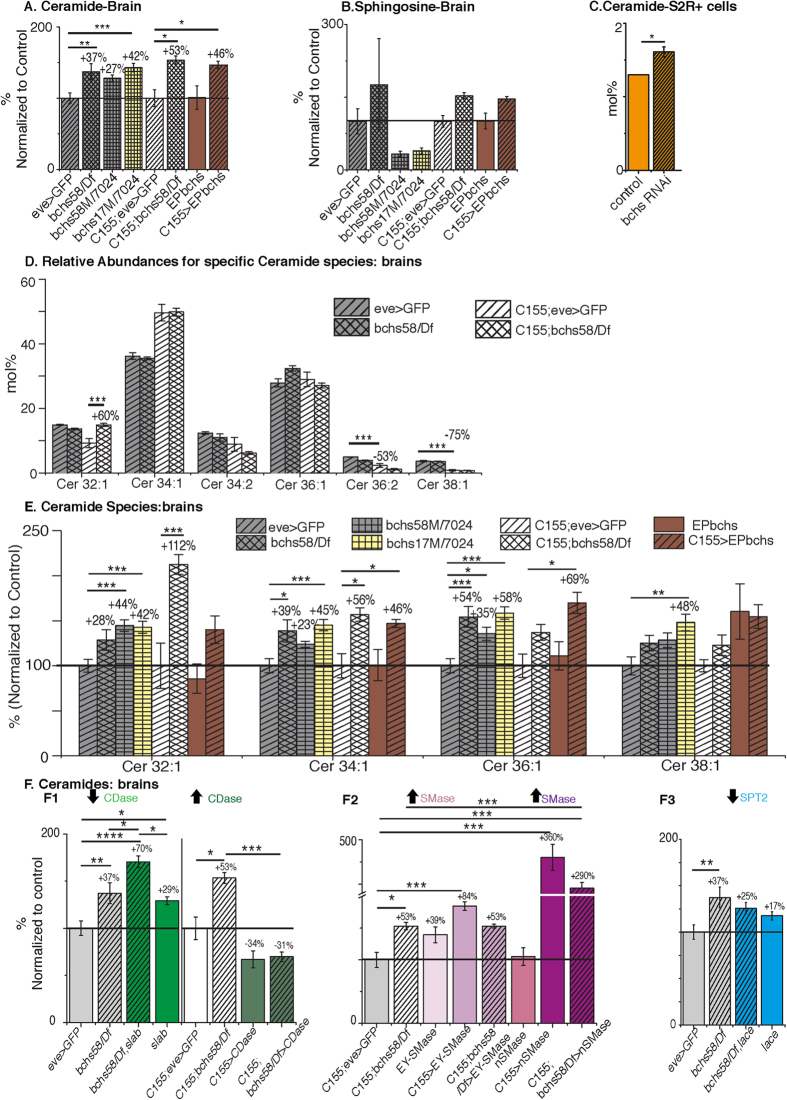
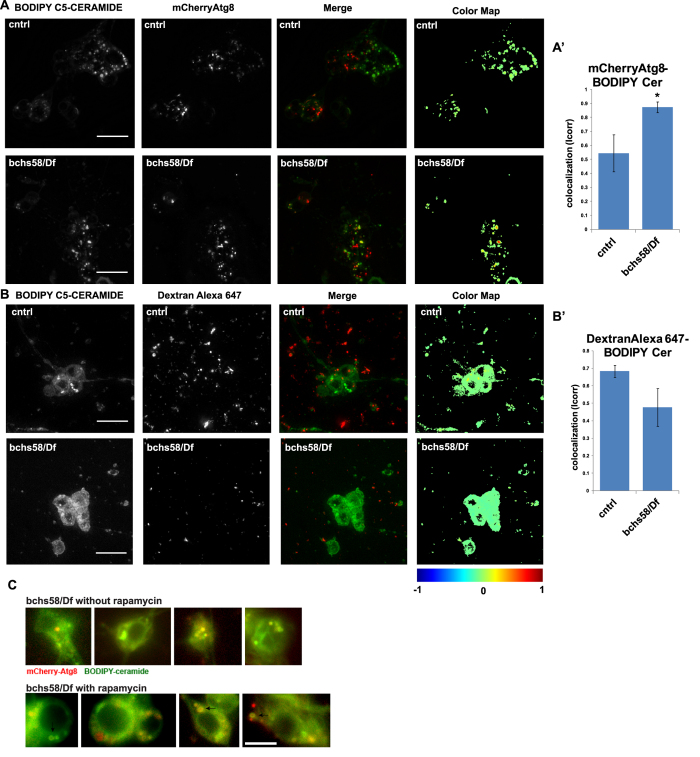
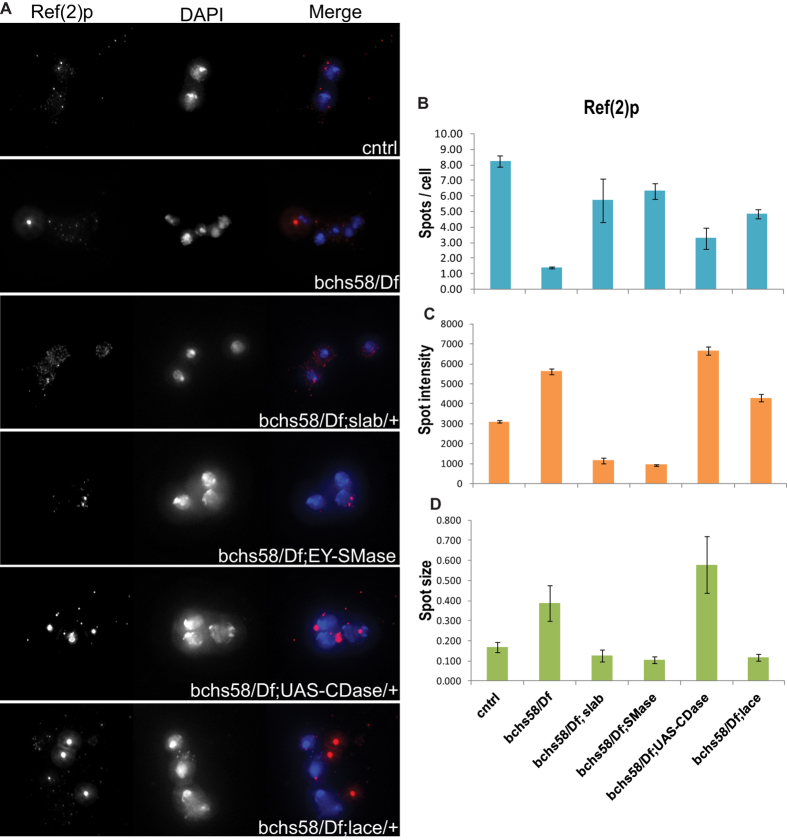
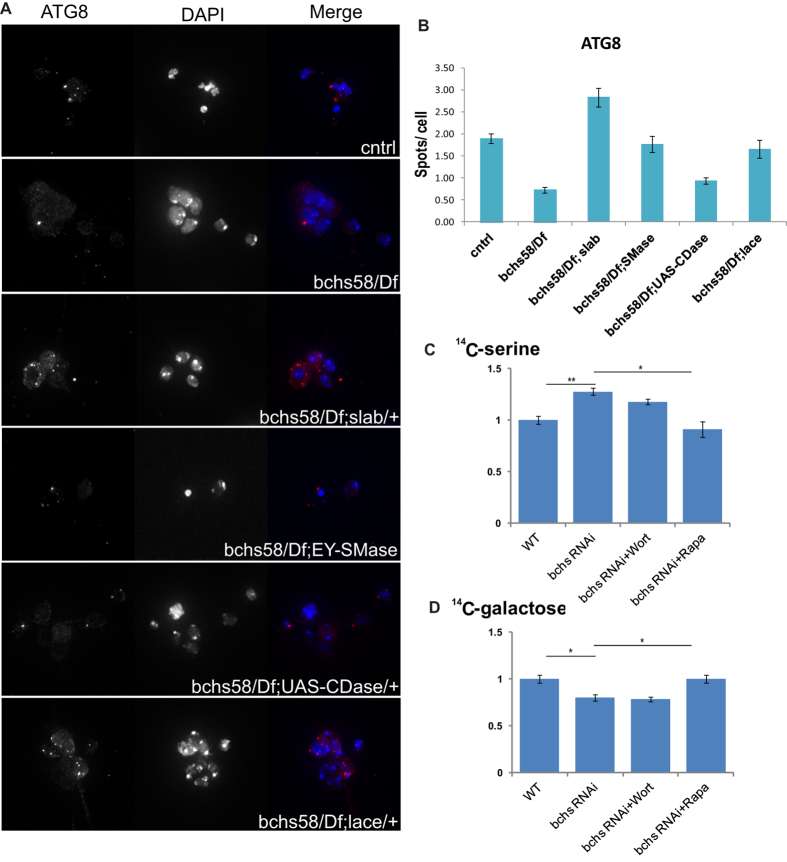
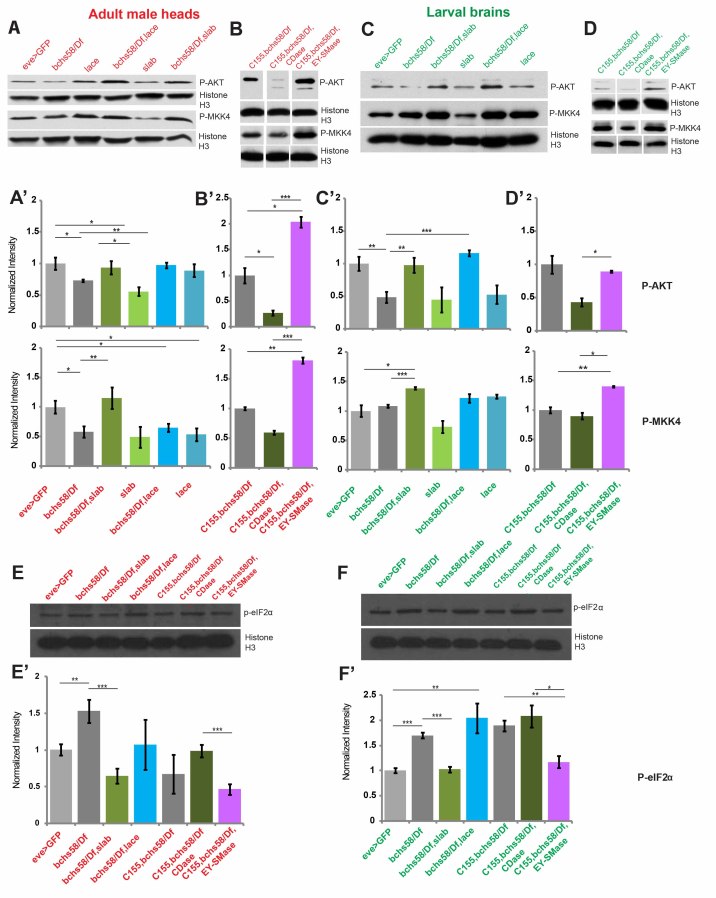
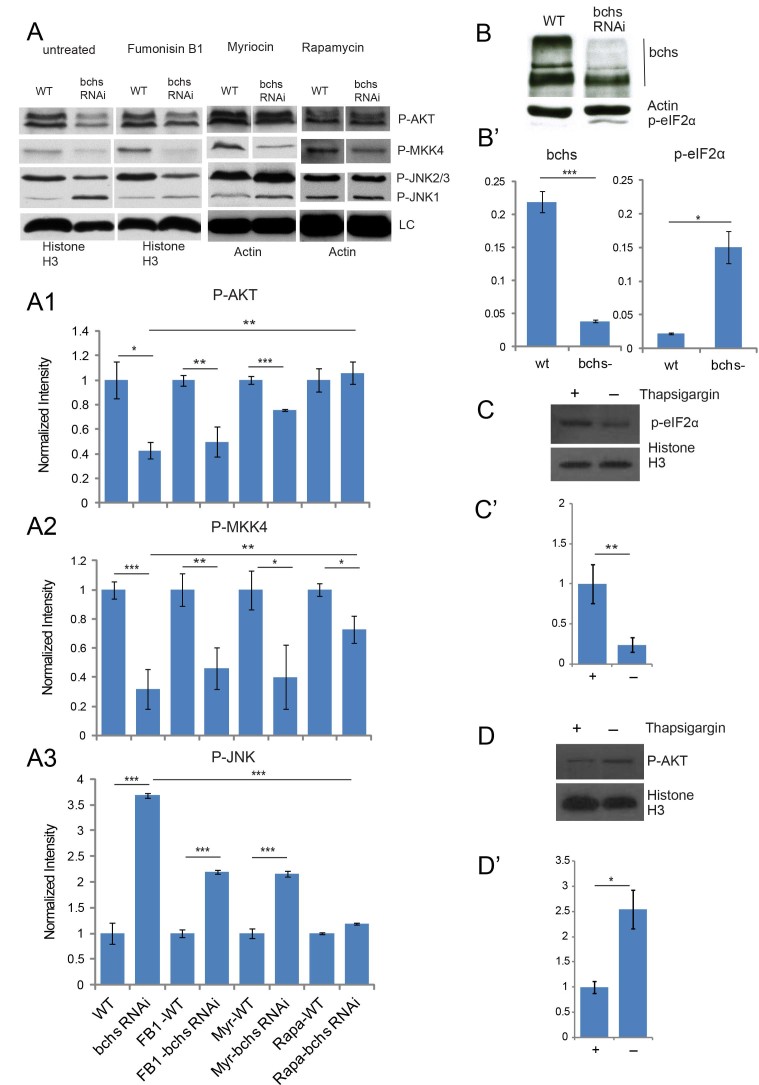
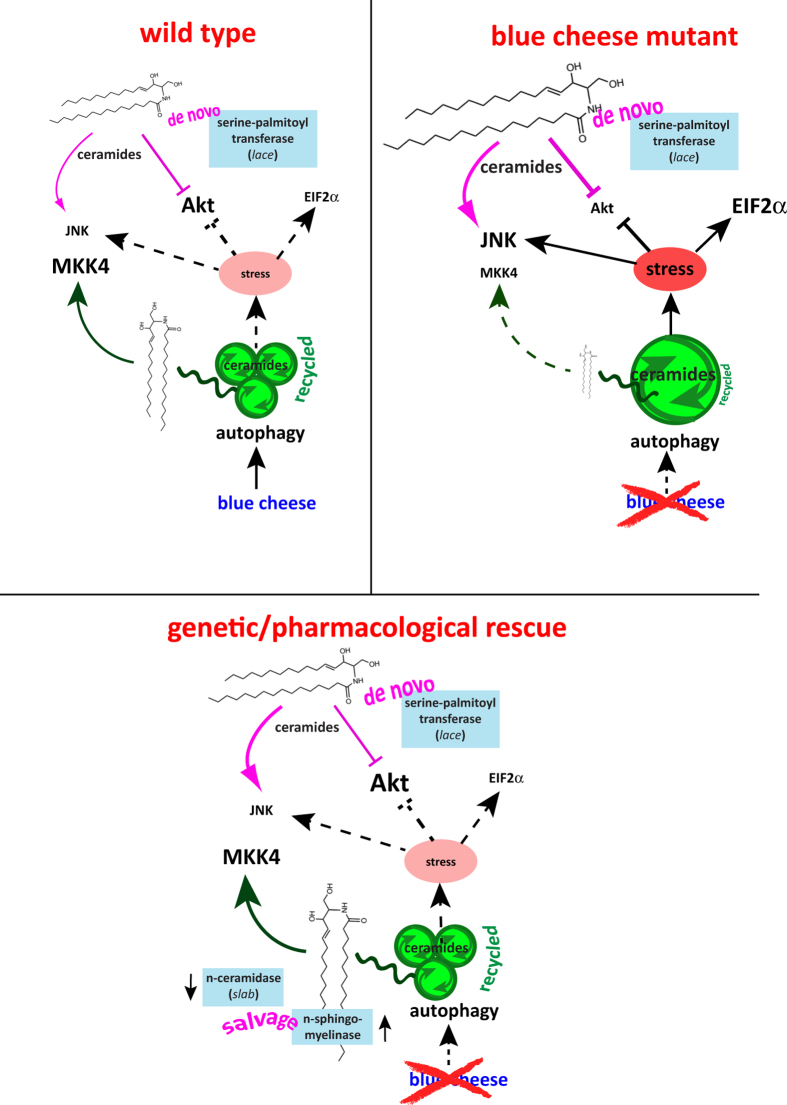
Sphingolipid metabolites are involved in the regulation of autophagy, a degradative recycling process that is required to prevent neuronal degeneration. Drosophila blue cheese mutants neurodegenerate due to perturbations in autophagic flux, and consequent accumulation of ubiquitinated aggregates. Here, we demonstrate that blue cheese mutant brains exhibit an elevation in total ceramide levels; surprisingly, however, degeneration is ameliorated when the pool of available ceramides is further increased, and exacerbated when ceramide levels are decreased by altering sphingolipid catabolism or blocking de novo synthesis. Exogenous ceramide is seen to accumulate in autophagosomes, which are fewer in number and show less efficient clearance in blue cheese mutant neurons. Sphingolipid metabolism is also shifted away from salvage toward de novo pathways, while pro-growth Akt and MAP pathways are down-regulated, and ER stress is increased. All these defects are reversed under genetic rescue conditions that increase ceramide generation from salvage pathways. This constellation of effects suggests a possible mechanism whereby the observed deficit in a potentially ceramide-releasing autophagic pathway impedes survival signaling and exacerbates neuronal death.


Figures

Figure 1
Figure 1. Genetic and pharmacological manipulation of sphingolipid metabolism influences bchs neurodegeneration.
(A) The sphingolipid metabolic pathway showing enzymes that were targeted in colored boxes and their given Drosophila gene names. Pharmacological agents are indicated in pink ovals. (B–E) Larval fillets showing motorneuron aCC and RP2 termini expressing mCD8GFP (green) and muscles stained with rhodamine-Phalloidin (red). Loss of motor neurons is evident in bchs vs. control (C) vs. (B). (D,E) show rescue and exacerbation, respectively, by heterozygosity for slab2 (D) and lacek05305 (E). (F) Quantification of motor neuron loss in bchs58/Df(2L)c17 and in combination with modifiers. Bars indicate percent survival of RP2 motor neuron in >200 scored hemisegments. For (F,G) bars represent standard error of the mean. (G) Effect on motorneuron survival after feeding wtih 12.4 mM Myriocin (Myr) in vehicle (veh) 50 mM NaOH, or 1 mM Fumonisin (FB1) in water. ***P < 0.001, by Chi-square test.
Figure 2
Figure 2. Increased ceramide levels with bchs reduction.
(A) Total ceramide levels are significantly increased in bchs58/Df, bchs17M/7024, C155; bchs58/Df larval brain, and by overexpression in CNS via C155 > EPbchs (EP2299). (B) Abundance of C14-sphingosine in larval brain as determined by LC-MS3 analysis. (C) Ceramide levels in S2R + cells treated with or without (control) bchs RNAi, (D) Relative distribution profiles for ceramide species in larval brain profiles are similar for bchs58/Df (double hatched bars) in the two genetic backgrounds, with or without C155. Cer 32:1 is changed in bchs in the C155; eve > GFP background. (E) Major ceramide species in brains compared across the allelic combinations show significant increases in one or more of the major species. (A,B,E) Bars represent mean ± SEM of percent change for lipids (quantified as picomoles/brain) with respect to the genetic controls, eve-Gal4 driving UASmCD8GFP (eve > GFP; grey hatched bars) alone or in combination with C155-Gal4 (C155; eve > GFP; white hatched bars). The control level of 100% is indicated by a horizontal line. (C-D) Bars represent percent molar ratios for total ceramides (normalized to phospholipids) measured from S2R + cells (C) and for ceramide species measured from larval brains (D,F). Modifiers of bchs degeneration change ceramide levels. F1. CDase heterozygote slab2/+ increases total ceramides and rescues the degeneration whereas CDase overexpression lowers ceramide levels. F2. nSMase overexpression markedly increases ceramide. F3. lacek05305/spt2 heterozygotes do not affect ceramide levels. Bars represent mean ± SEM of percent change with respect to genetic control of total ceramide (quantified as picomoles/brain) for manipulations of CDase (slab) (1), nSMase (2) and Spt2 (lace) (3). Color and hatching schemes represent different bchs allelic combinations or bchs combined with a given genetic background. Numbers represent percent change relative to the genetic control, set to 100% (indicated by horizontal line). Statistical significance between 2 genotypes is indicated by *p < 0.05, **p < 0.005 and ***p < 0.0005 as determined by ANOVA followed by post-hoc Tukey analyses. Lipidome-wide changes are shown in supplementary sections S1 and S2. Changes in specific ceramide species are summarized in supplementary Figures S3–S5.
Figure 3
Figure 3. BODIPY-C5 Ceramide in bchs primary neurons accumulates aberrantly in mCherry-Atg8-expressing autophagosomal compartments.
Live primary neurons incubated with BODIPY C5-ceramide and imaged after chase in label-free medium, in a bchs58/Df; UAS-mCherry-Atg8 expressing background (A) and primary neurons from bchs58/Df brains treated with dextran-Alexa647 (B) to label endolysosomes. Error bars represent mean ± SEM of correlation coefficient denoting extent of co-localization between ceramide and (A) Atg8, or (B) Dextran, from four and three experiments, respectively. Scale bar = 10 μm. Co-localization analysis was carried out using the Fiji co-localization color map plug-in (https://sites.google.com/site/colocalizationcolormap/). (C) mCherry-Atg8 compartments in bchs primary neurons incubated with rapamycin (representative cells in bottom row) appear to clear BODIPY-ceramide more effectively, resulting in hollow compartments rather than the solid BODIPY-ceramide spots seen in untreated neurons (top row).
Figure 4
Figure 4. bchs and its modifiers affect an autophagic flux marker in primary neurons.
Primary neuron cultures of bchs58/Df and bchs58/Df larval brain in sphingolipid modifying genetic backgrounds were immunostained with Ref(2) p antibody (A, left panel) and the images were quantified for number of punctae (spots) per cell (B), spot intensity (C) and spot size (D). DAPI was used for nuclear staining. Error bars represent ± SEM.
Figure 5
Figure 5. bchs mutants alter autophagic induction and imbalance in recycling vs. de novo sources of ceramide.
Primary neuron cultures of bchs58/Df and bchs58/Df in sphingolipid modifying genetic backgrounds were immunostained with Atg8 antibody (A, left panel) and spot number per cell was quantified similarly to Ref(2)p in Fig. 4 (B). DAPI was used for nuclear staining. (C,D) TLC quantification of total sphingolipids extracted from S2R + cells treated with bchs dsRNA and grown in medium containing either 14C-serine (C) or 14C-galactose (D) for 24 hrs. For quantification, total lipid was normalized to total protein levels and 14C signal was calculated by densitometry of the autoradiograph.
Figure 6
Figure 6. Genetic increases in sphingolipid salvage pathways rescue perturbations seen in ceramide effector pathways in bchs.
Western blots and quantification of adult heads (A,A’,B,B’) and 3rd instar larval brains (C,C’,D,D’) from bchs58/Df and bchs58/Df in sphingolipid-modifying genetic backgrounds, probed against p-Akt, p-MKK4, and the ER-stress marker p-eIF2α (E,E’,F,F’). For quantification, signals were normalized to histone H3 loading control and analyzed in Image J. Significance was calculated by Student’s-t test (*p < 0.05, **p < 0.01 and ***p < 0.001). Error bars represent ± SEM.
Figure 7
Figure 7. Pharmacological intervention in de novo synthesis or autophagy rescues perturbations seen in ceramide effector pathways upon bchs knockdown in S2R + cells.
Western analysis of S2R + cells after bchs knockdown via dsRNA and treatment with Fumonisin B1, myriocin, or rapamycin (A) for p-Akt (A1), p-MKK4 (A2), p-JNK (A3) and p-eIF2α (B,B’). Knockdown of Bchs product by dsRNA was confirmed in B, B’, and control thapsigargin treatment of S2R + cells and its effect on p-eIF2α and p-Akt are shown in (C,D). Full blot images of adult heads, larval brains, S2R + cells, and total Akt can be found in suppl Fig. S8. Quantification of blots, shown in bar graphs, was done as in Fig. 6. Error bars represent ± SEM and significance was calculated by Student’s-t test (*p < 0.05, **p < 0.01 and ***p < 0.001).
Figure 8
Figure 8. Model summarizing key sphingolipid metabolic pathways contributing to de novo (pink) and salvaged ceramide pools (green), whose normal balance (‘wild type’ situation) may be perturbed by bchs’ blockage of normal autophagic clearance (‘blue cheese mutant’), which increases stress and impinges on survival pathways involving MKK4, JNK, Akt, and EIF2α.
Rescue of these signaling pathways, and of neuronal death (‘genetic/pharmacological rescue’), can be achieved by genetic increases in salvage pathways, or by increases in autophagic clearance. Suppression of de novo synthesis via spt (lace) reduction or treatment with pharmacological agents, only partially rescues signaling pathways (JNK and Akt) but does not rescue neuronal death.

References

    1. Haughey N. J., Bandaru V. V. R., Bae M. & Mattson M. P. Roles for dysfunctional sphingolipid metabolism in Alzheimer’s disease neuropathogenesis. Biochimica et Biophysica Acta (BBA)—Molecular and Cell Biology of Lipids 1801, 878–886 (2010). - PMC - PubMed
    1. Mielke M. M. et al. Plasma Ceramide and Glucosylceramide Metabolism Is Altered in Sporadic Parkinson’s Disease and Associated with Cognitive Impairment: A Pilot Study. PLoS ONE 8, e73094, 10.1371/journal.pone.0073094 (2013). - DOI - PMC - PubMed
    1. Basu S. & Kolesnick R. Stress signals for apoptosis: ceramide and c-Jun kinase. Oncogene 17, 3277–3285, 10.1038/sj.onc.1202570 (1998). - DOI - PubMed
    1. Pettus B. J., Chalfant C. E. & Hannun Y. A. Ceramide in apoptosis: an overview and current perspectives. Biochim Biophys Acta 1585, 114–125, S1388198102003311 (2002). - PubMed
    1. Young M. M., Kester M. & Wang H.-G. Sphingolipids: regulators of crosstalk between apoptosis and autophagy. Journal of Lipid Research 54, 5–19, 10.1194/jlr.R031278 (2013). - DOI - PMC - PubMed

Publication types

MeSH terms

LinkOut - more resources