

The Community Structures of Prokaryotes and Fungi in Mountain Pasture Soils are Highly Correlated and Primarily Influenced by pH
- PMID: 26640462
- PMCID: PMC4661322
- DOI: 10.3389/fmicb.2015.01321
The Community Structures of Prokaryotes and Fungi in Mountain Pasture Soils are Highly Correlated and Primarily Influenced by pH
Abstract
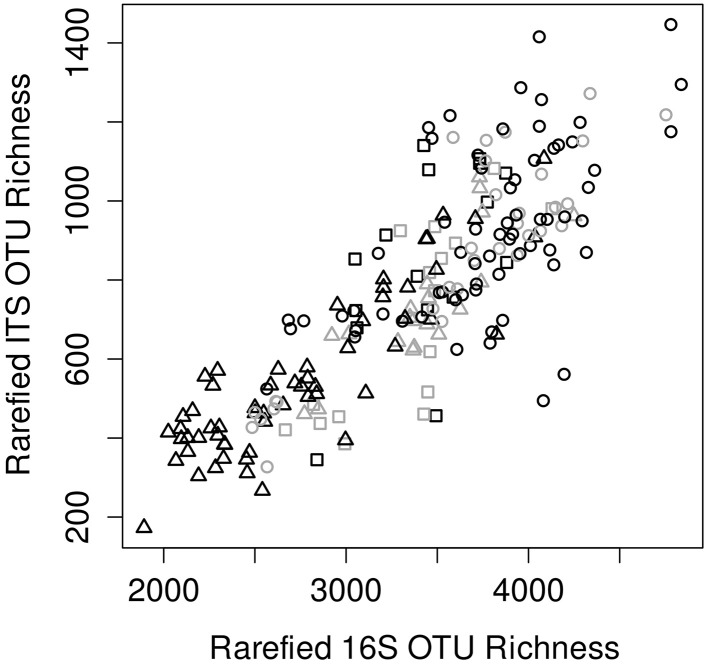
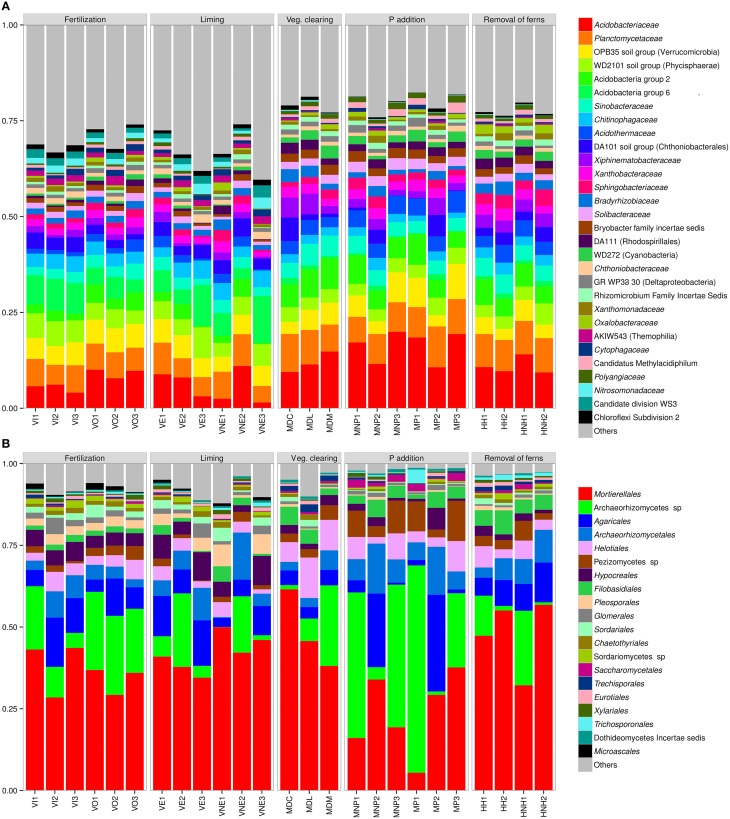
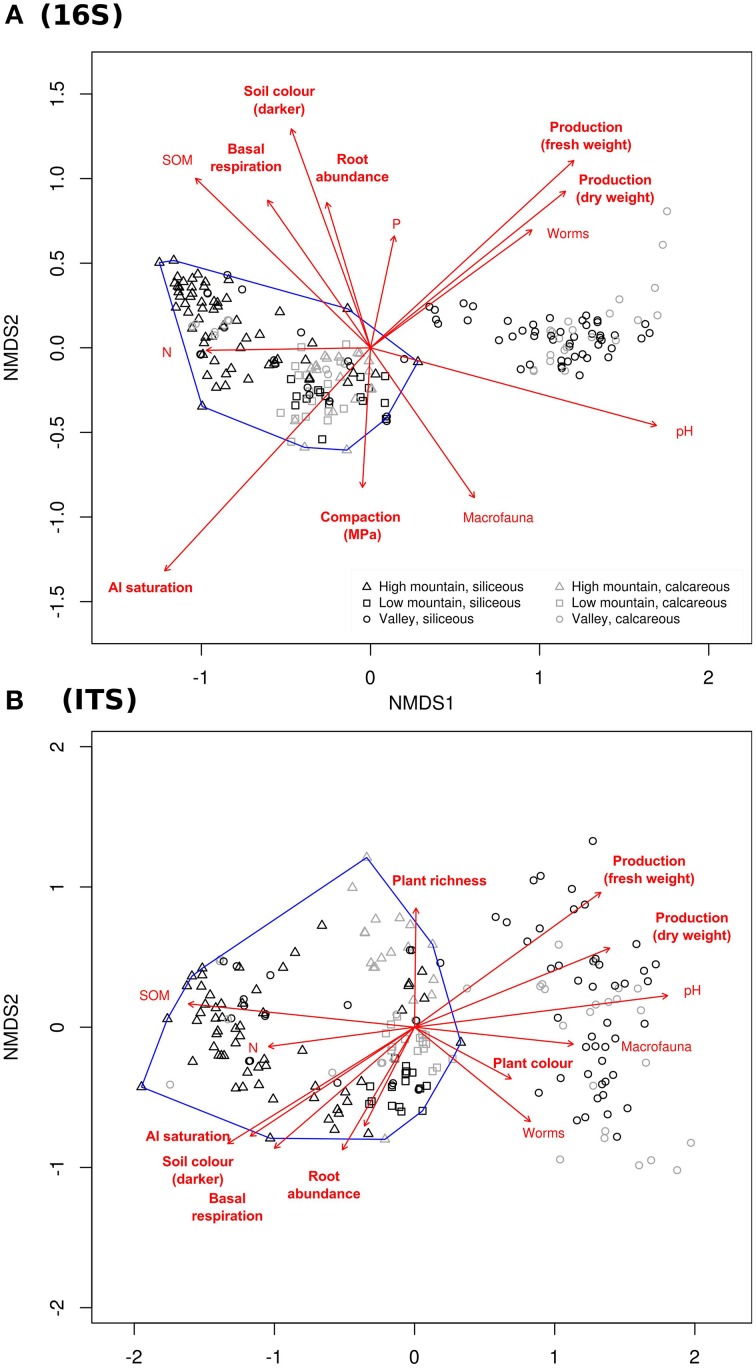
Traditionally, conservation and management of mountain pastures has been managed solely on the basis of visible biota. However, microorganisms play a vital role for the functioning of the soil ecosystem and, hence, pasture sustainability. Here, we studied the links between soil microbial (belowground) community structure (using amplicon sequencing of prokaryotes and fungi), other soil physicochemical and biological properties and, finally, a variety of pasture management practices. To this aim, during two consecutive years, we studied 104 environmental sites characterized by contrasting elevation, habitats, bedrock, and pasture management; located in or near Gorbeia Natural Park (Basque Country/Spain). Soil pH was found to be one of the most important factors in structuring soil microbial diversity. Interestingly, we observed a striking correlation between prokaryotic, fungal and macrofauna diversity, likely caused by interactions between these life forms. Further studies are needed to better understand such interactions and target the influence of different management practices on the soil microbial community, in face of the significant heterogeneity present. However, clearing of bushes altered microbial community structure, and in sites with calcareous bedrock also the use of herbicide vs. mechanical clearing of ferns.
Keywords: belowground interactions; biodiversity; grassland soil; microbial diversity; pasture management; soil microbial communities; soil properties.
Figures
Similar articles
-
Short-term effects of non-grazing on plants, soil biota and aboveground-belowground links in Atlantic mountain grasslands.Sci Rep. 2017 Nov 8;7(1):15097. doi: 10.1038/s41598-017-15345-1. Sci Rep. 2017. PMID: 29118337 Free PMC article.
-
Land use as a driver of soil fertility and biodiversity across an agricultural landscape in the Central Peruvian Andes.Ecol Appl. 2017 Jun;27(4):1138-1154. doi: 10.1002/eap.1508. Epub 2017 Mar 24. Ecol Appl. 2017. PMID: 28117908
-
Local Environmental Factors Drive Divergent Grassland Soil Bacterial Communities in the Western Swiss Alps.Appl Environ Microbiol. 2016 Oct 14;82(21):6303-6316. doi: 10.1128/AEM.01170-16. Print 2016 Nov 1. Appl Environ Microbiol. 2016. PMID: 27542929 Free PMC article.
-
Soil bacterial biodiversity is driven by long-term pasture management, poultry litter, and cattle manure inputs.PeerJ. 2019 Oct 1;7:e7839. doi: 10.7717/peerj.7839. eCollection 2019. PeerJ. 2019. PMID: 31592358 Free PMC article.
-
Forest-to-pasture conversion and recovery based on assessment of microbial communities in Eastern Amazon rainforest.FEMS Microbiol Ecol. 2019 Mar 1;95(3):fiy236. doi: 10.1093/femsec/fiy236. FEMS Microbiol Ecol. 2019. PMID: 30544159
Cited by
-
New enlightenment on the regulatory effects of acids and phenolic compounds in wood vinegar, a by-product of biomass pyrolysis, on tomato production.Front Microbiol. 2025 Jul 16;16:1538998. doi: 10.3389/fmicb.2025.1538998. eCollection 2025. Front Microbiol. 2025. PMID: 40740332 Free PMC article.
-
The Soil Microbiome of GLORIA Mountain Summits in the Swiss Alps.Front Microbiol. 2019 May 15;10:1080. doi: 10.3389/fmicb.2019.01080. eCollection 2019. Front Microbiol. 2019. PMID: 31156590 Free PMC article.
-
Variations in bacterial diversity and community structure in the sediments of an alkaline lake in Inner Mongolia plateau, China.PeerJ. 2023 Aug 21;11:e15909. doi: 10.7717/peerj.15909. eCollection 2023. PeerJ. 2023. PMID: 37637159 Free PMC article.
-
Long-Term Effects of Periodical Fires on Archaeal Communities from Brazilian Cerrado Soils.Archaea. 2019 Jan 27;2019:6957210. doi: 10.1155/2019/6957210. eCollection 2019. Archaea. 2019. PMID: 30833827 Free PMC article.
-
Interaction between Fungal Communities, Soil Properties, and the Survival of Invading E. coli O157:H7 in Soils.Int J Environ Res Public Health. 2020 May 18;17(10):3516. doi: 10.3390/ijerph17103516. Int J Environ Res Public Health. 2020. PMID: 32443436 Free PMC article.
References
-
- Barrios E. (2007). Soil biota, ecosystem services and land productivity. Ecol. Econ. 64, 269–285. 10.1016/j.ecolecon.2007.03.004 - DOI
-
- Burke D. J., Smemo K. A., López-Gutiérrez J. C., DeForest J. L. (2012). Soil fungi influence the distribution of microbial functional groups that mediate forest greenhouse gas emissions. Soil. Biol. Biochem. 53, 112–119. 10.1016/j.soilbio.2012.05.008 - DOI
-
- Csardi G., Nepusz T. (2006). The igraph software package for complex network research. InterJ. Complex Sys. 1695 Available online at: http://interjournal.org/manuscript_abstract.php?361100992
LinkOut - more resources
Full Text Sources
Other Literature Sources