

Sentiment of Emojis
- PMID: 26641093
- PMCID: PMC4671607
- DOI: 10.1371/journal.pone.0144296
Sentiment of Emojis
Abstract
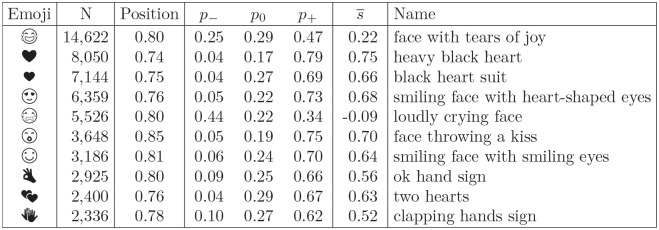
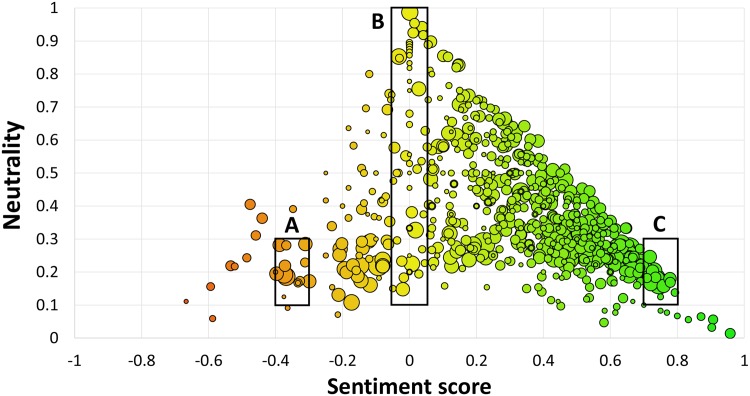
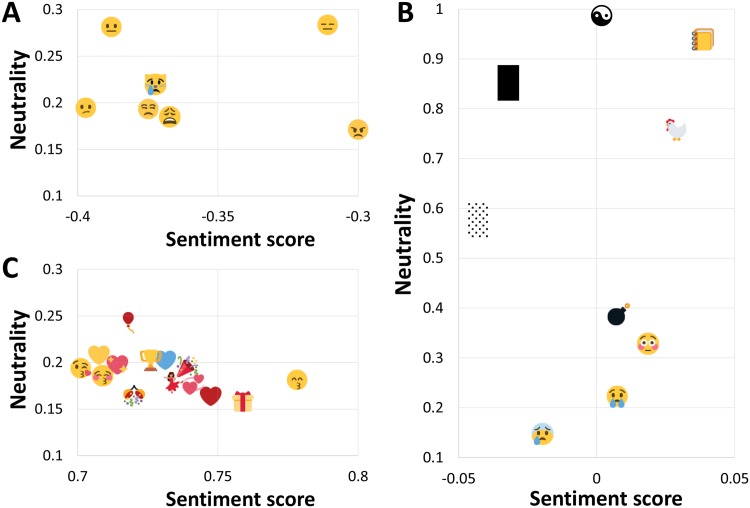
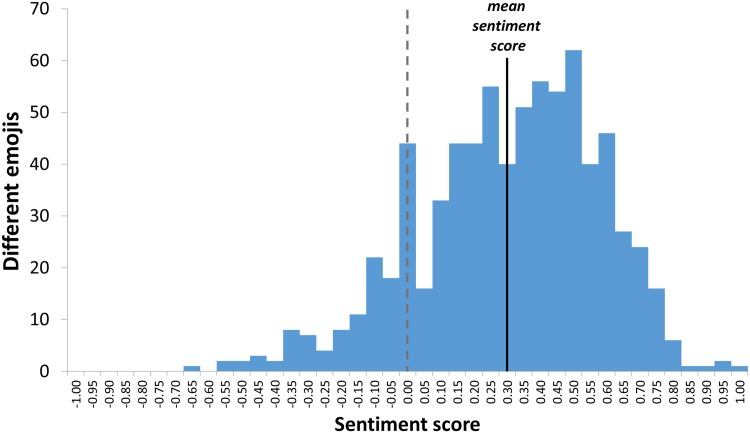
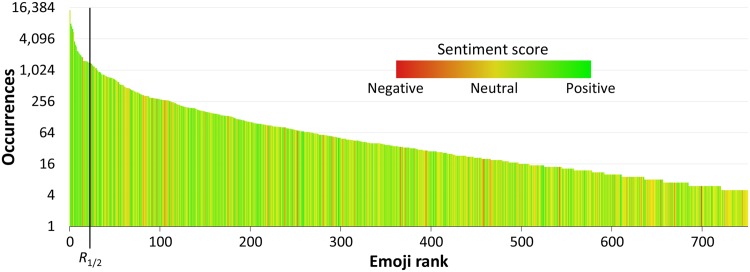
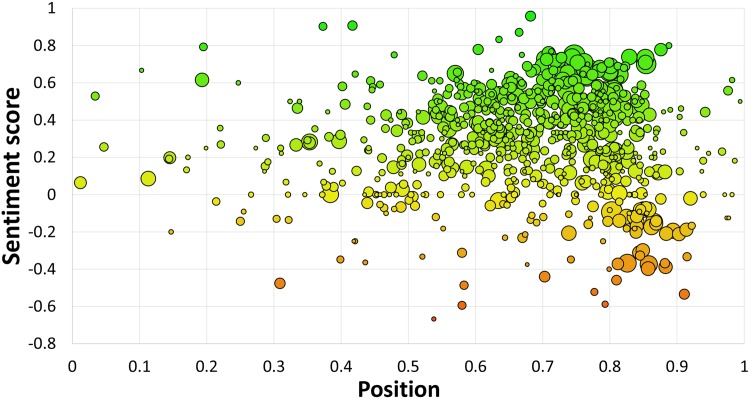
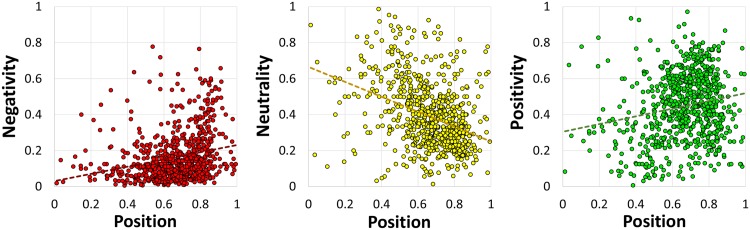
There is a new generation of emoticons, called emojis, that is increasingly being used in mobile communications and social media. In the past two years, over ten billion emojis were used on Twitter. Emojis are Unicode graphic symbols, used as a shorthand to express concepts and ideas. In contrast to the small number of well-known emoticons that carry clear emotional contents, there are hundreds of emojis. But what are their emotional contents? We provide the first emoji sentiment lexicon, called the Emoji Sentiment Ranking, and draw a sentiment map of the 751 most frequently used emojis. The sentiment of the emojis is computed from the sentiment of the tweets in which they occur. We engaged 83 human annotators to label over 1.6 million tweets in 13 European languages by the sentiment polarity (negative, neutral, or positive). About 4% of the annotated tweets contain emojis. The sentiment analysis of the emojis allows us to draw several interesting conclusions. It turns out that most of the emojis are positive, especially the most popular ones. The sentiment distribution of the tweets with and without emojis is significantly different. The inter-annotator agreement on the tweets with emojis is higher. Emojis tend to occur at the end of the tweets, and their sentiment polarity increases with the distance. We observe no significant differences in the emoji rankings between the 13 languages and the Emoji Sentiment Ranking. Consequently, we propose our Emoji Sentiment Ranking as a European language-independent resource for automated sentiment analysis. Finally, the paper provides a formalization of sentiment and a novel visualization in the form of a sentiment bar.
Conflict of interest statement
Figures


References
-
- Dimson T. Emojineering part 1: Machine learning for emoji trends [blog]; 2015. http://instagram-engineering.tumblr.com/post/117889701472/emojineering-p....
-
- SwiftKey PT. Most-used emoji revealed: Americans love skulls, Brazilians love cats, the French love hearts [blog]; 2015. http://swiftkey.com/en/blog/americans-love-skulls-brazilians-love-cats-s....
-
- Liu B. Sentiment Analysis and Opinion Mining. Synthesis Lectures on Human Language Technologies. 2012;5(1):1–167. 10.2200/S00416ED1V01Y201204HLT016 - DOI
-
- Liu B. Sentiment Analysis: Mining Opinions, Sentiments, and Emotions. Cambridge University Press; 2015.
-
- Boia M, Faltings B, Musat CC, Pu P. A:) is worth a thousand words: How people attach sentiment to emoticons and words in tweets. In: Intl. Conf. on Social Computing (SocialCom). IEEE; 2013. p. 345–350.
Publication types
MeSH terms
LinkOut - more resources
Full Text Sources
Other Literature Sources
Miscellaneous
