

Base-Displaced Intercalated Structure of the N-(2'-Deoxyguanosin-8-yl)-3-aminobenzanthrone DNA Adduct
- PMID: 26641105
- PMCID: PMC4894058
- DOI: 10.1021/acs.chemrestox.5b00277
Base-Displaced Intercalated Structure of the N-(2'-Deoxyguanosin-8-yl)-3-aminobenzanthrone DNA Adduct
Abstract
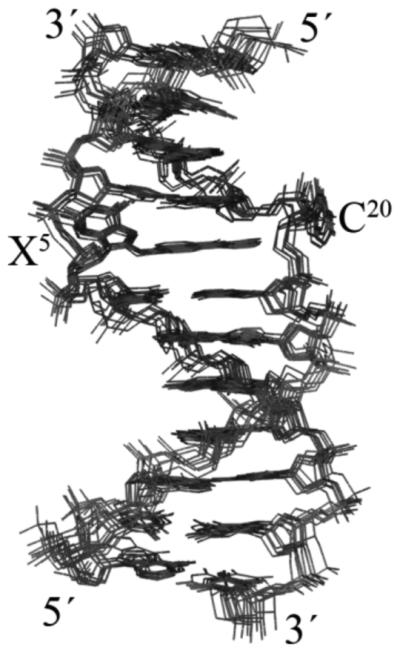
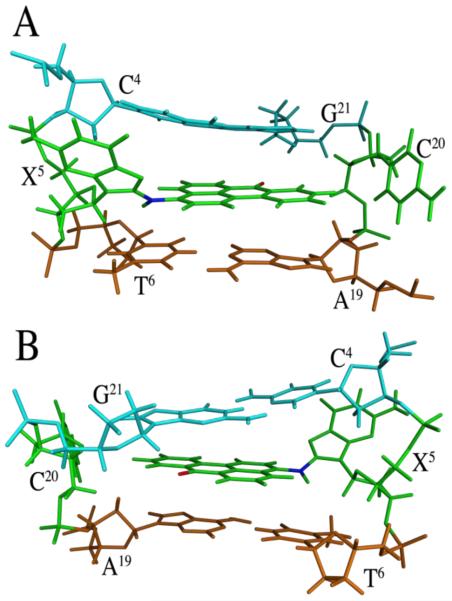
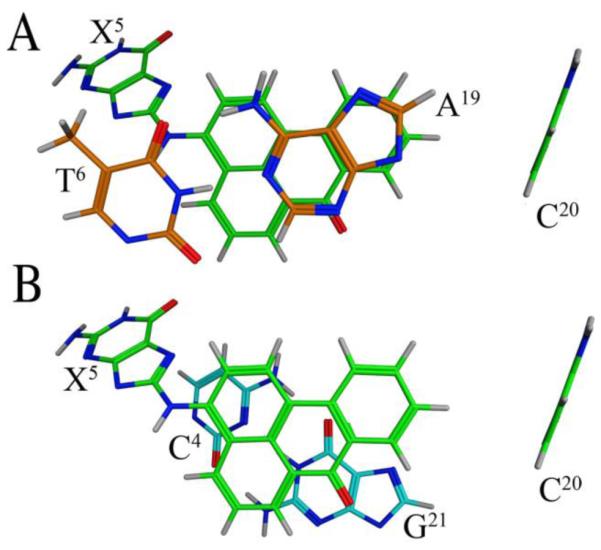
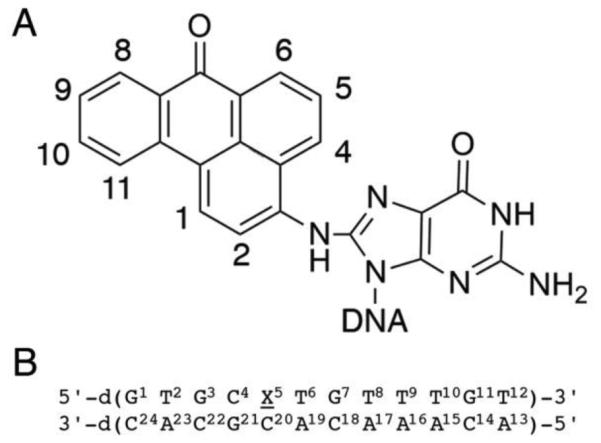
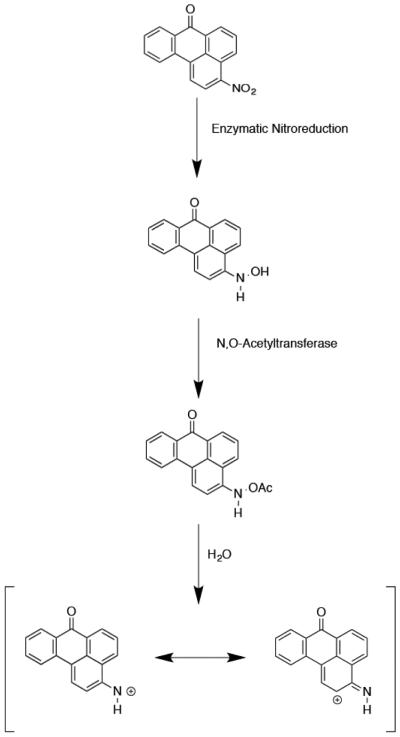
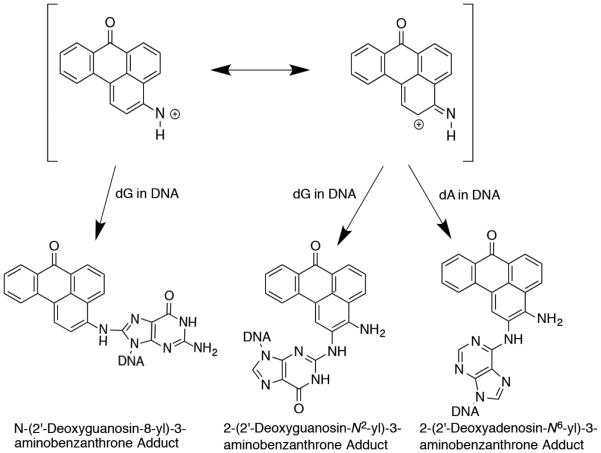
3-Nitrobenzanthrone (3-NBA), an environmental mutagen found in diesel exhaust and a suspected carcinogen, undergoes metabolic reduction followed by reaction with DNA to form aminobenzanthrone (ABA) adducts, with the major alkylation product being N-(2'-deoxyguanosin-8-yl)-3-aminobenzanthrone (C8-dG-ABA). Site-specific synthesis of the C8-dG-ABA adduct in the oligodeoxynucleotide 5'-d(GTGCXTGTTTGT)-3':5'-d(ACAAACACGCAC)-3'; X = C8-dG-ABA adduct, including codons 272-275 of the p53 gene, has allowed for investigation into the structural and thermodynamic properties of this adduct. The conformation of the C8-dG-ABA adduct was determined using NMR spectroscopy and was refined using molecular dynamics (MD) calculations restrained by experimentally determined interproton distance restraints obtained from NOE experiments. The refined structure revealed that the C8-dG-ABA adduct formed a base-displaced intercalated conformation. The adducted guanine was shifted into the syn conformation about the glycosidic bond. The 5'- and 3'-neighboring base pairs remained intact. While this facilitated π-stacking interactions between the ABA moiety and neighboring bases, the thermal melting temperature (Tm) of the adduct-containing duplex showed a decrease of 11 °C as compared to the corresponding unmodified oligodeoxynucleotide duplex. Overall, in this sequence, the base-displaced intercalated conformation of the C8-dG-ABA lesion bears similarity to structures of other arylamine C8-dG adducts. However, in this sequence, the base-displaced intercalated conformation for the C8-dG-ABA adduct differs from the conformation of the N(2)-dG-ABA adduct reported by de los Santos and co-workers, in which it is oriented in the minor groove toward the 5' end of the duplex, with the modified guanine remaining in the anti conformation about the glyosidic torsion angle, and the complementary base remaining within the duplex. The results are discussed in relationship to differences between the C8-dG-ABA and N(2)-dG-ABA adducts with respect to susceptibility to nucleotide excision repair (NER).
Figures
Similar articles
-
Identification of three major DNA adducts formed by the carcinogenic air pollutant 3-nitrobenzanthrone in rat lung at the C8 and N2 position of guanine and at the N6 position of adenine.Int J Cancer. 2006 May 1;118(9):2139-46. doi: 10.1002/ijc.21622. Int J Cancer. 2006. PMID: 16331602
-
Solution conformation of [AF]dG opposite a -2 deletion site in a DNA duplex: intercalation of the covalently attached aminofluorene ring into the helix with base displacement of the C8-modified syn guanine and adjacent unpaired 3'-adenine into the major groove.Biochemistry. 1995 Dec 26;34(51):16641-53. doi: 10.1021/bi00051a012. Biochemistry. 1995. PMID: 8527437
-
Solution conformation of the (-)-trans-anti-[BP]dG adduct opposite a deletion site in a DNA duplex: intercalation of the covalently attached benzo[a]pyrene into the helix with base displacement of the modified deoxyguanosine into the minor groove.Biochemistry. 1997 Nov 11;36(45):13780-90. doi: 10.1021/bi970070r. Biochemistry. 1997. PMID: 9374854
-
Error-Prone and Error-Free Translesion DNA Synthesis over Site-Specifically Created DNA Adducts of Aryl Hydrocarbons (3-Nitrobenzanthrone and 4-Aminobiphenyl).Toxicol Res. 2017 Oct;33(4):265-272. doi: 10.5487/TR.2017.33.4.265. Epub 2015 Oct 15. Toxicol Res. 2017. PMID: 29071010 Free PMC article. Review.
-
3-Nitrobenzanthrone, a potential human cancer hazard in diesel exhaust and urban air pollution: a review of the evidence.Mutagenesis. 2005 Nov;20(6):399-410. doi: 10.1093/mutage/gei057. Epub 2005 Sep 30. Mutagenesis. 2005. PMID: 16199526 Review.
Cited by
-
Pre-steady-state kinetic investigation of bypass of a bulky guanine lesion by human Y-family DNA polymerases.DNA Repair (Amst). 2016 Oct;46:20-28. doi: 10.1016/j.dnarep.2016.08.002. Epub 2016 Sep 1. DNA Repair (Amst). 2016. PMID: 27612622 Free PMC article.
-
Mechanism of Error-Free Bypass of the Environmental Carcinogen N-(2'-Deoxyguanosin-8-yl)-3-aminobenzanthrone Adduct by Human DNA Polymerase η.Chembiochem. 2016 Nov 3;17(21):2033-2037. doi: 10.1002/cbic.201600420. Epub 2016 Sep 13. Chembiochem. 2016. PMID: 27556902 Free PMC article.
-
Translesion Synthesis of 2'-Deoxyguanosine Lesions by Eukaryotic DNA Polymerases.Chem Res Toxicol. 2017 Jan 17;30(1):61-72. doi: 10.1021/acs.chemrestox.6b00285. Epub 2016 Nov 1. Chem Res Toxicol. 2017. PMID: 27760288 Free PMC article.
-
Synthesis of Oligodeoxynucleotides Containing a C8-2'-Deoxyguanosine Adduct Formed by the Carcinogen 3-Nitrobenzanthrone.Curr Protoc Nucleic Acid Chem. 2017 Jun 19;69:4.73.1-4.73.15. doi: 10.1002/cpnc.28. Curr Protoc Nucleic Acid Chem. 2017. PMID: 28628210 Free PMC article.
-
Repair-Resistant DNA Lesions.Chem Res Toxicol. 2017 Aug 21;30(8):1517-1548. doi: 10.1021/acs.chemrestox.7b00128. Epub 2017 Aug 10. Chem Res Toxicol. 2017. PMID: 28750166 Free PMC article. Review.
References
-
- Kielhorn J, Mangelsdorf I. Selected Nitro- and Nitro-oxy-polycyclic Aromatic Hydrocarbons. Vol. 229. World Health Organization; Geneva, Switzerland: 2003. nited Nations Environment Programme, International Labour Organisation,World Health Organization, Inter-Organization Programme for the Sound Management of Chemicals, and International Program on Chemical Safety.
-
- Murahashi T. Determination of mutagenic 3-nitrobenzanthrone in diesel exhaust particulate matter by three-dimensional high-performance liquid chromatography. Analyst. 2003;128:42–45. - PubMed
-
- Schuetzle D, Lee FSC, Prater TJ, Tejada SB. The identification of polynuclear aromatic hydrocarbon (PAH) derivatives in mutagenic fractions of diesel particulate extracts. Int. J. Environ. Anal. Chem. 1981;9:93–144. - PubMed
-
- Paputapeck MC, Marano RS, Schuetzle D, Riley TL, Hampton CV, Prater TJ, Skewes LM, Jensen TE, Ruehle PH, Bosch LC, Duncan WP. Determination of nitrated polynuclear aromatic-hydrocarbons in particulate extracts by capillary column gas-chromatography with nitrogen selective detection. Anal. Chem. 1983;55:1946–1954.
-
- Arlt VM, Stiborova M, Henderson CJ, Osborne MR, Bieler CA, Frei E, Martinek V, Sopko B, Wolf CR, Schmeiser HH, Phillips DH. Environmental pollutant and potent mutagen 3-nitrobenzanthrone forms DNA adducts after reduction by NAD(P)H: Quinone oxidoreductase and conjugation by acetyltransferases and sulfotransferases in human hepatic cytosols. Cancer Res. 2005;65:2644–2652. - PubMed
Publication types
MeSH terms
Substances
Grants and funding
- P30 ES000267/ES/NIEHS NIH HHS/United States
- R01 ES009127/ES/NIEHS NIH HHS/United States
- R01 CA-55678/CA/NCI NIH HHS/United States
- S10 RR025677/RR/NCRR NIH HHS/United States
- R01 ES021762/ES/NIEHS NIH HHS/United States
- R01 ES-009127/ES/NIEHS NIH HHS/United States
- S10 RR-025677/RR/NCRR NIH HHS/United States
- R01 ES005509/ES/NIEHS NIH HHS/United States
- P30 CA068485/CA/NCI NIH HHS/United States
- R01 CA055678/CA/NCI NIH HHS/United States
- R01 ES-021762/ES/NIEHS NIH HHS/United States
- P30 ES-000267/ES/NIEHS NIH HHS/United States
- S10 RR-05805/RR/NCRR NIH HHS/United States
LinkOut - more resources
Full Text Sources
Other Literature Sources
Research Materials
Miscellaneous
