. 2016 Jan;18(1):7-20.
doi: 10.1038/ncb3280. Epub 2015 Dec 7.

Sequential Notch activation regulates ventricular chamber development

Affiliations

Sequential Notch activation regulates ventricular chamber development

Gaetano D'Amato et al. Nat Cell Biol. 2016 Jan.

Abstract

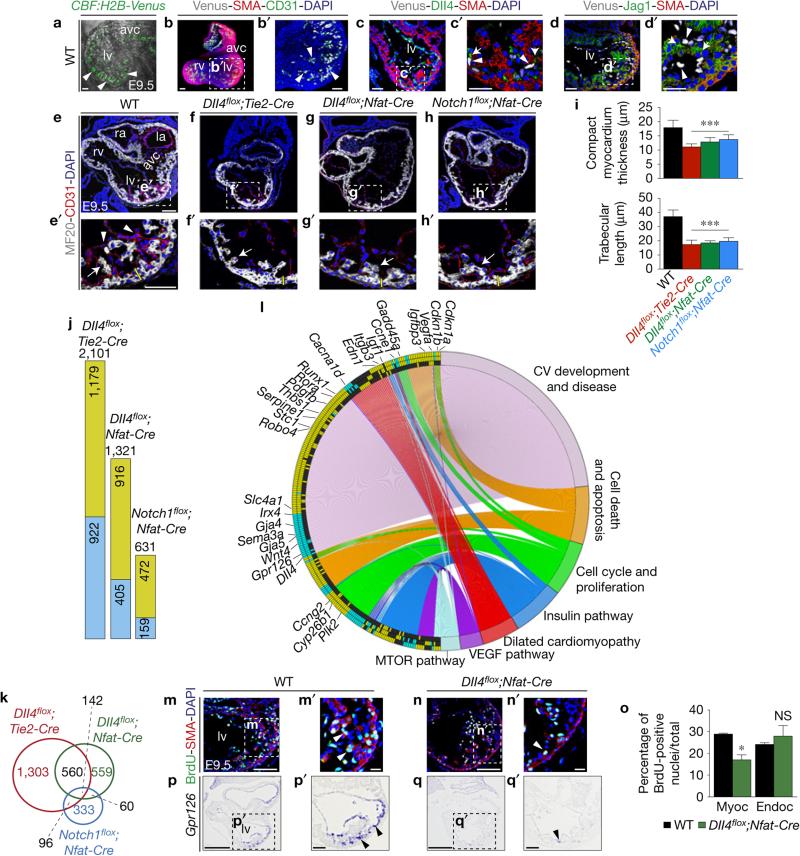
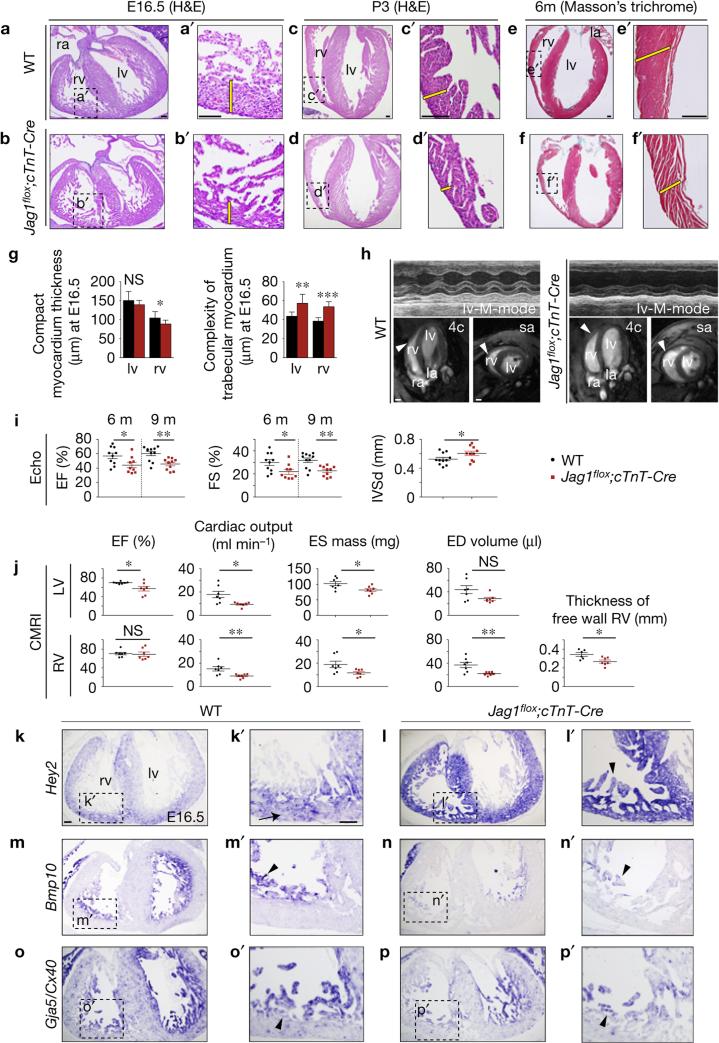
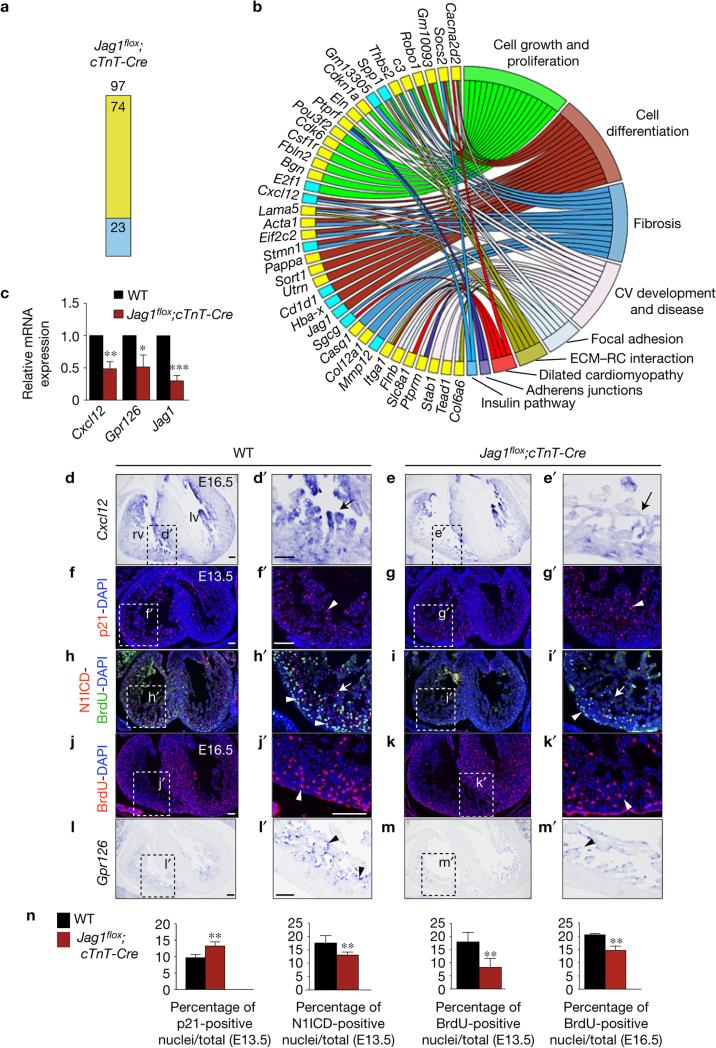
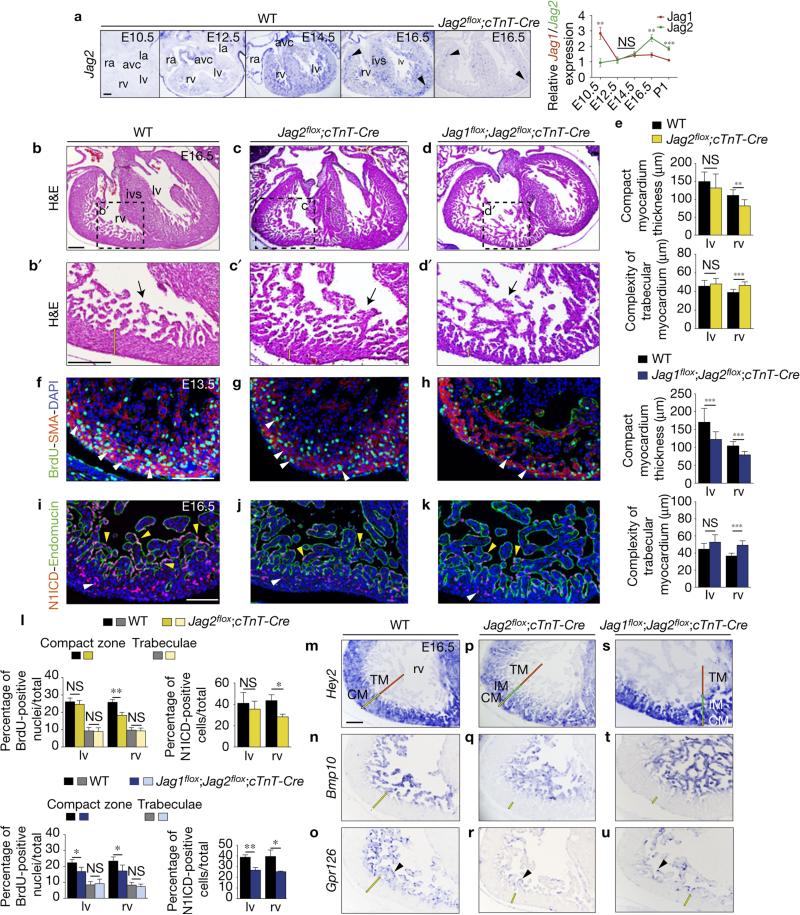
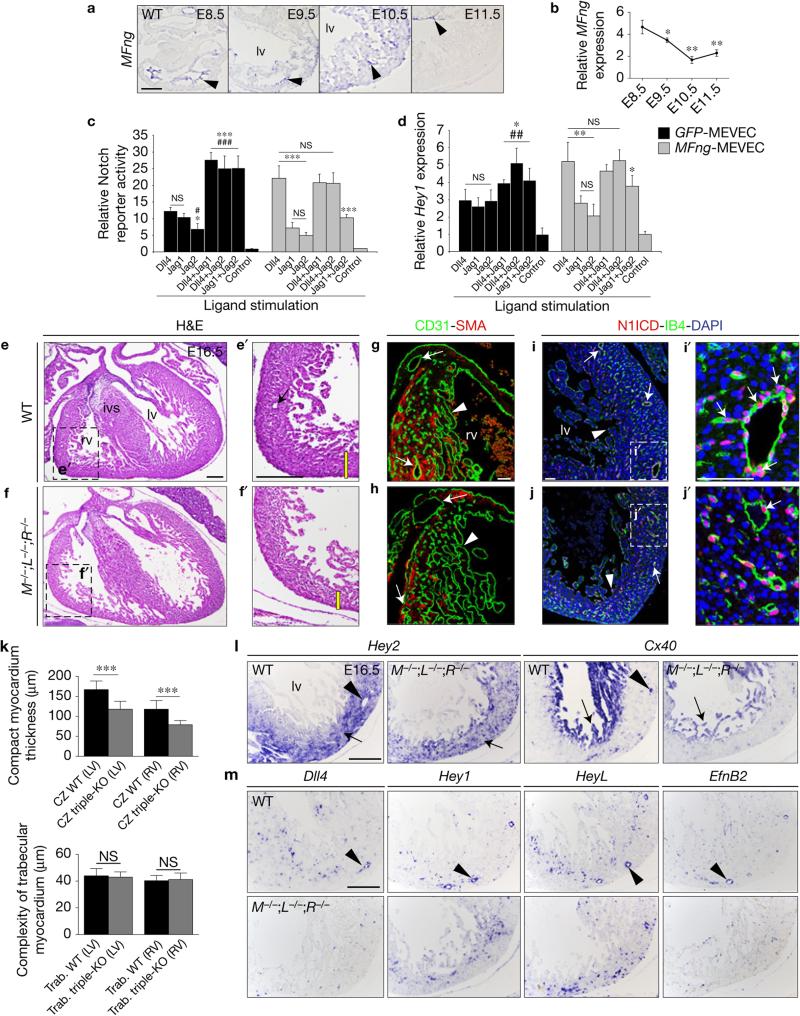
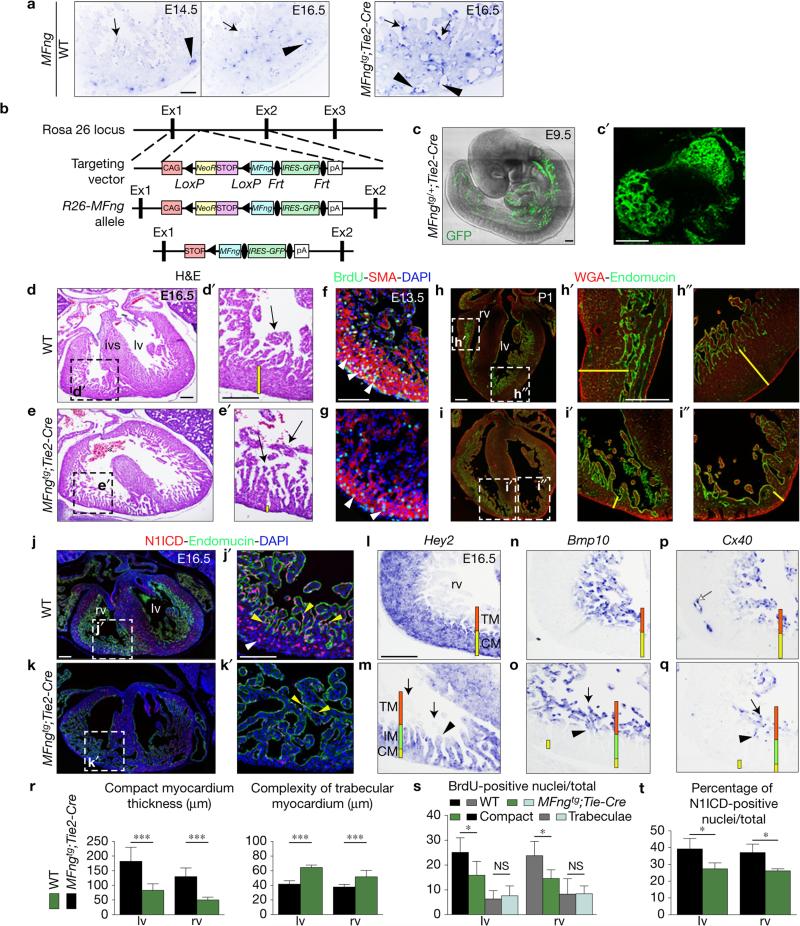
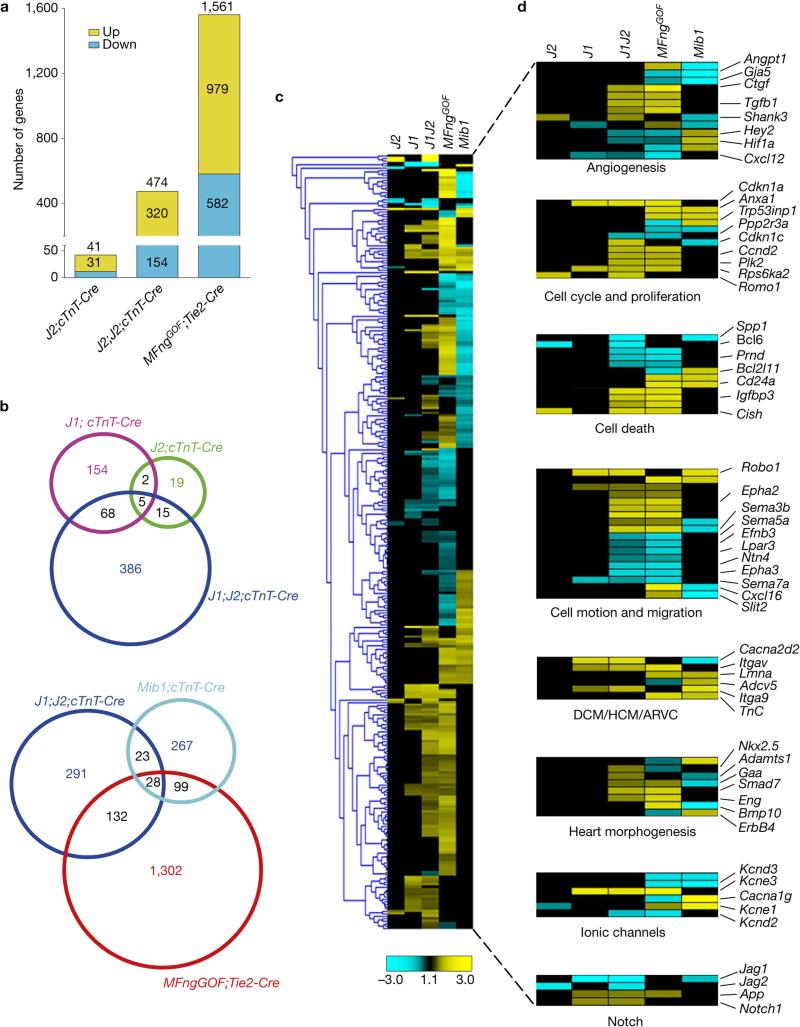
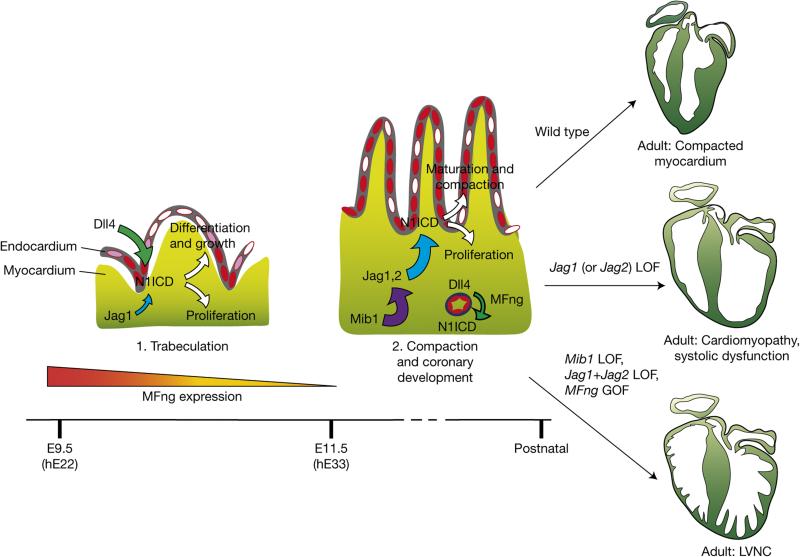
Ventricular chambers are essential for the rhythmic contraction and relaxation occurring in every heartbeat throughout life. Congenital abnormalities in ventricular chamber formation cause severe human heart defects. How the early trabecular meshwork of myocardial fibres forms and subsequently develops into mature chambers is poorly understood. We show that Notch signalling first connects chamber endocardium and myocardium to sustain trabeculation, and later coordinates ventricular patterning and compaction with coronary vessel development to generate the mature chamber, through a temporal sequence of ligand signalling determined by the glycosyltransferase manic fringe (MFng). Early endocardial expression of MFng promotes Dll4-Notch1 signalling, which induces trabeculation in the developing ventricle. Ventricular maturation and compaction require MFng and Dll4 downregulation in the endocardium, which allows myocardial Jag1 and Jag2 signalling to Notch1 in this tissue. Perturbation of this signalling equilibrium severely disrupts heart chamber formation. Our results open a new research avenue into the pathogenesis of cardiomyopathies.


Figures

Figure 1
Figure 1
Dll4–Notch1 signalling abrogation disrupts trabeculation and chamber-gene expression. (a) E9.5 WT CBF:H2B-Venus embryo, two-photon whole-mount image, left ventricle. Arrowheads indicate Venus expression. (b,b′) E9.5 WT CBF:H2B-Venus heart, whole-mount view of immunohistochemistry for Venus (grey), smooth-muscle actin (SMA, red) and CD31 (Pecam1) (green). (c,c′) E9.5 WT CBF:H2B-Venus heart, Dll4 (green), SMA (red) and GFP (grey) immunohistochemistry. (d,d′) E9.5 WT CBF:H2B-Venus heart, Jag1 (green), SMA (red) and GFP (grey) immunohistochemistry. Scale bars, 50 μm. (e–h′) Sarcomeric myosin (MF20) and CD31 immunohistochemistry in E9.5 WT (e,e′), Dll4flox/flox;Tie2-Cre/+(Dll4flox;Tie2-Cre) (f,f′), Dll4flox/flox;Nfatc1pan-Cre/+ (Dll4flox;Nfat-Cre) (g,g′) and Notch1flox/flox;Nfatc1pan-Cre/+ (Notch1flox;Nfat-Cre) sections (h,h′). Arrowheads, endocardium; arrows, trabecular myocardium. Yellow bars, compact myocardium thickness. In b–d′,e–h′ nuclei are DAPI-counterstained. Scale bars, 100 μm. (i) Quantification of compact myocardium thickness and trabecular length at E9.5. Data are mean ± s.d. (n = 12 sections from 3 WT and n = 12 sections from 3 mutant embryos of each genotype, ***P < 0.001, by Student's t-test). (j) Chart showing the total number of differentially expressed genes identified by RNA-seq (P < 0.05) in the indicated genotypes. Numbers in the green and blue sections indicate upregulated and downregulated genes, respectively. (k) Venn diagram representation of the comparative analysis of deregulated genes in the three genotypes. Numbers in black indicate the total number of genes common to at least two genotypes. (l) Circular plot of 257 differentially expressed genes, simultaneously presenting a detailed view of the relationships between expression changes (left semicircle perimeter) and processes (right semicircle perimeter). In the left semicircle perimeter, the inner ring represents Notch1flox;Nfat-Cre data, the middle ring Dll4flox;Nfat-Cre data and the outer ring Dll4flox;Tie2-Cre data. 28 of the 257 genes are named. Green, upregulated; blue, downregulated; black, unchanged. Details in Supplementary Table 1. (m–n′) E9.5 WT (m,m′) and Dll4flox;Nfat-Cre embryos (n,n′), BrdU immunostaining. The myocardium is SMA-counterstained (red). Arrowheads, BrdU-positive nuclei. Scale bars, 50 μm. (o) BrdU-positive nuclei as a percentage of total nuclei in myocardium and endocardium. Data are mean ± s.d. (n=3 WT and 3 n=mutant embryos, *P < 0.05 by Student's t-test; NS, not significant). (p–q′) Gpr126 ISH in E9.5 WT (p,p′) and Dll4flox;Nfat-Cre hearts (q,q′). Scale bars, 100 μm. Source data are available in Supplementary Table 4. avc, atrio-ventricular canal; la, left atrium; lv, left ventricle; ra, right atrium; rv, right ventricle; myoc, myocardium; endoc, endocardium.
Figure 2
Figure 2
Myocardial Jag1 inactivation disrupts chamber maturation and leads to cardiomyopathy and systolic dysfunction. (a–d′) Haematoxylin–eosin (H&E) staining of heart sections from WT and Jag1flox/flox;cTnT-Cre/+ (Jag1flox;cTnT-Cre) E16.5 embryos (a–b′) and postnatal day 3 (P3) neonates (c–d′). (e–f′) Masson's trichome staining in 6-month-old hearts. The yellow bars in a′–f′ indicate compact myocardium thickness. Abbreviations as in Fig. 1. Scale bars, 100 μm. (g) Quantification of compact myocardium thickness and trabecular complexity in E16.5 WT, Jag1flox;cTnT-Cre embryos. Data are mean ± s.d. (n = 16 sections from 4 WT and n = 16 sections from 4 mutant embryos, *P < 0.05, **P < 0.01, ***P < 0.001, by Student's t-test; NS, not significant). (h) Echocardiography and CMRI analysis of adult WT and Jag1flox;cTnT-Cre mice. Left: top, M-mode views of the left ventricle (lv) of a 6-month-old WT mouse. Bottom, CMRI analysis of a 6-month-old WT mouse. Images show four-chamber (4c) and short-axis (sa) views. Arrowheads mark the ventricular wall. Right: top, M-mode views of the left ventricle of a 6-month-old Jag1flox;cTnT-Cre mouse. Bottom, CMRI analysis of a 6-month-old mutant mouse. Arrowheads mark the thin ventricular wall. Scale bars, 2 mm. (i) Echocardiography analysis of left ventricular ejection fraction (EF) and fractional shortening (FS) measured at 6 and 9 months and diastolic interventricular septal wall thickness (IVSd) in WT and Jag1flox;cTnT-Cre mice. Data are mean ± s.d. (n = 10 WT and n = 9 mutants at 6 months and n = 11 WT and n = 10 mutants at 9 months, *P < 0.05 and **P < 0.01 by Student's t-test). (j) CMRI analysis of physiological and morphometric parameters in the left (LV) and right ventricles (RV) of 6-month-old WT and Jag1flox;cTnT-Cre mice. EF, ejection fraction; ES mass, end-systolic mass; ED volume, end-diastolic volume. Data are mean ± s.e.m. (n = 7 WT and n = 7 mutants, *P < 0.05 and **P <0.01 by Student's t-test; NS,=not significant). (k–p′) ISH in E16.5 WT and Jag1flox;cTnT-Cre heart sections. (k–l′) Hey2 expressed in compact myocardium (k′, arrow) is expanded to trabeculae in mutants (l′, arrowhead). (m–n′) Bmp10. (o–p′) Cx40. Arrowheads in m′,n′,o′,p′ indicate trabecular myocardium. Scale bars, 100 μm. Source data are available in Supplementary Table 4.
Figure 3
Figure 3
Jag1 gene profiling and validation. (a) Chart showing the number of deregulated genes identified by RNA-seq (P < 0.05) in Jag1flox;cTnT-Cre hearts. Yellow, upregulated; blue, downregulated. (b) Circular plot showing 39 representative differentially expressed genes from a total of 97 genes belonging to selected functional categories. Code colour as in a. The total number of deregulated genes and the genes represented in the circular plot can be found in Supplementary Table 1. (c) qRT–PCR analysis of Cxcl12, Gpr126 and Jag1 (as control) in E16.5 WT and mutant ventricles. Data are means ± s.d. (n = 3 pools of 3 WT ventricles per pool and n = 3 pools of 3 mutant ventricles per pool; *P < 0.05, **P < 0.01, ***P < 0.001 by Student's t-test). (d–e′) ISH of Cxcl12 in E16.5 WT and Jag1flox;cTnT-Cre hearts. Arrows point to myocardial expression. (f–i′) Immunostaining for p21 (red nuclei; arrowheads in f′,g′), N1ICD (red nuclei; arrowheads in h′,i′) and incorporated BrdU (green nuclei; arrows in h′,i′) in E13.5 WT and Jag1flox;cTnT hearts. (j–k′) Immunostaining of incorporated BrdU in E16.5 WT (j,j′) and Jag1flox;cTnT-Cre heart sections (k,k′). Arrowheads indicate BrdU-positive nuclei (red). (l–m′) ISH of Gpr126 in E16.5 WT and Jag1flox;cTnT-Cre hearts. Arrowheads indicate endocardial expression. (n) Quantification of p21-, N1ICD- and BrdU-positive nuclei in E13.5 and E16.5 Jag1flox;cTnT ventricles. Data are mean ± s.d. (n = 6 WT and 6 mutant embryos, except for E16.5 BrdU quantification, where n = 3 WT and n = 3 mutant embryos; *P < 0.01, by Student's t-test). Abbreviations as in Fig. 2. Scale bars, 100 μm. Source data are available in Supplementary Table 4.
Figure 4
Figure 4
Myocardial Jag2, together with Jag1, is required for ventricular maturation and compaction. (a) ISH of Jag2 in heart sections from E10.5, E12.5, E14.5, E16.5 WT and E16.5 Jag2flox/flox;cTnT-Cre/+ (Jag2flox;cTnT-Cre) embryos. Abbreviations as in Fig. 1. cTnT-Cre-mediated deletion abrogates Jag2 expression in the myocardium but does not affect expression in coronary vessels (arrowheads). Chart shows relative ratios of Jag1 and Jag2 gene expression measured by qRT–PCR. Data are means ± s.d. (n=3 pools of 3 WT ventricles per pool for each stage analysed; **P < 0.01, ***P < 0.001, by Student's t-test; NS, not significant). (b–d′) H&E staining of E16.5 WT, Jag2flox;cTnT-Cre and Jag1flox;Jag2flox;cTnT-Cre hearts. The yellow bar in b′–d′ indicates the thickness of compact myocardium and the asterisk in c,d the defective ventricular septum. ivs, interventricular septum. (e) Chart showing quantification of compact myocardium thickness and complexity of trabecular myocardium in Jag2flox;cTnT-Cre and Jag1flox;Jag2flox;cTnT-Cre hearts. Data are mean ± s.d. (n = 9 sections from 3 WT and n = 9 sections from 3 Jag2flox;cTnT-Cre; n = 12 sections from 4 WT and n = 12 sections from 4 Jag1flox;Jag2flox;cTnT-Cre embryos; **P < 0.01, *** P < 0.001, determined by Student's t-test; NS, not significant). (f–h) BrdU (green) and SMA (red) immunostaining in E13.5 WT (f), Jag2flox;cTnT-Cre (g) and Jag1flox;Jag2flox;cTnT-Cre hearts (h). Nuclei are counterstained with DAPI (blue). (i–k) N1ICD immunostaining. In the E16.5 WT heart (i), N1ICD (red) labels endocardial nuclei (yellow arrowheads) delineated by endomucin staining (green), and coronary vessels (white arrowheads). Jag2flox;cTnT-Cre (j) and Jag1flox;Jag2flox;cTnT-Cre hearts (k) show below-normal N1ICD expression. (l) Quantification of BrdU- and N1ICD-positive cells in both genotypes. Data are mean ± s.d. (n = 3 WT and n = 3 Jag2flox;cTnT-Cre for BrdU and N1ICD stainings; n = 3 WT and n=4Jag1flox;Jag2flox;cTnT-Cre embryos for BrdU and N1ICD analyses; *P < 0.05, **P < 0.01, by Student's t-test; NS, not significant). (m–u) ISH analysis. Hey2 marks compact myocardium (CM, yellow bar) in m,p,s. The red and green bars in p,s mark the trabecular (TM) and intermediate myocardium (IM) respectively. Bmp10 labels TM in WT (n), Jag2flox;cTnT-Cre (q) and Jag1flox;Jag2flox;cTnT-Cre ventricles (t). (o,r,u) Gpr126 transcription. rv, right ventricle. Scale bars, 100 μm. Source data are available in Supplementary Table 4.
Figure 5
Figure 5
MFng modulates Notch selectivity towards its ligands and systemic Fng abrogation disrupts coronary vessel development. (a) ISH analysis of MFng. Arrowheads point to expression in chamber endocardium (E8.5–10.5) and avc (E11.5). (b) Relative MFng expression by qRT–PCR from E8.5–11.5 ventricles. Data are means ± s.d. (n = 3 pools of 5 WT hearts at E8.5, and n = 3 pools of 3 ventricles per pool at E9.5–11.5, *P < 0.05, **P < 0.01, by Student's t-test). (c) Notch signalling activity measured by 10xCBF1–Luc reporter assay in MEVEC infected with control GFP lentivirus (GFP-MEVEC, black bars) or with a MFng lentivirus (MFng-MEVEC, grey bars) and stimulated with immobilized Notch ligands. Control represents the activity of the Notch reporter in non-stimulated MEVEC. (d) qRT–PCR analysis of Hey1 expression in GFP-MEVEC (black bars) or MFng-MEVEC (grey bars). Symbols: *, significant difference compared with Dll4; #, compared with Jag1. Data are mean ± s.d. (n = 4 independent biological replicates for each condition in c, and n = 3 for each condition in d; *, #P < 0.05, ## P < 0.01, ***, ### P < 0.001 by Student's t-test; NS, not significant). These data are representative of 3 independent experiments. (e–f′) H&E staining of E16.5 WT (e,e′) and M;L;RFng-deficient hearts (M−/−;L−/−;R−/− f,f′). The yellow bar in e′,f′ indicates the thickness of compact myocardium and the arrow in e′ points to a coronary vessel. (g,h) WT (g) and M−/−;L−/−;R−/− (h) ventricular sections stained with SMA (myocardium, red) and CD31 (Pecam1) (green), which labels the endocardium (arrowheads) and the endothelium of coronary vessels (arrows). (i–j′) N1ICD (red) stains chamber endocardium (i,j, arrowheads) and coronary vessels (i′–j′, arrows), co-stained with isolectin B4 (IB4, green). Nuclei are counterstained with DAPI (blue). (k) Quantification of compact myocardium thickness (CZ, myocardial compact zone) and trabecular myocardium complexity in E16.5 M−/−;L−/−;R−/− mice. Data are mean ± s.d. (n = 3 WT and n = 3 triple mutant embryos, ***P < 0.001, by Student's t-test; NS, not significant). (l,m) ISH analysis of Hey2 and Cx40 (l) and Dll4, Hey1, HeyL and EfnB2 (m) expression in WT and M−/−;L−/−;R−/− mice. Scale bars, 100 μm, except in g–j′ where scale bars are 50 μm. Source data are available in Supplementary Table 4.
Figure 6
Figure 6
Forced MFng expression in the endocardium disrupts chamber development. (a) ISH showing MFng expression in coronary vessel endothelium (arrowheads) but not in endocardium (arrows) of E14.5–16.5 WT embryos, and ectopic MFng expression in endocardium (arrows) and in coronary vessels endothelium (arrowheads) of MFngtg;Tie2-Cre embryos. (b) Gene targeting strategy used to generate the conditional MFngtg line. (c) Whole-mount two-photon microscopy image of an E9.5 MFngtg/+;Tie2-Cre/+ embryo. (c′) Heart detail showing transgenic expression. (d–e′) H&E staining of E16.5 WT and MFngtg/tg;Tie2-Cre/+ (MFngtg;Tie2-Cre) ventricles. MFngtg;Tie2-Cre hearts show defective ventricular septum (e, asterisk). The yellow bar in d′,e′ marks the thickness of compact myocardium. (f,g) BrdU (green) and SMA (red) staining in E13.5 WT (f) and MFngtg;Tie2-Cre hearts (g). Nuclei are counterstained with DAPI (blue). (h–i″) Postnatal day 1 (P1) heart stained with wheat-germ agglutinin (WGA) and endomucin. The yellow bar in h′-i″ marks the thickness of compact myocardium. (j–k′) General view of the E16.5 WT (j) and MFngtg;Tie2-Cre hearts (k) stained for N1ICD and endomucin. N1ICD is expressed in WT endocardium (j′, yellow arrowheads) and coronaries (j′, white arrowhead) and very attenuated in the transgenic heart (k′). (l–q) ISH. Hey2 expression reveals a thick compact myocardium in the E16.5 WT heart (l) and a very thin and disorganized counterpart in the MFngtg;Tie2-Cre heart (m). Bmp10 and Cx40 label ventricular trabeculae in WT embryos (n,p) and both are expressed at the distal tip of trabeculae in MFngtg;Tie2-Cre embryos (o,q, arrows). Cx40 is also expressed in WT coronaries (p, white arrow) but not in transgenic embryos (q). The arrowhead (m,o,q) marks the transition between Bmp10,Cx40 and Bmp10+,Cx40+ trabeculae. The red and yellow bars (l–q) mark the trabecular (TM) and compact myocardium (CM) and the green bar (m,o,q) marks the intermediate (IM) myocardium. Scale bars, 100 μm except in b,b′, where bars, 50 μm. (r) Quantification of ventricular morphological parameters of E16.5 WT (n = 3) and MFngtg;Tie2-Cre (n = 4) embryos. (s) BrdU-positive nuclei/total in E13.5 WT and MFngtg;Tie2-Cre hearts (n = 3 WT and n = 3 transgenic). (t) Quantification of N1ICD-positive nuclei in E16.5 WT (n = 3) and transgenic (n = 3) hearts. Data are mean ± s.d. *P < 0.05, ***P < 0.001, by Student's t-test; NS, not significant. Source data are available in Supplementary Table 4.
Figure 7
Figure 7
Comparative expression profiling of Jag2flox;cTnT-Cre, Jag1flox;cTnT-Cre, Jag1flox;Jag2flox;cTnT-Cre, MFngGOF;Tie2-Cre (MFngtg;Tie2-Cre) and Mib1flox;cTnT-Cre mutants. GOF, gain of function. (a) Chart indicating the total number of deregulated genes identified by RNA-seq (P < 0.05) in E15.5 Jag2flox;cTnT-Cre mutants (J2;cTnT-Cre), Jag1flox;Jag2flox;cTnT-Cre mutants (J1;J2;cTnT-Cre) and MFngGOF;Tie2-Cre transgenic embryos (MFngGOF;Tie2-Cre). The total number of differentially expressed genes per genotype is indicated at the top of every column. Numbers in the yellow section indicate upregulated genes; numbers in the blue section indicate downregulated genes. (b) Venn diagram representation of the comparative analysis of the deregulated genes in the five genotypes analysed (Jag1flox;cTnT-Cre, Jag2flox;cTnT-Cre, Jag1flox;Jag2flox;cTnT-Cre, MFngGOF;Tie2-Cre and Mib1flox;cTnT-Cre). Top, comparison of J1 and J2 single and J1;J2;cTnT-Cre double mutants. Bottom, comparison of J1;J2;cTnT-Cre, Mib1;cTnT-Cre and MFngGOF;Tie2-Cre embryos. Numbers in black indicate the total number of genes common to at least two genotypes. (c) Heat map representation of the 372 genes differentially expressed in at least two of the five mutant genotypes. Yellow, upregulated; blue, downregulated; black, not significant change. (d) Subsets of genes clustered into functional classes (right panels). The total number of deregulated genes for each genotype and the genes represented in the heat map can be found in Supplementary Table 1.
Figure 8
Figure 8
Sequential Notch ligand–receptor activation during ventricular chamber development. In the early ventricle (1) endocardial Dll4 and myocardial Jag1 can activate Notch1 in the endocardium. Expression of MFng in the endocardium favours Dll4 signalling to Notch1 (large green arrow) and Jag1 signalling is low (small blue arrow). Notch1 activation (red) promotes cardiomyocyte proliferation, trabecular growth and patterning. As chamber development proceeds (2), endocardial MFng expression reduces progressively (similarly to Dll4) allowing myocardial Jag1 to activate Notch1 in the myocardium. Jag2 expression is progressively upregulated in chamber myocardium, where it acts together with Jag1 to promote chamber proliferation, patterning and trabecular compaction to give rise to the functional ventricular wall (large blue arrow). At this time, MFng and Dll4 are required for Notch1 activation in coronary vessels (small green arrow). Inactivation of Jag1 (or Jag2) in the myocardium disrupts chamber maturation and leads to cardiomyopathy. Mib1 acts upstream of Jag1 and Jag2 in this process: Mib1 inactivation in the myocardium causes LVNC. A similar phenotype is produced when both Jag1 and Jag2 are deleted in the myocardium and when MFng is constitutively expressed in the endocardium (presumably causing persistent inhibition of Jag1 and Jag2 signalling). LOF, loss of function.

Comment in

References

    1. Sedmera D, Pexieder T, Vuillemin M, Thompson RP, Anderson RH. Developmental patterning of the myocardium. Anat. Rec. 2000;258:319–337. - PubMed
    1. Moorman AF, Christoffels VM. Cardiac chamber formation: development, genes, and evolution. Physiol. Rev. 2003;83:1223–1267. - PubMed
    1. Tevosian SG, et al. FOG-2, a cofactor for GATA transcription factors, is essential for heart morphogenesis and development of coronary vessels from epicardium. Cell. 2000;101:729–739. - PubMed
    1. Wu B, et al. Endocardial cells form the coronary arteries by angiogenesis through myocardial-endocardial VEGF signaling. Cell. 2012;151:1083–1096. - PMC - PubMed
    1. Wessels A, Sedmera D. Developmental anatomy of the heart: a tale of mice and man. Physiol. Genomics. 2003;15:165–176. - PubMed

Publication types

MeSH terms