. 2016 Feb;18(2):145-56.
doi: 10.1038/ncb3282. Epub 2015 Dec 7.

Human keratinocytes have two interconvertible modes of proliferation

Affiliations

Human keratinocytes have two interconvertible modes of proliferation

Amit Roshan et al. Nat Cell Biol. 2016 Feb.

Abstract

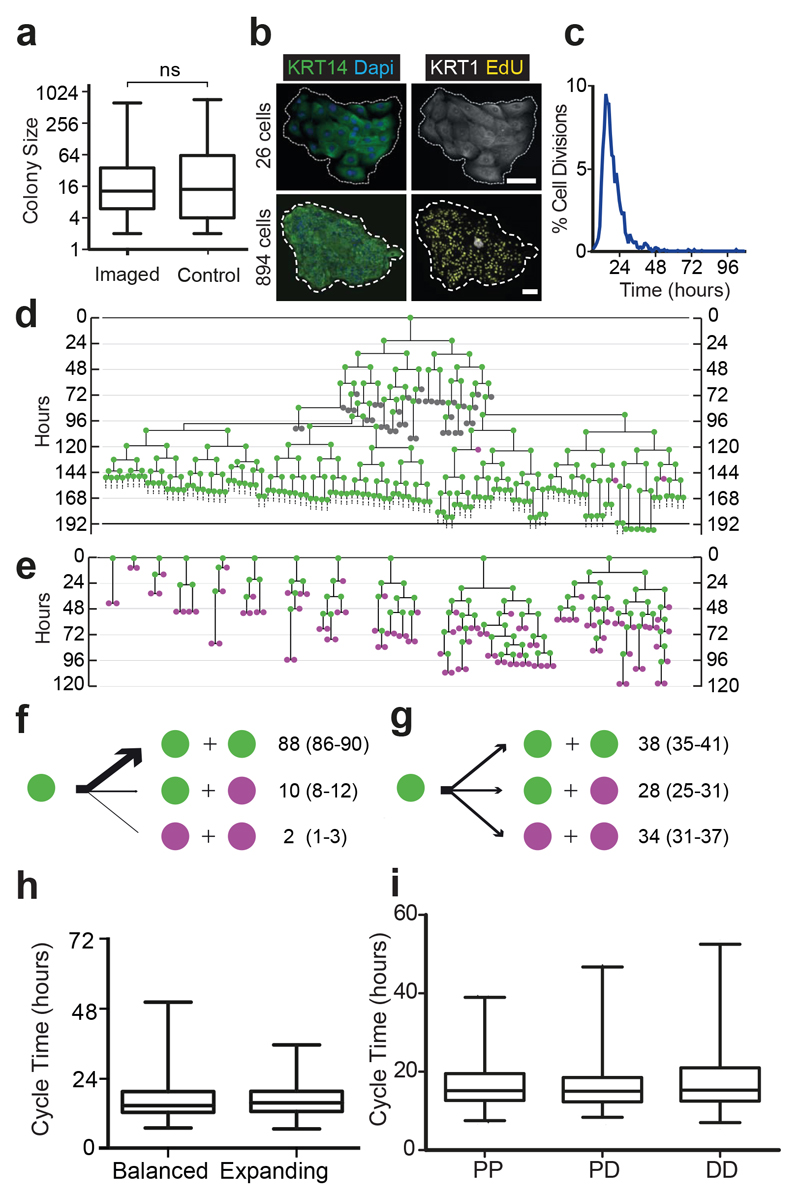
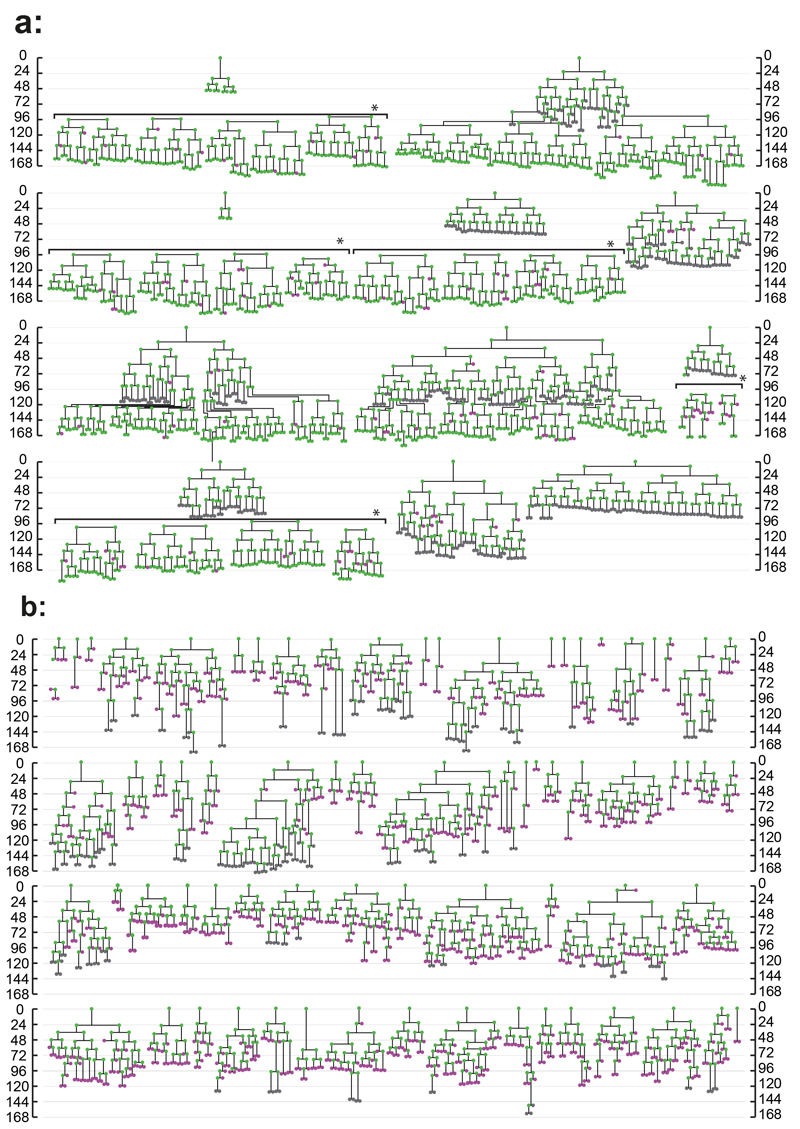
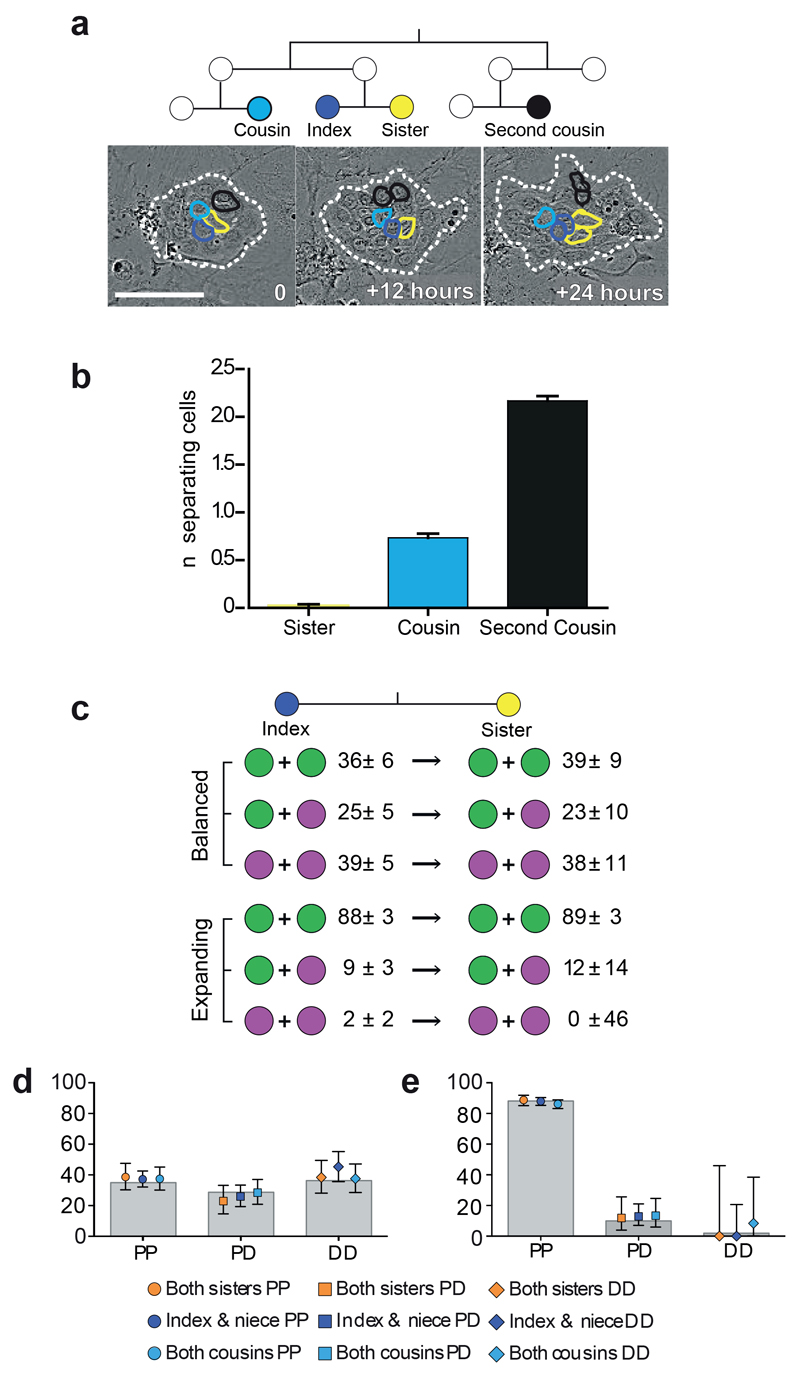
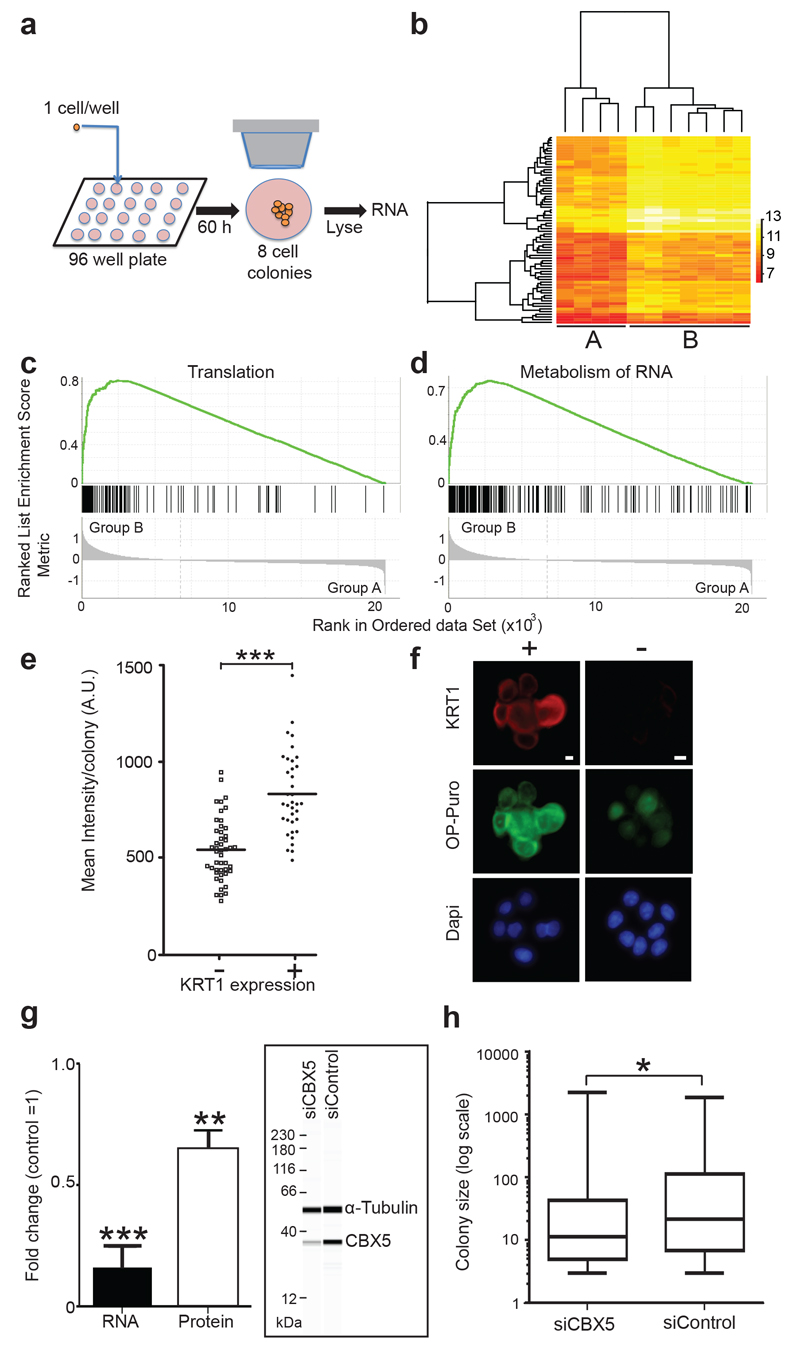
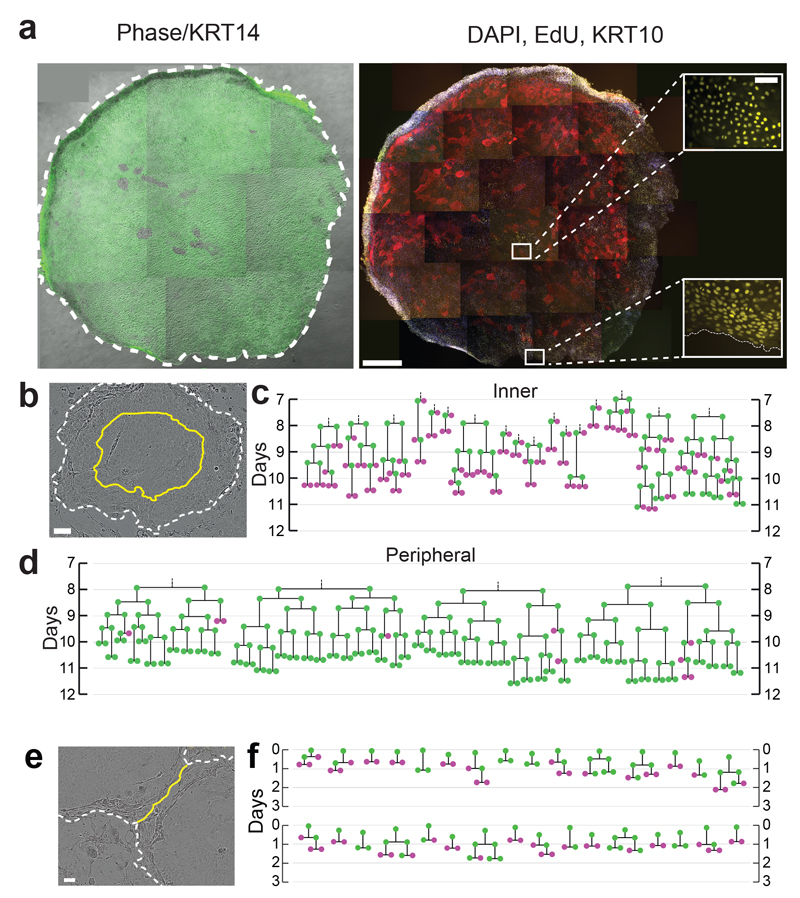
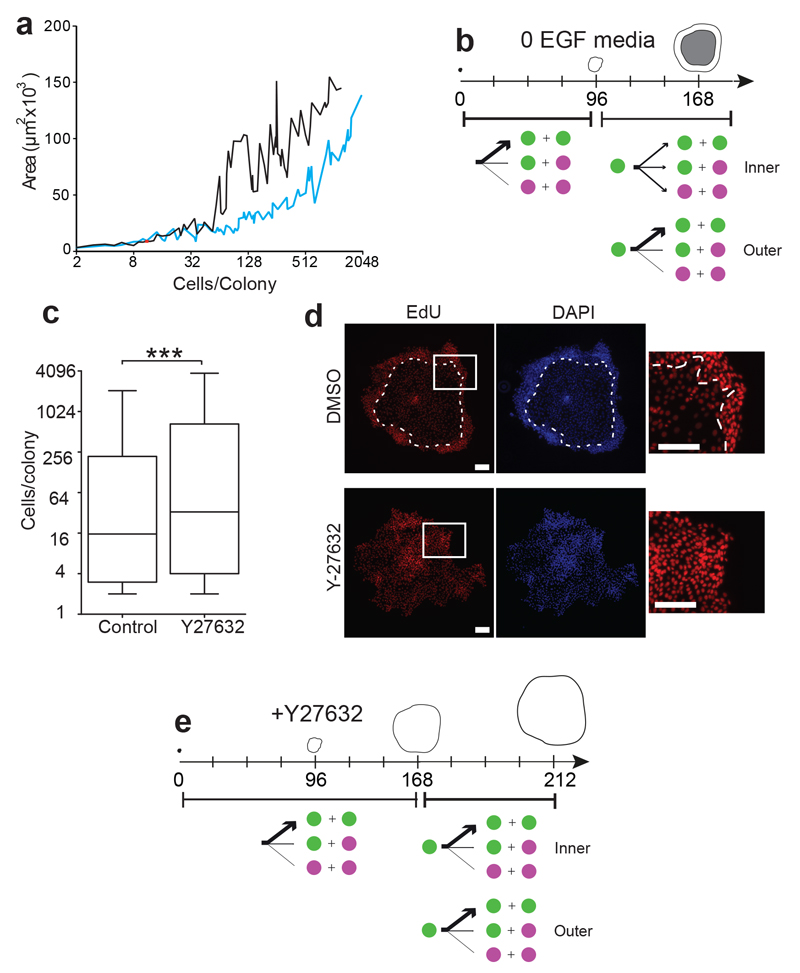
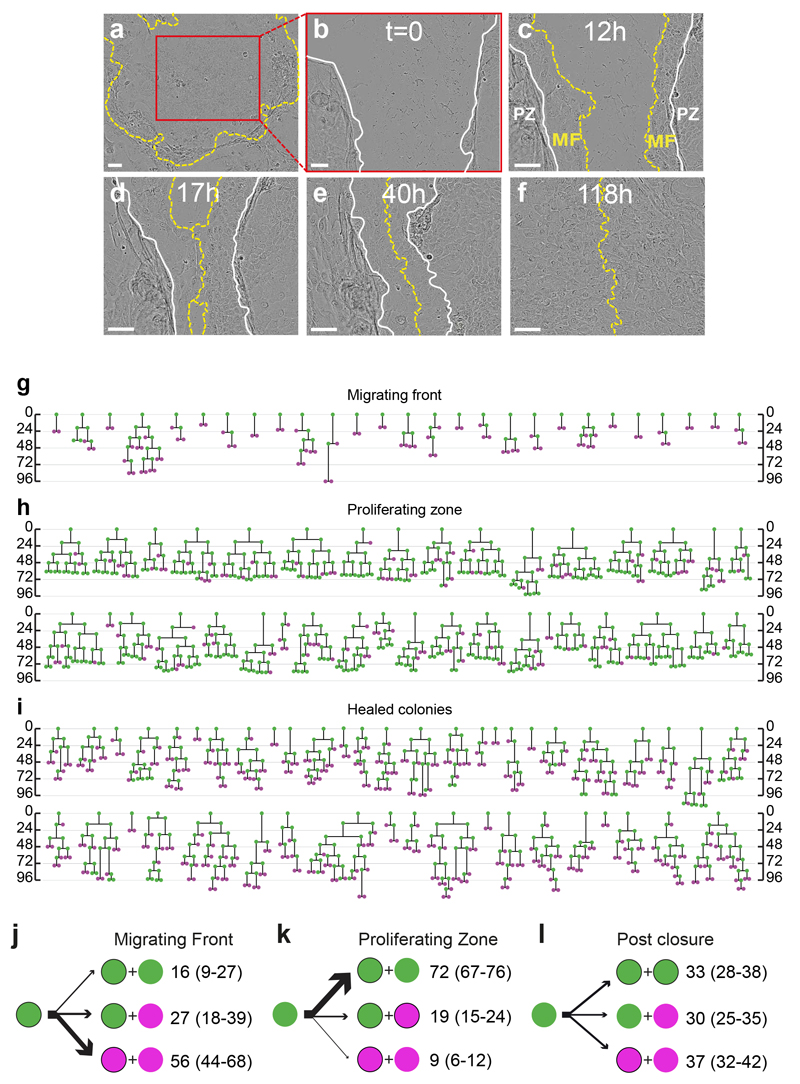
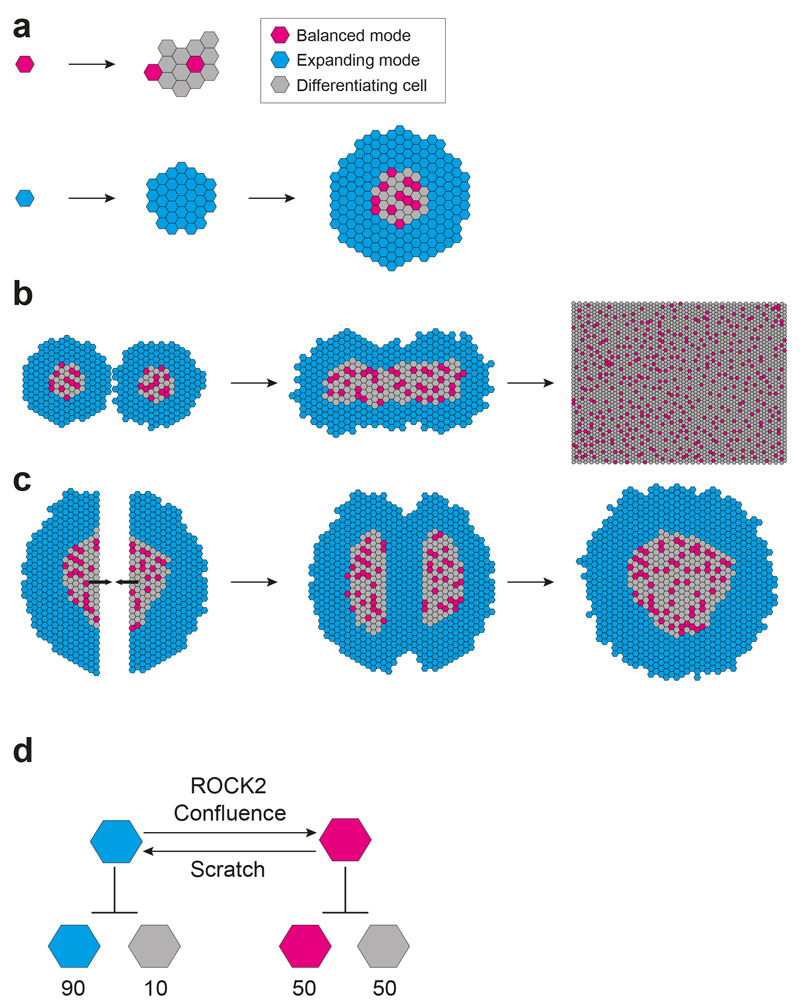
Single stem cells, including those in human epidermis, have a remarkable ability to reconstitute tissues in vitro, but the cellular mechanisms that enable this are ill-defined. Here we used live imaging to track the outcome of thousands of divisions in clonal cultures of primary human epidermal keratinocytes. Two modes of proliferation were seen. In 'balanced' mode, similar proportions of proliferating and differentiating cells were generated, achieving the 'population asymmetry' that sustains epidermal homeostasis in vivo. In 'expanding' mode, an excess of cycling cells was produced, generating large expanding colonies. Cells in expanding mode switched their behaviour to balanced mode once local confluence was attained. However, when a confluent area was wounded in a scratch assay, cells near the scratch switched back to expanding mode until the defect was closed. We conclude that the ability of a single epidermal stem cell to reconstitute an epithelium is explained by two interconvertible modes of proliferation regulated by confluence.


Conflict of interest statement

Competing Financial Interests

The authors declare no competing financial interests.

Figures

Figure 1
Figure 1. Live imaging of cultured keratinocytes.
a: Size distribution of live imaged (n=81) and non imaged control (n=1487) colonies after 7 days culture, in 3 independent experiments. Box boundaries indicate the 25th and 75th percentiles. Line across box is the median. Whiskers indicate 1st and 99th percentiles. There is no statistically significant difference between the distributions (p=0.15 Kolmogorov-Smirnov test). b: Typical colonies cultured for 6 days, treated with EdU and fixed 24 hours later,. White, differentiation marker KRT1; yellow, EdU; green, keratinocyte marker KRT14; blue, DAPI. Images representative of 3 independent experiments. Scale bar 100μm. c: Cycle times of 2127 live imaged cells from 3 independent experiments, median 15.7 hours, 99% of all divisions occur within 48 hours. d,e: Representative examples of two types of lineage trees, expanding, d, and balanced e, from 3 independent experiments. Dividing cells are green, non-dividing cells magenta and cells observed for <48 hours grey. See Figure 2a,b and Supplementary Table 1 for complete data set and Supplementary Videos 1 and 2 for example videos. f,g: Division outcomes in expanding (f, 928 divisions) and balanced colonies (g, 930 divisions), expressed as percentages with 95% confidence intervals. h Cell cycle time distributions in balanced and expanding colonies Box boundaries indicate the 25th and 75th percentiles. Line across box is the median. Whiskers indicate 1st and 99th percentiles. i The length of the preceding (maternal) cell cycle for daughter cells with each division outcome. Box boundaries indicate the 25th and 75th percentiles, line across box is the median. Whiskers indicate 1st and 99th percentiles. There is no significant difference between cycle time distributions for any division outcome (P=0.18 Kruskal-Wallis Test, n=1109 divisions for PP, 338 PD and 330 DD).
Figure 2
Figure 2. Lineage trees of Neonatal Foreskin Keratinocytes cultured at clonal density
Scale indicates time since plating in hours. Magenta indicates cells that did not divide within 48 hours, green cells which were observed to divide and grey cells those which could not be tracked for at least 48 hours. Horizontal brackets in a, marked by *, indicate representative cells tracked within a single colony. a: expanding trees, b: balanced trees, see text for details. A total of 81 trees from 3 independent experiments is shown.
Figure 3
Figure 3. Division outcomes of sister cells.
a: Time lapse images of a typical colony from 81 independent videos in 3 independent experiments (dashed white line), with related cells outlined as dark blue=index cell; yellow=sister; cousin=cyan; black=second cousin. Scale bar 100μm. b: Mean number of cells separating sisters (n=345 sister pairs), cousins (456 pairs) and second cousins (390 pairs), error bars indicate 95% confidence intervals, data from 3 independent experiments. c: Division outcomes (%, 95% confidence interval) in sister pairs in balanced (n=305 divisions) and expanding (n=415 divisions) colonies. d,e: Division outcomes in sister, cousin (balanced 413, expanding 689) and niece (balanced 617, expanding 782) cell pairs, data from 3 independent experiments. Legend indicates relationship and outcome, overlaid onto population averages (grey bars) for balanced, d, and expanding, e, lineages. Error bars indicate 95% confidence intervals.
Figure 4
Figure 4. Transcriptional analysis of colonies
a: Protocol: Single NFSK were flow sorted into individual wells of a cell culture plate, cultured for 60 hours, feeders removed, and entire 8 cell colonies lysed in situ. Following amplification cDNA was analysed by array analysis. b: Hierarchical clustering reveals two groups of colonies, A and B. Heat map shows transcripts with 2 fold or higher differential expression in 11 colonies (see also Supplementary Tables 4-6). c, d: Gene set enrichment analysis plots showing transcripts differentially expressed between groups A and B. Reactome ‘translation’ (c) and ‘metabolism of proteins’ (d) gene sets shown (nominal p values both <0.001, normalised enrichment scores 2.8 and 2.7 respectively, see also Supplementary table 7). e: Mean O-propargyl-puromycin (OP-Puro) fluorescence/colony after 60 hours of culture in colonies containing no (-) or one or more (+) cells expressing the differentiation marker KRT1. Typical example of 3 experiments shown, *** P<10-9 by t test (n=47 – and 36 + colonies, see also Supplementary Table 8). f: Appearance of typical colonies from one of 3 independent experiments stained for OP-Puro (green), KRT1 (red) and Dapi (blue), scale bars 10 μm. g: RNA and protein knockdown of CBX5 following siRNA transfection. Inset shows a typical quantitative capillary isoelectric focussing immunoassay. Mean of four independent experiments shown, *** p=0.0004 by t-test, ** p=0.0028 by t-test, n=4 independent experiments for both protein and RNA. h: Colony size distribution 7 days post CBX5 knockdown. Typical example of three independent experiments is shown, *p=0.02 by Kolmogorov-Smirnov test, n=139 control and 164 CBX5 colonies, details of other experiments are shown in Supplementary Table 9.
Figure 5
Figure 5. Expanding colonies switch towards balance
a: Typical large colony (12.5mm2 area) after 12 days of culture, treated with EdU for 24 hours prior to fixation. Left panel: Phase image overlaid with KRT14 staining green, right panel differentiation marker KRT10 (red), EdU (yellow), Dapi (Blue). Insets show EdU staining in centre and margin of colony. Image is representative of 3 independent experiments. Scale bars: main panels 0.5mm, insets 0.1mm. b: Still from typical video from three independent experiments showing colony after 9 days of culture. Inner third (by area) is bounded by yellow line, colony edge indicated by white dashed line, scale bar 100μm. c, d, lineage trees from inner third, c, and outer two thirds, d of colonies, derived from live imaging from 168-288 hours, dividing cells are green, non-dividing cells magenta. e: Still from typical video from 3 independent experiments showing margins of two fusing colonies (dashed lines). Yellow line indicates contact between keratinocytes in adjacent colonies, displacing overlying feeder cells, scale bar 100μm. f: lineage trees showing behaviour of cells within 7 cells of the colony edge at the time of fusion, derived from three independent videos of fusing colonies. Time is indicated from the first contact between colonies (5-9 days post plating), dividing cells are green, non-dividing cells magenta.
Figure 6
Figure 6. Cell density and ROCK2 kinase activity regulate the switch from expanding to balanced mode of proliferation.
a: Colony size in cells and area after 7 days culture in media with (EGF10, black) or without (EGF0, blue) supplemental EGF, data from 3 independent experiments. b: Summary of cell dynamics in EGF0 media. From 0 to 96 hours, all cells grow in expanding mode, but between 96 and 168 hours, cells switch towards balanced mode in inner two thirds of colonies, remaining in expanding mode at the colony rim. See also and Supplementary Figure 5 c, d and Supplementary Table 1. c: Size distribution of colonies cultured for 7 days in 10 μM ROCK2 inhibitor Y27632 compared with controls. Typical example of three independent experiments shown, ***p=0.0007 by Mann-Whitney Test, n=302 control and 293 Y27632 treated colonies. Box boundaries indicate the 25th and 75th percentiles. Line across box is the median. Whiskers indicate 1st and 99th percentiles. d: Fluorescence micrographs of typical large colonies from three independent experiments cultured for 7 days in standard (EGF10) media with 10μM Y27632 (1307 cells) or control (1207 cells), treated with EdU (red) for the final 24 hours of culture. DAPI is blue, white dashed line indicates boundary of stratified cell layer in DMSO colony (no stratification was seen in Y27632 treated colonies). Insets show distribution of EdU positive cells. Scale bars 100μm. e: summary of effect of Y27632 on expanding mode colonies, no switch to balanced mode behaviour is seen in the inner third of colonies cultured for up to 212 hours post plating. See also Supplementary Figure 6 a, and Supplementary Table 1.
Figure 7
Figure 7. Effects of loss of confluence on mode of proliferation in large colonies
a-f: Typical stills from large colonies (n=45 from 3 independent experiments), 9 days post seeding, scratched with a pipette tip. a: Immediately prior and b after scratch at T0. c: Typical appearance at 12 hours post scratch. Yellow dashed line indicates edge of scratch, MF migrating front, PZ proliferative zone, white solid line indicates boundary between MF and PZ. d: MF meet at 17 hours post scratch. e,f: Later images at 40 and 118 hours post scratch showing completion of repair. Scale bar 100⌠m. g-i: Lineage trees of proliferating cells in the centres of large colonies 9 days post plating subjected to scratching, g is from migrating front (62 divisions from 27 colonies in 3 independent experiments) and h proliferative zone pre scratch closure (346 divisions from 36 colonies in 3 independent experiments). 0 is time in hours since time of scratch in g and h. i shows trees of cell divisions post scratch closure (352 divisions from 45 colonies in 3 independent experiments, 0 hours is time of closure). j-l: Summary of cell behaviour, green indicates proliferating cells, magenta differentiating, non dividing cells, numbers are percentages of cells with a given division outcome with 95% confidence intervals in brackets. See also Supplementary Table 1 for full data set.
Figure 8
Figure 8. Two interconvertible modes of proliferation underpin epithelial reconstitution in vitro.
a: Keratinocyte proliferation in clonal culture. Small ‘paraclones’ and ‘meroclones’ with limited subclonal potential are derived from cells in balanced mode division (magenta cells) (2) large ‘holoclones’ and remaining ‘meroclones’ are derived from expanding mode divisions (cyan cells). Divisions at the centre of the holoclones switch from expanding to balanced divisions with local confluence. Grey cells represent differentiating keratinocytes, and suprabasal cells are omitted for clarity. b: Fusion of adjacent large colonies triggers a switch from expanding to balanced mode. As additional colonies fuse, a large sheet of keratinocytes results with the overall epithelium in balance. c: If the centre of a large colony is wounded, the central keratinocytes in balanced mode switch from balanced to expanding mode to reepithelialise the defect, and revert to balanced divisions when the gap is closed. d: Two interconvertible modes of proliferation. The average division outcomes of balanced and expanding mode cells are shown with the likelihood of each type of cell indicated as a percentage. Confluence promotes a switch from expanding to balanced mode, a process that requires ROCK2 activity. Loss of local confluence in a scratch assay results in a switch from balanced to expanding mode.

References

    1. Rheinwald JG, Green H. Serial cultivation of strains of human epidermal keratinocytes: the formation of keratinizing colonies from single cells. Cell. 1975;6:331–343. - PubMed
    1. Watt FM, Green H. Stratification and terminal differentiation of cultured epidermal cells. Nature. 1982;295:434–436. - PubMed
    1. Sato T, Clevers H. Growing self-organizing mini-guts from a single intestinal stem cell: mechanism and applications. Science. 2013;340:1190–1194. - PubMed
    1. Huch M, et al. Unlimited in vitro expansion of adult bi-potent pancreas progenitors through the Lgr5/R-spondin axis. Embo J. 2013;32:2708–2721. - PMC - PubMed
    1. Huch M, et al. In vitro expansion of single Lgr5+ liver stem cells induced by Wnt-driven regeneration. Nature. 2013;494:247–250. - PMC - PubMed

Publication types

MeSH terms