. 2016 Jan;48(1):22-9.
doi: 10.1038/ng.3461. Epub 2015 Dec 7.

Abundant contribution of short tandem repeats to gene expression variation in humans

Affiliations

Abundant contribution of short tandem repeats to gene expression variation in humans

Melissa Gymrek et al. Nat Genet. 2016 Jan.

Abstract

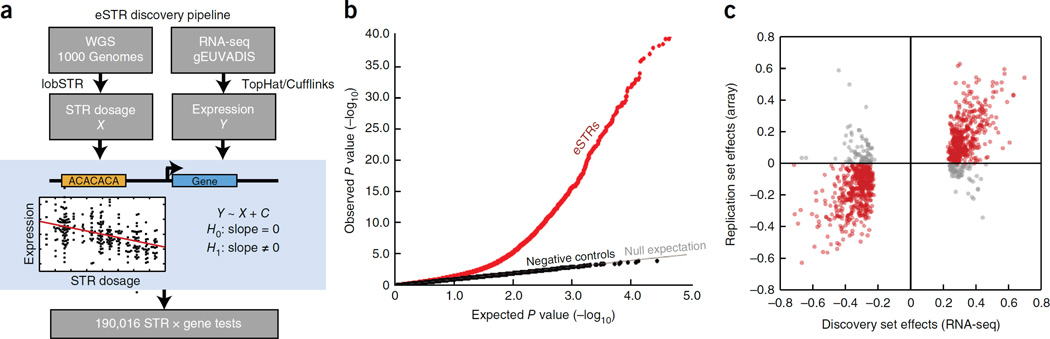
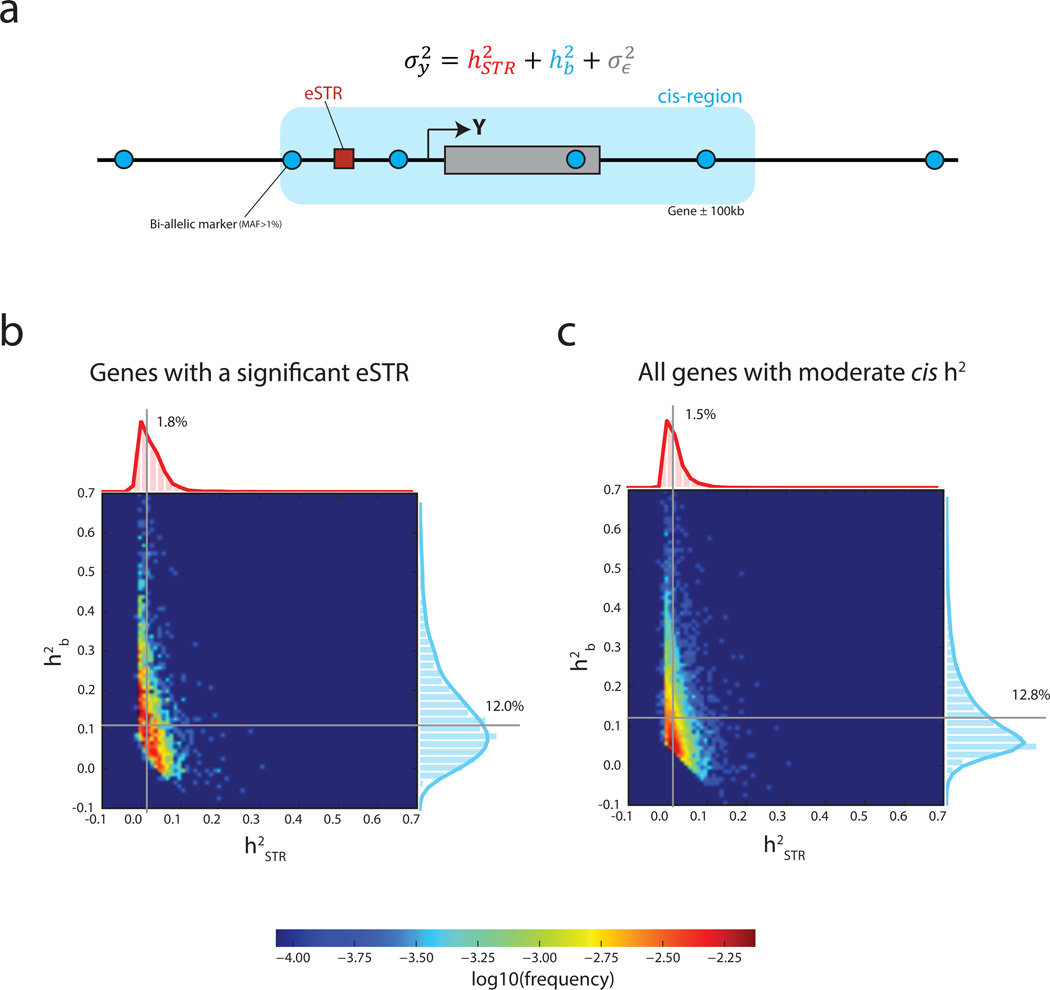
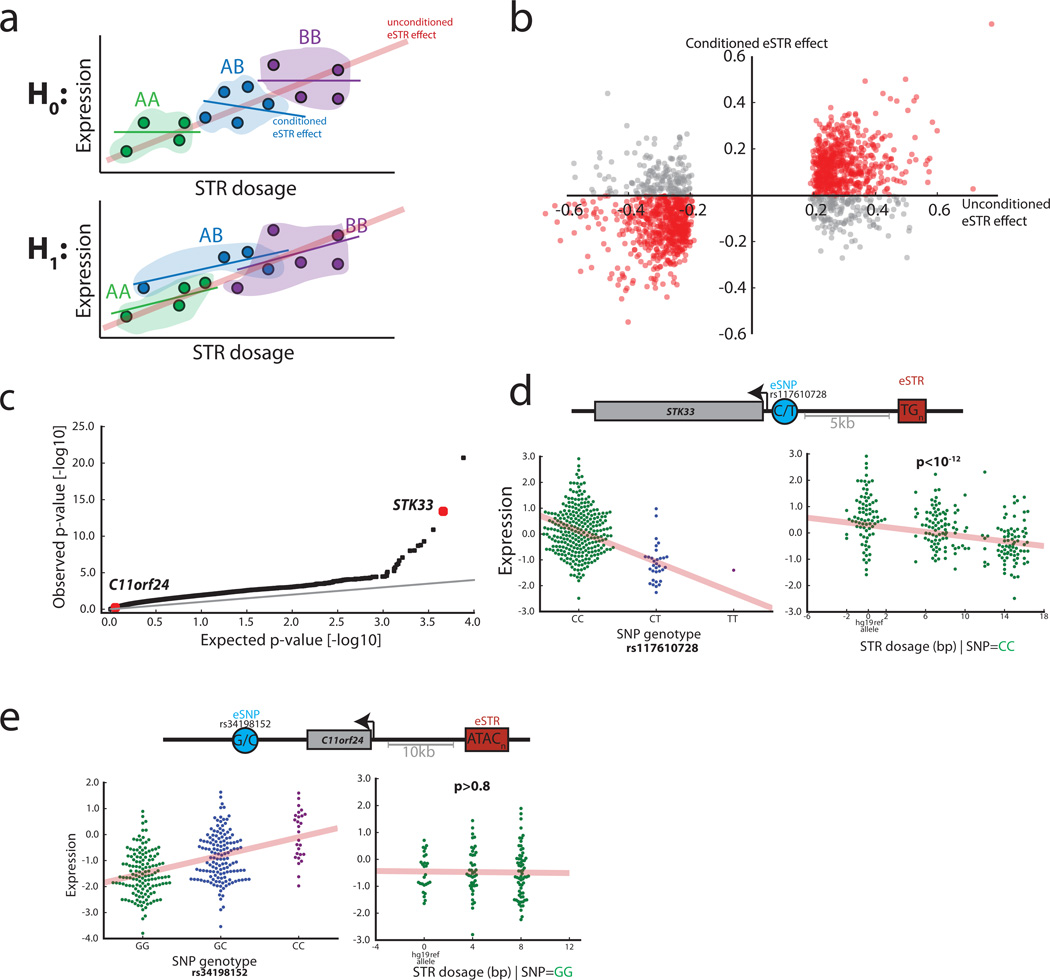
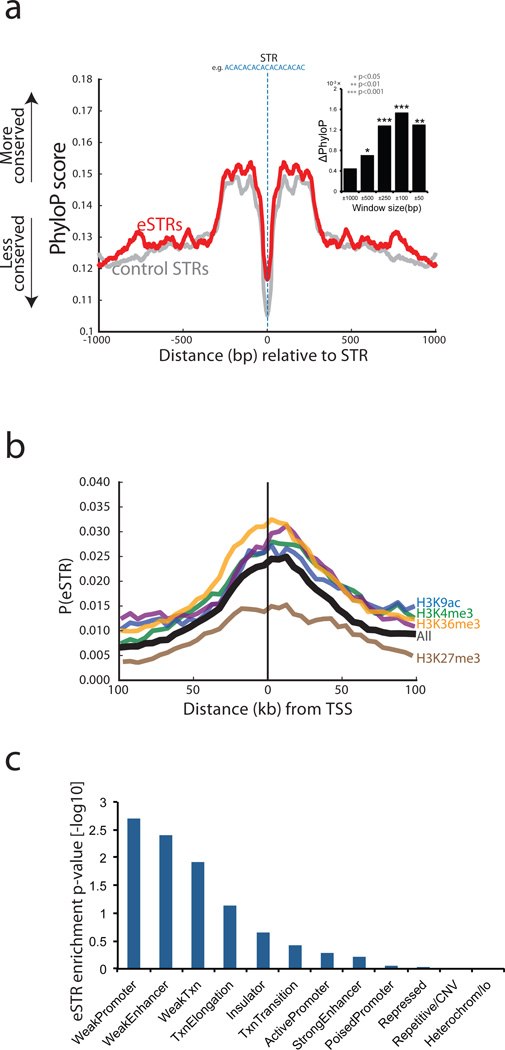
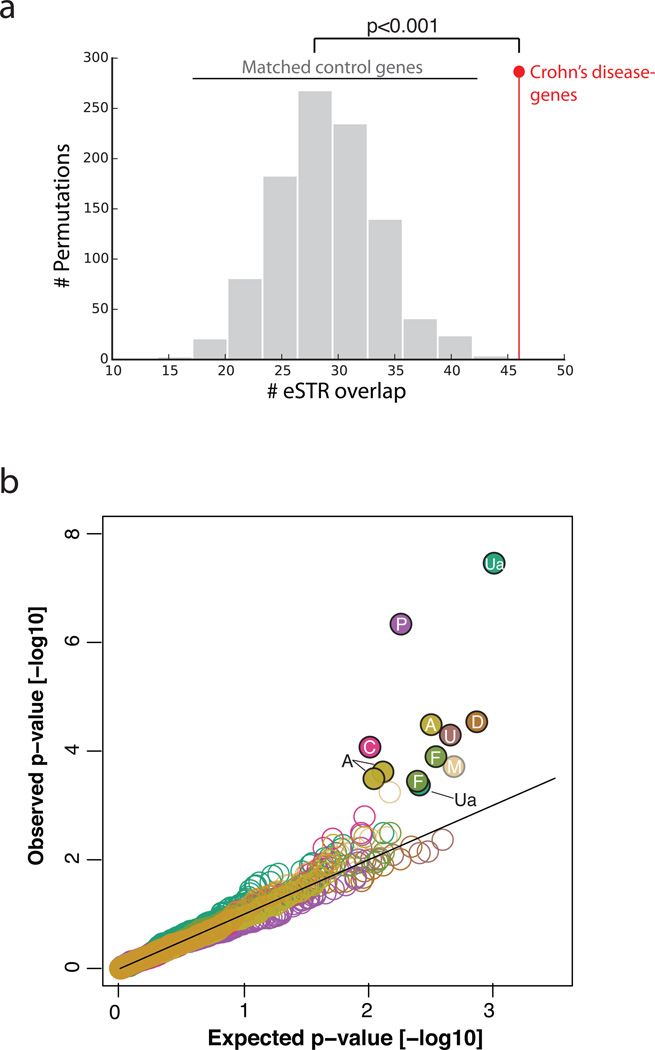
The contribution of repetitive elements to quantitative human traits is largely unknown. Here we report a genome-wide survey of the contribution of short tandem repeats (STRs), which constitute one of the most polymorphic and abundant repeat classes, to gene expression in humans. Our survey identified 2,060 significant expression STRs (eSTRs). These eSTRs were replicable in orthogonal populations and expression assays. We used variance partitioning to disentangle the contribution of eSTRs from that of linked SNPs and indels and found that eSTRs contribute 10-15% of the cis heritability mediated by all common variants. Further functional genomic analyses showed that eSTRs are enriched in conserved regions, colocalize with regulatory elements and may modulate certain histone modifications. By analyzing known genome-wide association study (GWAS) signals and searching for new associations in 1,685 whole genomes from deeply phenotyped individuals, we found that eSTRs are enriched in various clinically relevant conditions. These results highlight the contribution of STRs to the genetic architecture of quantitative human traits.


Figures

Figure 1
Figure 1. eSTR discovery and replication
(a) eSTR discovery pipeline. An association test using linear regression was performed between STR dosage and expression level for every STR within 100kb of a gene (b) Quantile-quantile plot showing results of association tests. The gray line gives the expected p-value distribution under the null hypothesis of no association. Black dots give p-values for permuted controls. Red dots give the results of the observed association tests (c) Comparison of eSTR effect sizes as Pearson correlations in the discovery dataset vs. the replication dataset. Red points denote eSTRs whose directions of effect were concordant in both datasets and gray points denote eSTRs with discordant directions.
Figure 2
Figure 2. Variance partitioning using linear mixed models
(a) The normalized variance of the expression of gene Y was modeled as the contribution of the best eSTR and all common bi-allelic markers in the cis region (±100kb from the gene boundaries) (bc) Heatmaps show the joint distributions of variance explained by eSTRs and by the cis region. Gray lines denote the median variance explained (b) Variance partitioning across genes with a significant eSTR in the discovery set and (c) Variance partitioning across genes with moderate cis heritability.
Figure 3
Figure 3. eSTR associations in the context of eSNPs
(a) Schematic of the eSTR effect versus the effect conditioned on the lead eSNP genotype. Under the null expectation, the original association (red line) comes from mere tagging of eSNPs. Thus, the eSTR effect disappears when restricting to a group of individuals (dots) with the same eSNP genotype (colored patches). Under the alternative hypothesis, the effect is concordant between the original and conditioned associations (b) The original eSTR effect versus the conditioned eSTR effect. Red points denote eSTRs whose direction of effect was concordant in both datasets and gray points denote eSTRs with discordant directions (c) Quantile-quantile plot of p-values from ANOVA testing of the explanatory value of eSTRs beyond that of eSNPs (d) STK33 is an example of a gene for which the eSTR (red rectangle) has a strong explanatory value beyond the lead eSNP (blue circle) based on ANVOA. When conditioning on individuals that are homozygous for the “C” eSNP allele (bottom left, green dots), the STR dosage still shows a significant effect (bottom right) (e) C11orf24 is an example of a gene for which the eSTR was part of the discovery set but did not pass the ANOVA threshold. After conditioning on individuals that are homozygous for the “G” eSNP allele (bottom left, green dots), the STR effect is lost (bottom right).
Figure 4
Figure 4. Conservation and epigenetic analysis of eSTR loci
(a) Median PhyloP conservation score as a function of distance from the STR. Red: eSTR loci, gray: matched control STRs. Inset: the difference in the PhyloP conservation score between eSTRs and matched control STRs as a function of window size around the STR. (b) The probability that an STR scores as an eSTR in the discovery set as a function of distance from the transcription start site (TSS). eSTRs show clustering around the TSS (black line). Conditioning on the presence of a histone mark (colored lines) significantly modulated the probability that an STR is an eSTR (c) The enrichment of eSTRs in different chromatin states.
Figure 5
Figure 5. Association of eSTRs with clinical phenotypes
(a) The overlap between eSTRs and Crohn’s disease GWAS genes (red) versus random subsets of genes (gray) matched on expression and heritability profiles in LCLs (b) quantile-quantile plots of eSTR associations in the TwinsUK data. Only traits with significant (FDR<0.1) associations are plotted. Closed circles: significant, open circles: non-significant. A: albumin; C: C-reactive protein; D: diastolic blood pressure, F: FVC, M: mean corpuscular volume, P: phosphate, U: Urea, Ua: Uric acid.

Comment in

Similar articles

Cited by

References

    1. Barrett JC, et al. Genome-wide association defines more than 30 distinct susceptibility loci for Crohn's disease. Nat Genet. 2008;40:955–962. - PMC - PubMed
    1. Moffatt MF, et al. Genetic variants regulating ORMDL3 expression contribute to the risk of childhood asthma. Nature. 2007;448:470–473. - PubMed
    1. Ardlie KG, et al. The Genotype-Tissue Expression (GTEx) pilot analysis: Multitissue gene regulation in humans. Science. 2015;348:648–660. - PMC - PubMed
    1. Nica AC, et al. Candidate causal regulatory effects by integration of expression QTLs with complex trait genetic associations. PLoS Genet. 2010;6:e1000895. - PMC - PubMed
    1. Nicolae DL, et al. Trait-associated SNPs are more likely to be eQTLs: annotation to enhance discovery from GWAS. PLoS Genet. 2010;6:e1000888. - PMC - PubMed

Publication types