Review
. 2015:17:385-414.
doi: 10.1146/annurev-bioeng-071114-040723.

Positron Emission Tomography: Current Challenges and Opportunities for Technological Advances in Clinical and Preclinical Imaging Systems

Affiliations
Review

Positron Emission Tomography: Current Challenges and Opportunities for Technological Advances in Clinical and Preclinical Imaging Systems

Juan José Vaquero et al. Annu Rev Biomed Eng. 2015.

Abstract

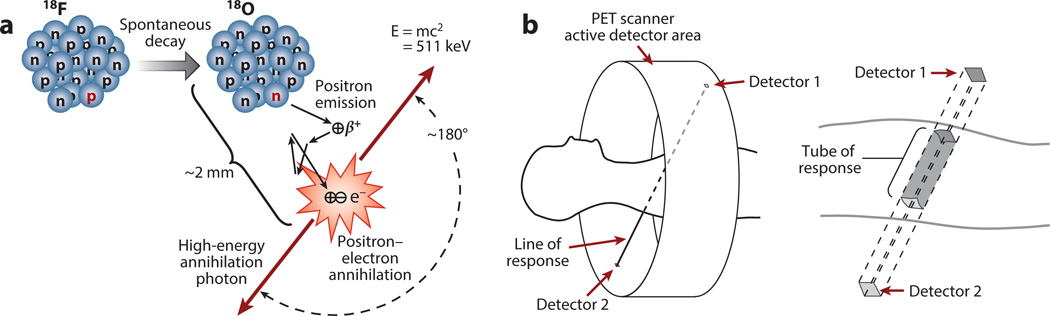
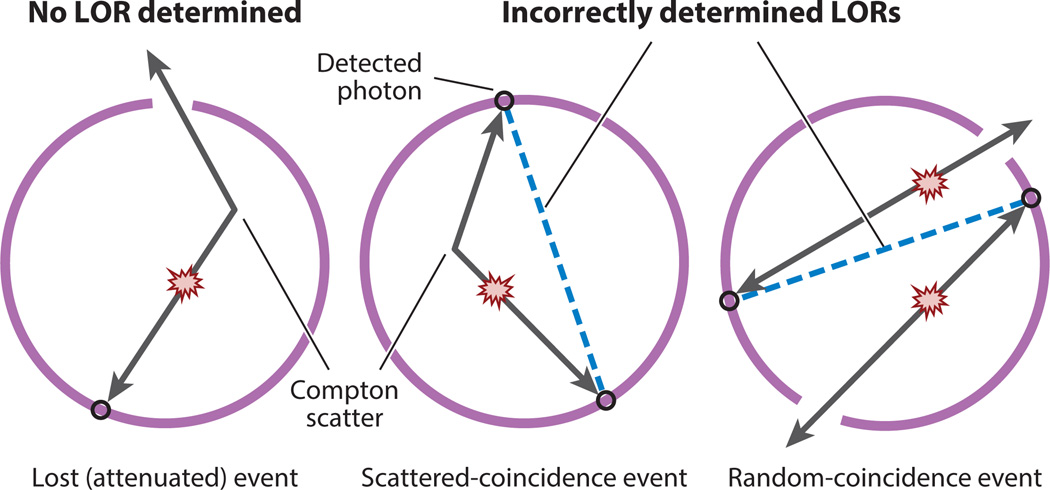
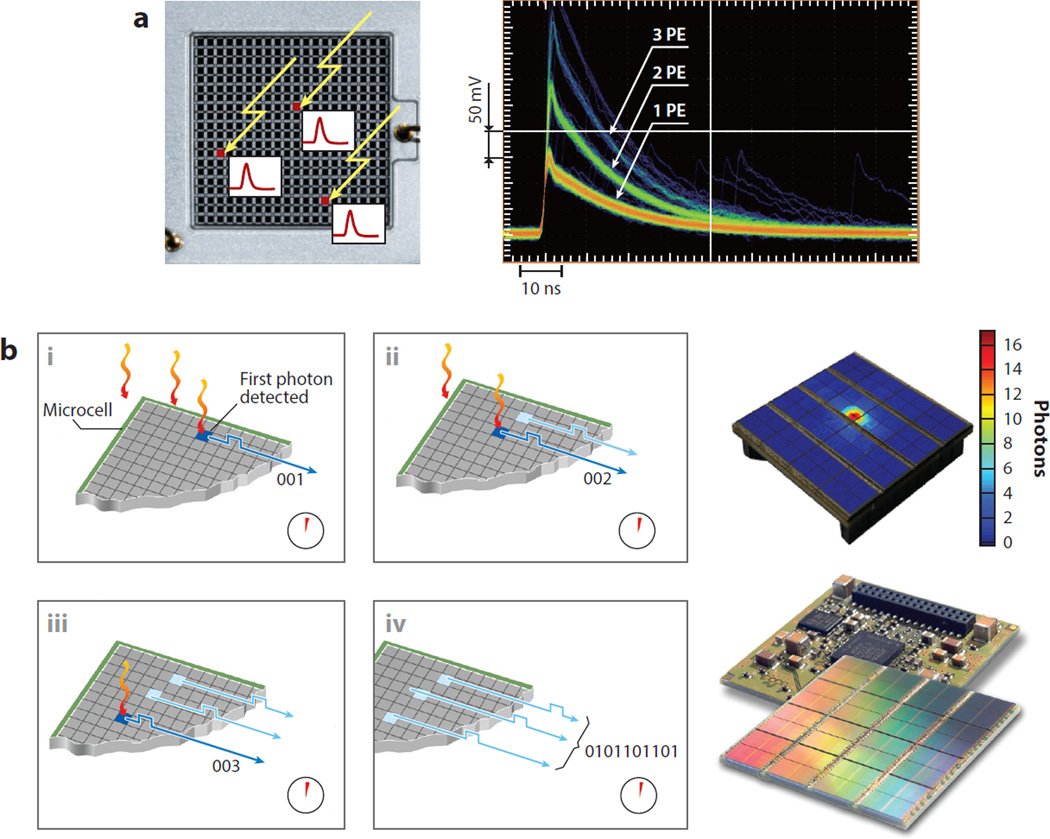
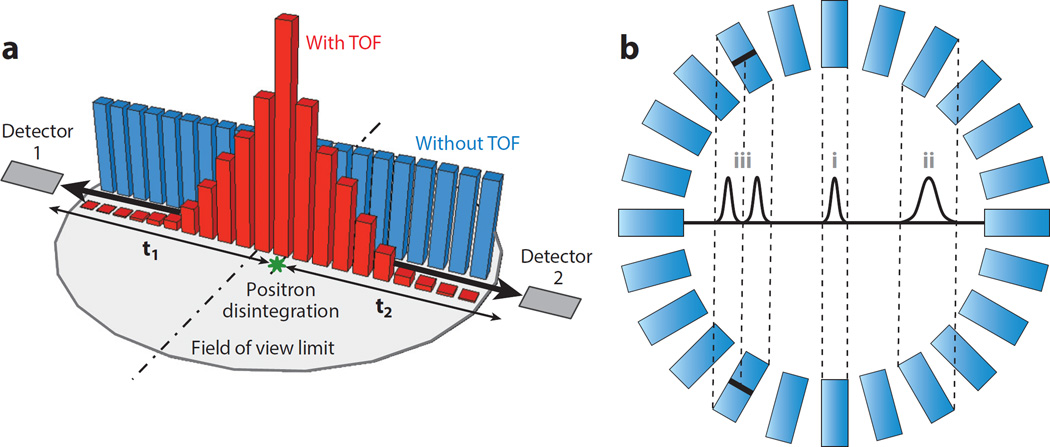
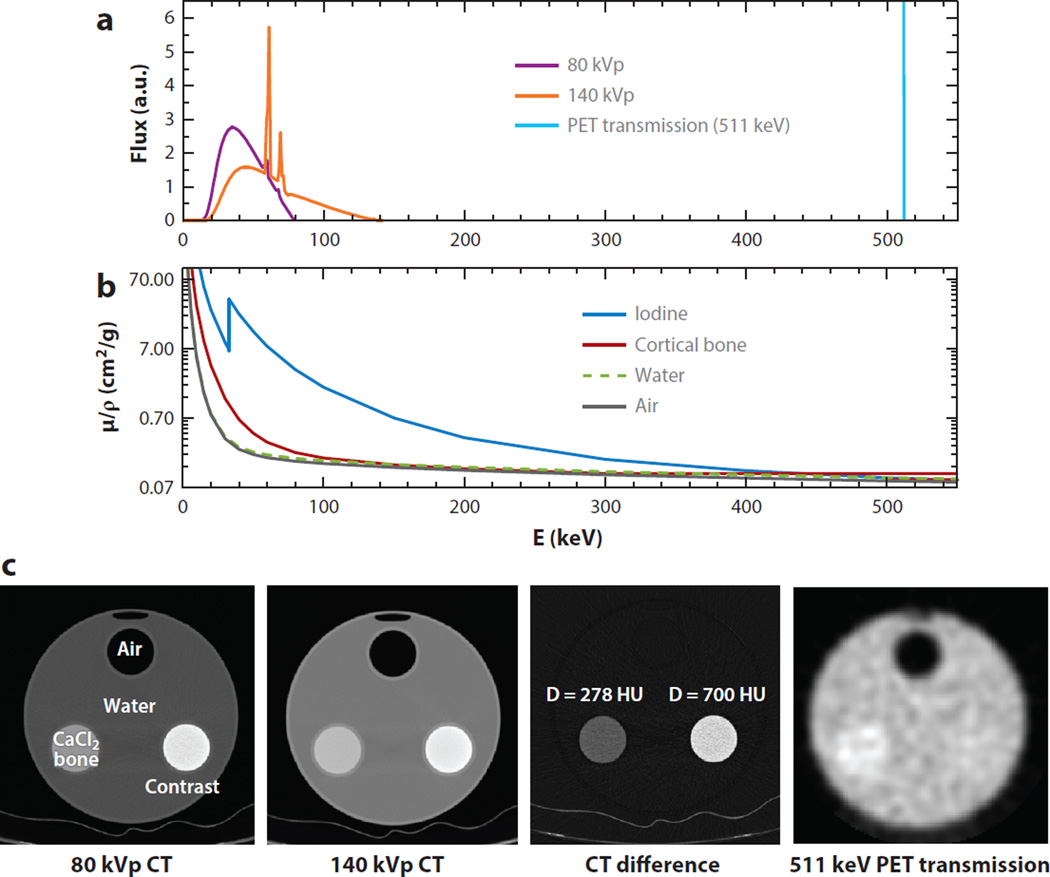
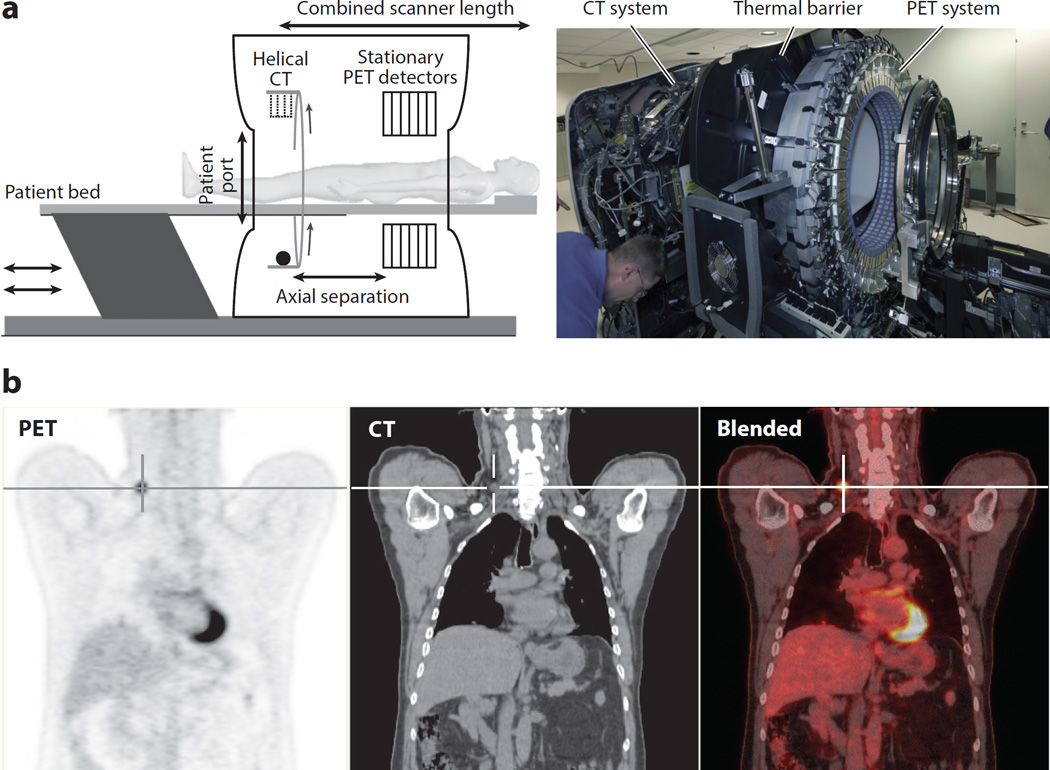
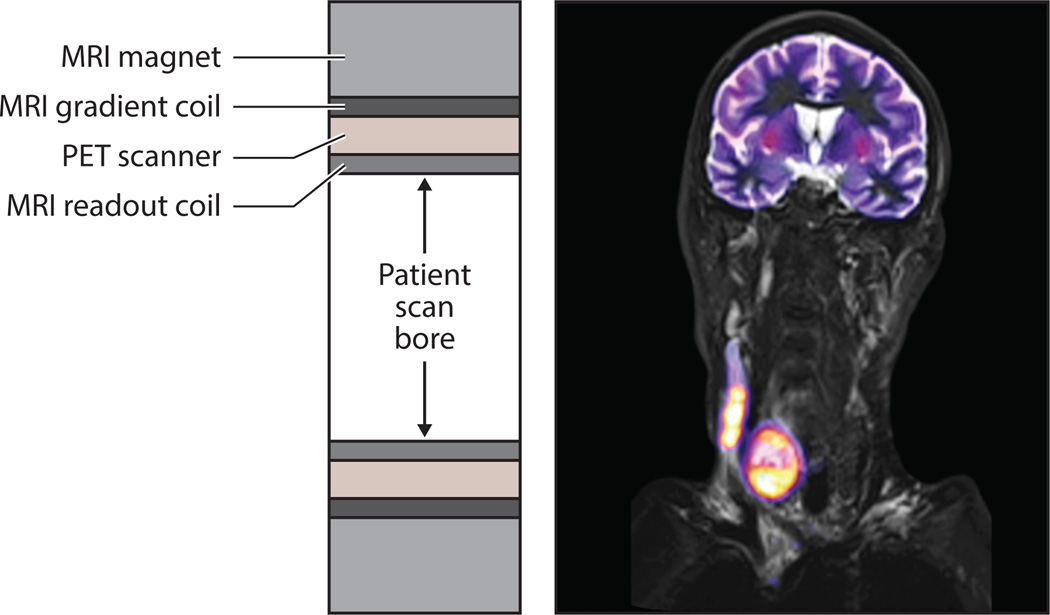
Positron emission tomography (PET) imaging is based on detecting two time-coincident high-energy photons from the emission of a positron-emitting radioisotope. The physics of the emission, and the detection of the coincident photons, give PET imaging unique capabilities for both very high sensitivity and accurate estimation of the in vivo concentration of the radiotracer. PET imaging has been widely adopted as an important clinical modality for oncological, cardiovascular, and neurological applications. PET imaging has also become an important tool in preclinical studies, particularly for investigating murine models of disease and other small-animal models. However, there are several challenges to using PET imaging systems. These include the fundamental trade-offs between resolution and noise, the quantitative accuracy of the measurements, and integration with X-ray computed tomography and magnetic resonance imaging. In this article, we review how researchers and industry are addressing these challenges.

Keywords: PET/CT; PET/MRI; multimodality kinetic modeling; silicon photomultipliers; system model; tomographic image reconstruction.


Figures

Figure 1
Figure 1
(a) Creation of two anticollinear 511 keV annihilation photons following positron emission by the radioactive decay of fluorine-18 (18F) (half-life, 110 min). The neutron-deficient 18F isotope decays to the stable isotope oxygen-18 (18O) by converting a proton to a neutron and thus emitting a positron (a process known as conservation of charge). After losing most of its kinetic energy via random scattering while traveling a short distance (i.e., the positron’s range is 2 mm in this case), the positron encounters its antiparticle, the electron. The resulting annihilation of both particles generates two 511 keV annihilation photons traveling in opposite directions. The small deviations from 180° are due to random variations in the residual momentum at the time of annihilation. (b) Schematic of the positron emission tomography (PET) imaging process. The patient is placed inside the gantry and surrounded by a ring of detectors that define the scanner’s active sensor area. When two annihilation photons are detected within a few nanoseconds of each other, the two points of interaction define a line of response. Because the detector’s elements have finite dimensions, the line of response schematically represents the ensemble of coincidences that fall inside the tube of response, which is defined by the size of the detector’s elements.
Figure 2
Figure 2
Confounding physical effects that cause bias in positron emission tomography (PET) coincidence imaging. (Left to right) Attenuation: One of the annihilation photons does not reach the detector either because it has undergone absorption or Compton scattering that deflects it away from the detectors or because it does not interact in a measureable way with a scanner detector. Scattered-coincidence event: One of the two photons undergoes Compton scattering and changes its trajectory, but both photons are still detected, thus defining an incorrect line of response (LOR). Random-coincidence event: Two simultaneous annihilations produce two pairs of photons; if for any reason two of the photons belonging to different annihilations are detected in a time coincidence, they will define a randomly oriented (i.e., incorrect) LOR.
Figure 3
Figure 3
(a) (Left) Semiconductor photodetectors using an ensemble of photodiodes; in this case, a matrix of 20 × 20 elements produces an electrical analog signal that is proportional to the number of scintillation photons reaching the sensor. The signal is built by adding the contributions of each individual photodiode avalanche. Three γ-rays impinging on the three red pixels will produce a signal (labeled as “3 PE”) that is the result of the addition of the three avalanches produced at each individual element. (Right) The output pulse is labeled in photoelectrons (PE). Images courtesy of Hamamatsu Photonics K.K. (Hamamatsu City, Japan). (b) In digital photocounters, each individual signal from each photodiode is treated as a discrete or integer (i.e., digital) increment. The time of arrival of the first scintillation photon at the digital semiconductor photodetector (i) marks the beginning of the period for counting the total number of arrivals during a given interval (ii). Once the period ends (iii), the total count of individual contributions becomes a digital number (iv) that is proportional to the number of photons reaching the detector, and that number, in turn, relates to the energy of the γ-photon that originated the scintillation. All processing is done using digital electronics. Drawings courtesy of Philips GmbH (Herrsching, Germany).
Figure 4
Figure 4
(a) The time of flight (TOF) is defined as the interval between the arrival (t1 and t2) at their respective detectors of the two photons resulting from the disintegration of the positron. Both photons travel at the speed of light, and if positron annihilation occurs at the midpoint of the line of response (LOR), t1 will be equal to t2. If that is not the case, then the time difference (t1-t2) can be translated into a distance from the LOR midpoint to the most probable annihilation point, and that will be the location where the probability density function should be centered (red) for the disintegration occurrence used in the reconstruction model, instead of using a less accurate uniform distribution (blue). (b) The detector sensitivity is directly proportional to the crystal thickness, but thicker crystals produce larger cross sections when the LOR defined by the two detectors in coincidence does not cross the detector ring center. The resulting effect is a deterioration in the effective resolution from the center (i) toward the edges (ii). The Gaussian profiles depict the LOR spatial response to a point source placed in the center of the cross section: The narrower the cross section, the better. A scintillator crystal that can estimate the depth of interaction (DOI) defines several LORs for the same non-DOI LOR. This is depicted here for a two-layered crystal that defines two narrower LORs (iii) instead of just one (ii). Black lines in the scintillator crystals indicate the separation between the front layer and the back layer.
Figure 5
Figure 5
(a) Computed tomography (CT) and positron emission tomography (PET) transmission energy spectra. The purple and orange spectra correspond to the typical polychromatic emission of a standard X-ray tube operating at 80 peak kilovoltage (kVp) and 140 kVp, respectively, and the monochromatic blue spectra is the 511 kV emission from one of the photons resulting from a positron–electron annihilation. (b) Mass attenuation coefficients µ/ρ (note the log scale) versus energy for four different media; notice the variations that occur as a function of the energy. (c) Measured attenuation images for a water cylinder with inserts containing air, a bone-equivalent calcium chloride (CaCl2) solution, and diluted iodine. The CT difference image in Hounsfield units (HU) and a PET transmission image done at 511 keV (from annihilation photon energy) show how the resulting attenuation image from which the attenuation map will be derived will differ unless the correct energy scaling is used.
Figure 6
Figure 6
General process for iterative tomographic image reconstruction. A key characteristic is the alternation back and forth between (left) the data space and (right) the image space. The process starts with the raw data acquired from positron emission tomography (PET) and an initial estimation of the reconstructed image, f(0), which can be derived from the acquired data, by assuming a uniform distribution, or by another method. The first image estimation is projected into the raw data space (i.e., it is a forward projection that simulates the data-acquisition process), and the result is compared with the measured PET data. Differences are used to calculate updates, which are projected back into the image space (i.e., back projection is the adjoint operation to forward projection). This produces an updated image estimate, f(1). The process is repeated until the difference in estimates of sequential images reaches a convergence criteria previously defined, or a preset number of iterations occurs. Although several hundred variations of iterative algorithms have been proposed, common approaches are now used.
Figure 7
Figure 7
Dynamic analysis of data from positron emission tomography (PET) is used to determine critical metabolic, transport, and proliferation variables. (Left) The standard protocol relies on delineating regions of interest (ROIs) on a summed PET image reconstructed using the imager model, or a coregistered anatomical image (from computed tomography or magnetic resonance). Time–activity curves (TACs) from the ROIs applied to previously reconstructed time-series images are extracted, and they become the input to the kinetic-modeling programs that estimate physiologically relevant parameters for each of the tissues defined in the kinetic model. The reconstruction step could be avoided by redefining the objective function used for the reconstruction process: In the standard indirect model, the objective function is the relationship between the projection data sets measured by the PET system and the 3D image sequence, and that information is contained in the imager model. (Right) In the direct estimation method, the new objective function relates the projection data sets measured by the PET imager to the kinetic parameters defined in the kinetic model. This new parametric model solves directly for the kinetic parameters and produces less noisy estimations of the physiological variables. Modified from a figure courtesy of Mark Muzi, University of Washington. Other abbreviations: AIF, arterial input function; CE, contrast-enhanced; NCE, non-contrast-enhanced.
Figure 8
Figure 8
Multi-isotope in vivo brain positron emission tomography and computed tomography (PET–CT) imaging. All images show the same approximate anatomical slice in the three orthogonal views (columns). CT image values are represented using a gray scale, and PET image values are represented using a rainbow color scale. (Top row) Standard PET image (using only double coincidences) from a rat injected with iodine-124 (124I)-β-CIT (dopamine transporters) and 18FDG (glucose metabolism). Because standard PET data processing does not allow signal multiplexing, the combined signal from both radiotracers is shown as a single, mixed image. (Middle row) Separated 18FDG signal obtained by multiplexed PET (mPET) showing homogeneous uptake in the brain and a high, nonspecific uptake in the Harderian gland (H), which is typical of this radiotracer. (Bottom row) Separated 124I-β-CIT signal obtained by mPET showing specific, dopamine transporter binding in the striatum (S) and nonspecific uptake in the thyroid glands (Th). The top row shows the result of adding information from the middle and bottom rows; mPET is capable of separating both independent components. Images courtesy of Stephen Moore, Brigham and Women’s Hospital, Boston.
Figure 9
Figure 9
(a) Schematic and photograph of a combined positron emission tomography and computed tomography (PET–CT) scanner used for clinical applications. Although the concept of aligning in tandem a CT scanner and a PET scanner is simple, the technical and practical complexities pose challenges that range from the footprint size of the resulting system to the spatial and temporal alignment of the resulting data sets. (b, left to right) The coronal view of a clinical 18FDG PET scan clearly shows a recurrent thyroid cancer tumor (crosshair), the CT image shows detailed anatomy in which the tumor is hardly distinguishable, and the blended image shows the precise anatomical localization (from the CT image) of the active tumor (from the PET image).
Figure 10
Figure 10
Simulated coronal slice of a human torso obtained by positron emission tomography (PET) illustrating the impact of respiratory motion effects during combined acquisition of PET and computed tomography (CT) data. (Left) If there is no motion, the lung tumor, liver boundaries, and the left ventricle of the heart are well delineated. (Right) However, when respiratory movement is present, the blurring and mismatches in attenuation correction introduce artifacts and numerical errors, which also obscure clinical evaluations.
Figure 11
Figure 11
(Left) Cross section along the patient scan axis for an integrated inline design used by clinical positron emission tomography–magnetic resonance (PET–MR) scanners. The PET detectors are placed between the different MR coils to reduce cross-system interference. (Right) PET–MR image of an anaplastic thyroid carcinoma formed from an MR T2-weighted turbo inversion recovery magnitude image showing high contrast in the soft tissue (gray) fused with an 18FDG PET image (color). Courtesy of Siemens Healthcare and University Hospital of Tubingen.

References

    1. Humm JL, Rosenfeld A, Del Guerra A. From PET detectors to PET scanners. Eur. J. Nucl. Med. Mol. Imaging. 2003;30(11):1574–1597. - PubMed
    1. Bacharach SL. Positron emission tomography. In: Dilsizian V, Pohost GM, editors. Cardiac CT, PET and MR. 2nd. Hoboken, NJ: Blackwell; 2010. pp. 3–29.
    1. Peng BH, Levin CS. Recent developments in PET instrumentation. Curr. Pharm. Biotechnol. 2010;11(6):555–571. - PMC - PubMed
    1. Van Eijk CWE. Radiation detector developments in medical applications: inorganic scintillators in positron emission tomography. Radiat. Prot. Dosimetry. 2008;129(1–3):13–21. - PubMed
    1. Moses WW. Recent advances and future advances in time-of-flight PET. Nucl. Instrum. Methods Phys. Res. A. 2007;580(2):919–924. - PMC - PubMed

Publication types