

The emergence of DNA in the RNA world: an in silico simulation study of genetic takeover
- PMID: 26643199
- PMCID: PMC4672488
- DOI: 10.1186/s12862-015-0548-1
The emergence of DNA in the RNA world: an in silico simulation study of genetic takeover
Abstract
Background: It is now popularly accepted that there was an "RNA world" in early evolution of life. This idea has a direct consequence that later on there should have been a takeover of genetic material - RNA by DNA. However, since genetic material carries genetic information, the "source code" of all living activities, it is actually reasonable to question the plausibility of such a "revolutionary" transition. Due to our inability to model relevant "primitive living systems" in reality, it is as yet impossible to explore the plausibility and mechanisms of the "genetic takeover" by experiments.
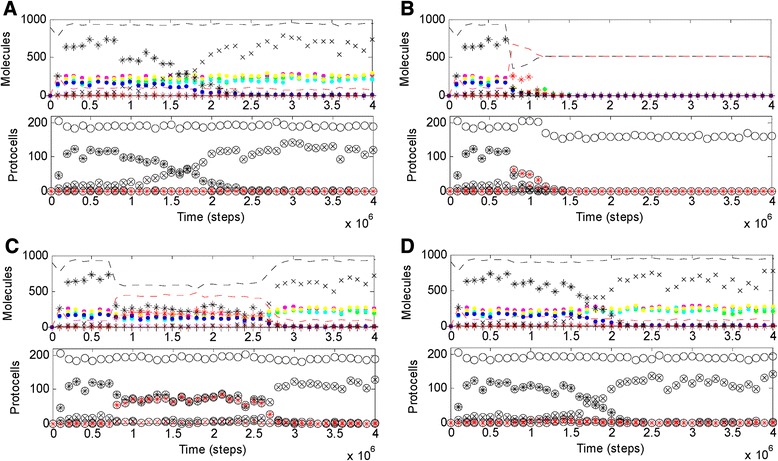
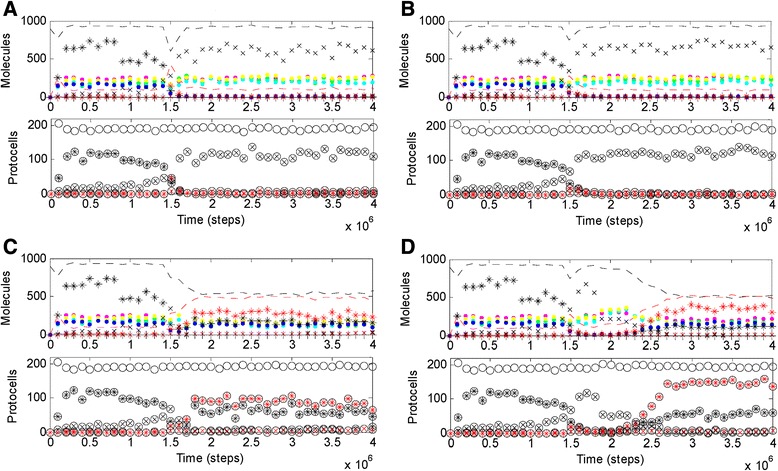
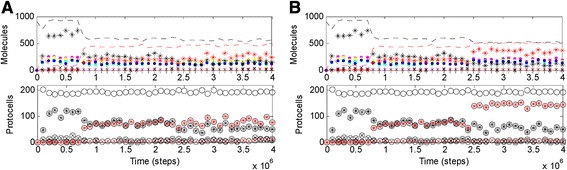
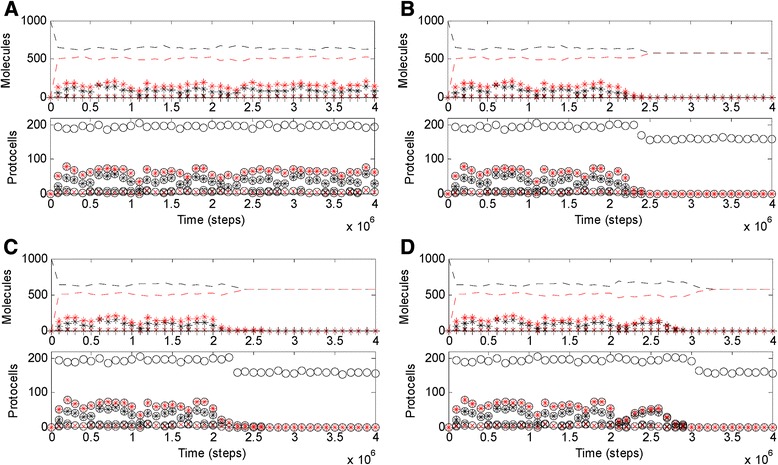
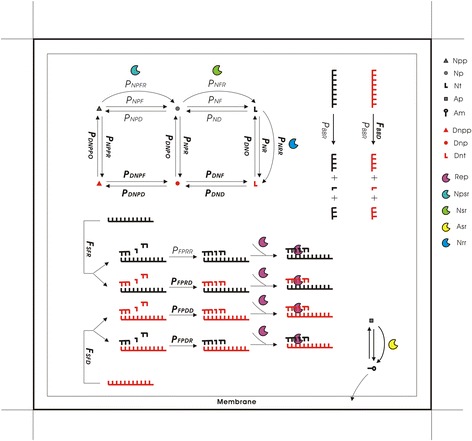
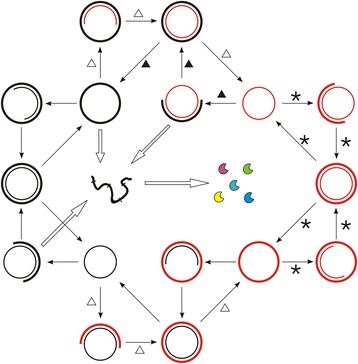
Results: Here we investigated this issue by computer simulation using a Monte-Carlo method. It shows that an RNA-by-DNA genetic takeover may be triggered by the emergence of a nucleotide reductase ribozyme with a moderate activity in a pure RNA system. The transition is unstable and limited in scale (i.e., cannot spread in the population), but can get strengthened and globalized if certain parameters are changed against RNA (i.e., in favor of DNA). In relation to the subsequent evolution, an advanced system with a larger genome, which uses DNA as genetic material and RNA as functional material, is modeled - the system cannot sustain if the nucleotide reductase ribozyme is "turned off" (thus, DNA cannot be synthesized). Moreover, the advanced system cannot sustain if only DNA's stability, template suitability or replication fidelity (any of the three) is turned down to the level of RNA's.
Conclusions: Genetic takeover should be plausible. In the RNA world, such a takeover may have been triggered by the emergence of some ribozyme favoring the formation of deoxynucleotides. The transition may initially have been "weak", but could have been reinforced by environmental changes unfavorable to RNA (such as temperature or pH rise), and would have ultimately become irreversible accompanying the genome's enlargement. Several virtues of DNA (versus RNA) - higher stability against hydrolysis, greater suitability as template and higher fidelity in replication, should have, each in its own way, all been significant for the genetic takeover in evolution. This study enhances our understandings of the relationship between information and material in the living world.
Figures
Similar articles
-
A simple template-dependent ligase ribozyme as the RNA replicase emerging first in the RNA world.Astrobiology. 2010 May;10(4):437-47. doi: 10.1089/ast.2009.0385. Astrobiology. 2010. PMID: 20528198
-
Nucleotide synthetase ribozymes may have emerged first in the RNA world.RNA. 2007 Nov;13(11):2012-9. doi: 10.1261/rna.658507. Epub 2007 Sep 18. RNA. 2007. PMID: 17878321 Free PMC article.
-
Evolution of the division of labor between genes and enzymes in the RNA world.PLoS Comput Biol. 2014 Dec 4;10(12):e1003936. doi: 10.1371/journal.pcbi.1003936. eCollection 2014 Dec. PLoS Comput Biol. 2014. PMID: 25474573 Free PMC article.
-
The RNA world on ice: a new scenario for the emergence of RNA information.J Mol Evol. 2005 Aug;61(2):264-73. doi: 10.1007/s00239-004-0362-7. Epub 2005 Jul 13. J Mol Evol. 2005. PMID: 16044244 Review.
-
Abiogenesis through gradual evolution of autocatalysis into template-based replication.FEBS Lett. 2023 Feb;597(3):344-379. doi: 10.1002/1873-3468.14507. Epub 2022 Nov 17. FEBS Lett. 2023. PMID: 36203246 Review.
Cited by
-
Towards an RNA/Peptides World by the Direct RNA Template Mechanism: The Emergence of Membrane-Stabilizing Peptides in RNA-Based Protocells.Life (Basel). 2023 Feb 14;13(2):523. doi: 10.3390/life13020523. Life (Basel). 2023. PMID: 36836881 Free PMC article.
-
Impact of chromosome 17q deletion in the primary lesion of colorectal cancer on liver metastasis.Oncol Lett. 2016 Dec;12(6):4773-4778. doi: 10.3892/ol.2016.5271. Epub 2016 Oct 17. Oncol Lett. 2016. PMID: 28101224 Free PMC article.
-
From molecular to cellular form: modeling the first major transition during the arising of life.BMC Evol Biol. 2019 Apr 3;19(1):84. doi: 10.1186/s12862-019-1412-5. BMC Evol Biol. 2019. PMID: 30943915 Free PMC article.
-
What Does "the RNA World" Mean to "the Origin of Life"?Life (Basel). 2017 Nov 29;7(4):49. doi: 10.3390/life7040049. Life (Basel). 2017. PMID: 29186049 Free PMC article.
-
Tag mechanism as a strategy for the RNA replicase to resist parasites in the RNA world.PLoS One. 2017 Mar 2;12(3):e0172702. doi: 10.1371/journal.pone.0172702. eCollection 2017. PLoS One. 2017. PMID: 28253281 Free PMC article.
References
-
- Gilbert W. The RNA world. Nature. 1986;319:618. doi: 10.1038/319618a0. - DOI
Publication types
MeSH terms
Substances
LinkOut - more resources
Full Text Sources
Other Literature Sources
