. 2016 Jan 15;196(2):668-77.
doi: 10.4049/jimmunol.1501888. Epub 2015 Dec 7.

Naturally Occurring Subclinical Endotoxemia in Humans Alters Adaptive and Innate Immune Functions through Reduced MAPK and Increased STAT1 Phosphorylation

Affiliations

Naturally Occurring Subclinical Endotoxemia in Humans Alters Adaptive and Innate Immune Functions through Reduced MAPK and Increased STAT1 Phosphorylation

Christine D Palmer et al. J Immunol. .

Abstract

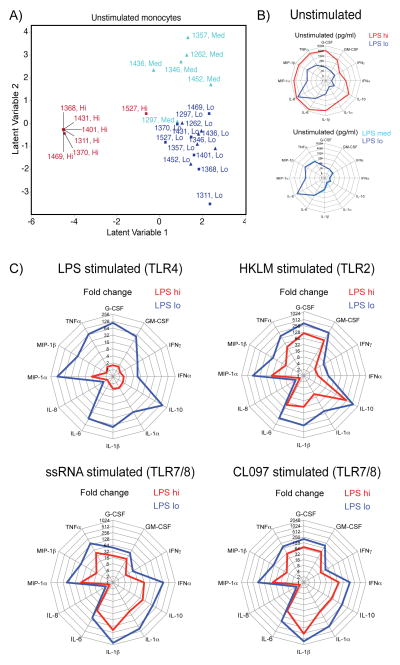
Multiple studies have shown correlates of immune activation with microbial translocation and plasma LPS during HIV infection. It is unclear whether this activation is due to LPS, residual viral replication, or both. Few studies have addressed the effects of persistent in vivo levels of LPS on specific immune functions in humans in the absence of chronic viral infection or pathological settings such as sepsis. We previously reported on a cohort of HIV-negative men with subclinical endotoxemia linked to alterations in CD4/CD8 T cell ratio and plasma cytokine levels. This HIV-negative cohort allowed us to assess cellular immune functions in the context of different subclinical plasma LPS levels ex vivo without confounding viral effects. By comparing two samples of differing plasma LPS levels from each individual, we now show that subclinical levels of plasma LPS in vivo significantly alter T cell proliferative capacity, monocyte cytokine release, and HLA-DR expression, and induce TLR cross-tolerance by decreased phosphorylation of MAPK pathway components. Using this human in vivo model of subclinical endotoxemia, we furthermore show that plasma LPS leads to constitutive activation of STAT1 through autocrine cytokine signaling, suggesting that subclinical endotoxemia in healthy individuals might lead to significant changes in immune function that have thus far not been appreciated.


Figures

Figure 1
Figure 1. Reduced Ki67 expression with increasing levels of plasma LPS
Freshly isolated PBMCs from HIV negative males with and without detectable plasma LPS (limit of detection 0.01 EU/ml) were analyzed by flow cytometry. A) Frequencies of CD4+CDKi67+ T cells with group median are shown for subjects with no detectable plasma LPS (n=10, light grey squares) and those with detectable plasma LPS (n=25, dark grey squares). B) Frequencies of CD8+CDKi67+ T cells with group median are shown for subjects with no detectable plasma LPS (n=10, light grey circles) and those with detectable plasma LPS (n=25, dark grey circles). C) Spearman correlation of frequencies of CD4+CDKi67+ T cells (black squares) and CD8+CDKi67+ T cells (clear circles) with plasma LPS (EU/ml). D) Plasma LPS levels (EU/ml) for each subject (n=30) at two different sample points are shown. Subjects with EU/ml >10 in one of the two samples were assigned to Group 1 (n=7), subjects with EU/ml <10 in both samples and with minimal difference in LPS levels were assigned to Group 2 (n=7). E) Schematic illustration of sample allocation into groups 1 and 2 using individuals #2 and #27 (from 1D) as examples. Statistical analyses were performed using unpaired Mann Whitney test and Spearman rank correlation. Significance is indicated as *p<0.05 and **p<0.01.
Figure 2
Figure 2. LPS affects CD4+ and CD8+ T cell proliferative capacity
Cryopreserved PBMCs were thawed, washed and re-suspended at 106cells/ml in R10 supplemented with rIL-2 (50 U/ml). Cells were stained with 0.5μM CellTrace Violet dye and subsequently stimulated with R10 (vehicle) or anti-CD3/CD28 Dynabeads® for 3, 4, or 5 days. Proliferation was assessed by flow cytometry and division cycles calculated and adjusted for cell number per division at each time point as previously described (see methods). Division cycles are depicted as <1 (no proliferation, clear), >1, >2, >3 and >4 completed cycles of proliferation (shades of grey). A) Pie chart depicting percent of CD4+ T cells in each division cycle following stimulation with anti-CD3/CD28 Dynabeads® at the LPS hi (left panel) and LPS lo (right panel) samples from Group 1. B) Pie chart depicting percent of CD4+ T cells in each division cycle following stimulation with anti-CD3/CD28 Dynabeads® at the LPS med (left panel) and LPS lo (right panel) samples from Group 2. C) Pie chart depicting percent of CD8+ T cells in each division cycle following stimulation with anti-CD3/CD28 Dynabeads® at the LPS hi (left panel) and LPS lo (right panel) samples from Group 1. D) Pie chart depicting percent of CD8+ T cells in each division cycle following stimulation with anti-CD3/CD28 Dynabeads® at the LPS med (left panel) and LPS lo (right panel) samples from Group 2. Contingency analyses comparing samples within each group were performed by Chi-square test. Significance is indicated as *p<0.05 and **p<0.01.
Figure 3
Figure 3. Effects of endotoxemia on monocyte cytokine secretion patterns before and after in vitro TLR stimulation
CD33enr monocytes were cultured for 18h in media (unstimulated), or with LPS (10ng/ml), heat killed Listeria monocytogenes (HKLM; 108 bacteria/ml), ssRNA (5μg/ml), or CL097 (1μg/ml). A) Cytokine expression profiles of unstimulated monocytes were analyzed by PLSDA. Separation of individuals and samples by latent variables are shown for Group 1 with LPS hi (red squares) and LPS lo (navy blue squares) samples, and for Group 2 with LPS med (light blue triangle) and LPS lo (navy blue triangle) samples. B) Radar plots showing median cytokine concentration (pg/ml) for unstimulated CD33enr monocytes from Group 1 (upper plot) for LPS hi (red) and LPS lo (navy blue) samples, and for Group 2 (lower plot) for LPS med (light blue) and LPS lo (navy blue) samples. C) Radar plots showing median cytokine secretion levels (fold change over unstimulated) for CD33enr monocytes stimulated with LPS (upper left plot), HKLM (upper right plot), ssRNA (lower left plot), or CL097 (lower right plot) for 18h for LPS hi (red) and LPS lo (navy blue) samples from Group 1.
Figure 4
Figure 4. Differential HLA-DR surface expression in monocyte subsets exposed to LPS in vivo
CD33enr monocytes were analyzed by flow cytometry and monocyte populations defined according to CD14 and CD16 expression levels. A) Representative flow plot showing gating for classical (CD14+CD16), intermediate (CD14+CD16+), and inflammatory (CD14dimCD16+) monocytes. B) Representative histogram showing relative expression levels of HLA-DR on monocyte subsets. C) Tukey box and whiskers plot (median, 5–95 percentiles and individual outliers) of HLA-DR levels (MFI) on inflammatory monocytes from individuals in Group 1 (grey boxes) and Group 2 (clear boxes) comparing LPS samples. D) Tukey box and whiskers plot (median, 5–95 percentiles and individual outliers) of HLA-DR levels (MFI) on classical monocytes from individuals in Group 1 (grey boxes) and Group 2 (clear boxes) comparing LPS samples. Statistical analyses were performed using paired Mann Whitney test. Significance is indicated as *p<0.05 and **p<0.01.
Figure 5
Figure 5. Phosphorylation patterns of signaling pathways downstream of TLR4 are altered by levels of in vivo endotoxemia
CD33enr monocytes were cultured in media (unstimulated), or stimulated with LPS (10ng/ml) for 15, 30, or 60 minutes. Cell lysates were analyzed for phosphorylation of signaling pathways by multiplex assay. A) Relative levels of phosphorylation (MFI) of MAPK signaling components are shown for Group 1 (no pattern) and Group 2 (hashed bars) comparing changes in phosphorylation of MEK, p38, JNK and MSK1 over time for LPS hi (clear bars), LPS lo (grey bars), LPS med (hashed clear bars), and LPS lo (hashed grey bars). B) Relative levels of phosphorylation (MFI) of HSP27 are shown for Group 1 (no pattern) and Group 2 (hashed bars) comparing changes in phosphorylation over time for LPS hi (clear bars), LPS lo (grey bars), LPS med (hashed clear bars), and LPS lo (hashed grey bars). C) Relative levels of phosphorylation (MFI) of transcription factors are shown for Group 1 (no pattern) and Group 2 (hashed bars) comparing changes in phosphorylation of ATF2, c-JUN and STAT1 over time for LPS hi (clear bars), LPS lo (grey bars), LPS med (hashed clear bars), and LPS lo (hashed grey bars). Statistics: Group comparisons were performed by 2-way ANOVA for repeated measures with Holm-Sidak’s post-test. Significant differences for comparisons to baseline within each group (e.g. 60 min LPS hi versus 0 min LPS hi) are indicated as p<0.05, ‡‡p<0.01, ‡‡‡p<0.001. Significant differences for comparisons between groups at the same stimulation time point (e.g. 60 min LPS hi versus 60 min LPS lo for Group 1) are indicated as *p<0.05, **p<0.01 and ***p<0.001.
Figure 6
Figure 6. STAT1 phosphorylation in LPS hi monocytes is driven by autocrine cytokine signaling
CD33enr monocytes were cultured in in the presence (+) of absence (−) of Brefeldin A (BFA; 1μg/ml) and GolgiStop (GS; 50ng/ml), and left unstimulated or stimulated with LPS (10ng/ml) for 60 minutes. Cell lysates were analyzed for phosphorylation of STAT1 by multiplex assay. Fold changes in STAT1 phosphorylation relative to unstimulated, untreated LPS hi monocytes are shown for Group 1 (no pattern) and Group 2 (hashed bars) comparing LPS hi (clear bars), LPS lo (grey bars), LPS med (hashed clear bars), and LPS lo (hashed grey bars). Statistics: Paired comparisons were performed by 1-way ANOVA with Holm-Sidak’s multiple comparison post-test. Significant differences are indicated as **p<0.01 and ***p<0.001.

References

    1. Caradonna L, Amati L, Magrone T, Pellegrino NM, Jirillo E, Caccavo D. Enteric bacteria, lipopolysaccharides and related cytokines in inflammatory bowel disease: biological and clinical significance. Journal of endotoxin research. 2000;6:205–214. - PubMed
    1. Brenchley JM, Price DA, Schacker TW, Asher TE, Silvestri G, Rao S, Kazzaz Z, Bornstein E, Lambotte O, Altmann D, Blazar BR, Rodriguez B, Teixeira-Johnson L, Landay A, Martin JN, Hecht FM, Picker LJ, Lederman MM, Deeks SG, Douek DC. Microbial translocation is a cause of systemic immune activation in chronic HIV infection. Nature medicine. 2006;12:1365–1371. - PubMed
    1. Morris MC, Gilliam EA, Li L. Innate immune programing by endotoxin and its pathological consequences. Frontiers in immunology. 2014;5:680. - PMC - PubMed
    1. Heremans H, Van Damme J, Dillen C, Dijkmans R, Billiau A. Interferon gamma, a mediator of lethal lipopolysaccharide-induced Shwartzman-like shock reactions in mice. The Journal of experimental medicine. 1990;171:1853–1869. - PMC - PubMed
    1. Shwartzman G. Studies on Bacillus Typhosus Toxic Substances : I. Phenomenon of Local Skin Reactivity to B. Typhosus Culture Filtrate. The Journal of experimental medicine. 1928;48:247–268. - PMC - PubMed

Publication types

Substances