. 2015 Dec 8:6:10004.
doi: 10.1038/ncomms10004.

SF3B1 mutant MDS-initiating cells may arise from the haematopoietic stem cell compartment

Affiliations

SF3B1 mutant MDS-initiating cells may arise from the haematopoietic stem cell compartment

Syed A Mian et al. Nat Commun. .

Abstract

Despite the recent evidence of the existence of myelodysplastic syndrome (MDS) stem cells in 5q-MDS patients, it is unclear whether haematopoietic stem cells (HSCs) could also be the initiating cells in other MDS subgroups. Here we demonstrate that SF3B1 mutation(s) in our cohort of MDS patients with ring sideroblasts can arise from CD34(+)CD38(-)CD45RA(-)CD90(+)CD49f(+) HSCs and is an initiating event in disease pathogenesis. Xenotransplantation of SF3B1 mutant HSCs leads to persistent long-term engraftment restricted to myeloid lineage. Moreover, genetically diverse evolving subclones of mutant SF3B1 exist in mice, indicating a branching multi-clonal as well as ancestral evolutionary paradigm. Subclonal evolution in mice is also seen in the clinical evolution in patients. Sequential sample analysis shows clonal evolution and selection of the malignant driving clone leading to AML transformation. In conclusion, our data show SF3B1 mutations can propagate from HSCs to myeloid progeny, therefore providing a therapeutic target.


Figures

Figure 1
Figure 1. SF3B1 mutations can propagate from HSCs to their progeny.
SF3B1 mutations occurs in rare HSC phenotypic cells, is largely maintained in more committed progenitors MPPs as well as in more differentiated progenitors GMPs and MEPs. Tables show the progenitor cell counts (events detected by the FACS during cell sorting) for each patient sample. The average sequencing coverage across all amplicons was ≥800 reads. Bar charts indicate the SF3B1 MAB for the respective cell fraction. MAB for each cell population was confirmed by independent PCRs. MAB mutant allele burden (t-test P value>0.05).
Figure 2
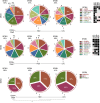
Figure 2. Mutational architecture and subclonal evolution of SF3B1-mutated MDS-RS bone marrow cells.
Panels show the gene mutations with their MABs in primary CD34+ bone marrow, HEC cells and LTC samples from each patient. Outer red circle represents the total SF3B1 clone and the inner sections of the circle represents the SF3B1 subclones. MABs for HEC samples are the average of all mouse samples (where applicable, that is, >1 mouse). Percentages displayed in the pie chart indicate the MAB frequency modulation in HEC and LTC samples versus CD34+ day 0. *P<0.01% (t-test) for difference in SF3B1 MAB frequency between CD34+ day 0 and HEC and/or LTC samples for the MDS3 sample. For more details about statistical analysis of the variation in MAB frequencies, refer to Supplementary Fig. 5. The table on the right side of each panel represents the mutation status of the respective genes in the HSC, MPP, GMP and MEP cell populations for each patient. Samples used to isolate cell fractions (HSCs, MPPs, GMPs and MEPs) were taken ∼18 months later than the first sample used to isolate CD34+ cells. Three independent PCRs were performed to confirm/determine the MAB throughout the experiments. In the tables on the right side, the black boxes indicate that MAB for gene mutations was the same as the primary CD34+ cells, dark grey boxes show MAB for gene mutations that was≤2-fold as compared to the primary CD34+ cells, light grey boxes represent MAB for gene mutations that was ≥2-fold as compared with the primary CD34+ cells and pink boxes indicate not detected or below background noise level. MAB mutant allele burden; HEC, human engrafted cell; LTC, long-term culture; BM, bone marrow; Mut, mutation.
Figure 3
Figure 3. Engraftment and genotype of human RARS-originated and control haematopoietic cells in the bone marrow of NOD/SCID/IL2rγ−/− mice.
(a) Schematic representation of the xenograft model. Right-hand side panel shows the flow cytometry profile of bone marrow cells recovered from one human-cell-engrafted mice. The majority of human CD45-expressing cells were positive for a myeloid marker CD33+ in all analysed cases in this study. (b) Percentage of human CD45+ cells in the bone marrow of NSG mice at 6 and 18–20 weeks after transplantation (MDS1, n=3; MDS2, n=1; MDS3, n=3 and MDS4, n=1). (c) Percentages of human haematopoietic cells and ratio of CD19+/CD33+ isolated from the bone marrow of mice engrafted with either MDS-RS (n=4 patients and transplanted in a total eight mice) or healthy controls CD34+ cells (n=3 healthy donors and transplanted in a total of 11 mice) or congenital sideroblastic anaemia patient (n=1 patient transplanted in two mice). The y axis (left) represents the percentage of the human CD45+ cells present in the total mouse bone marrow. The y axis (right) represents the ratio of the human CD19+ versus human CD33+ cells within the human CD45+ cells recovered following xenotransplant. MDS xenografts showed a significant skewing towards myeloid lineage. *P<0.05, ****P<0.0001 (t-test). (d) Targeted mutational analysis shows the presence of concordant SF3B1 mutations in primary CD34+ bone marrow sample (grey) and xenograft (black) in all analysed cases. Three independent PCR/sequencing experiments were performed to confirm/determine the mutant allele burden throughout the experiments. The sequencing coverage across the SF3B1 amplicons was ≥1,000 reads. *P<0.01 (t-test).
Figure 4
Figure 4. SF3B1 mutations in single-cell colonies.
Mutational analysis was performed on BFU-E and CFU-GM colonies derived from primary CD34+ patient cells (MDS1, MDS2, MDS3 and MDS4). Each column represents an individual CFC colony. Circle (MDS1 and MDS2) on the right is the representative of the overall clonality observed in the clonogenic assays (left) in MDS1 and MDS2 and total CD34+ cells. The outer red circle represents the total SF3B1 clone, while the inner circle depicts subclones. WT, wild type.
Figure 5
Figure 5. Xenograft recapitulates the clonal changes occurring in RARS patient bone marrow compartment.
Mutational analysis of sequential primary TNC (total nucleated cells) sample from one patient (MDS1). Primary patient sample was received at two different time points, MDS1 bone marrow cells (TP1, first sample) and MDS1 bone marrow cells (TP2, second sample). Mutational analysis was also performed on human engrafted cells, which were obtained from mice transplanted with the patient sample received at time point 1. The length of the arc represents the MABs. Gene MAB for human engrafted cells is the average between three animal experiments. Three independent PCR/sequencing experiments were performed to confirm/determine the mutant allele burden throughout the experiments. Error Bar in the bar chart were derived from the PCR/sequencing technical replicates. MAB, mutant allele burden; TP, time point; HEC, human engrafted cells; BM, bone marrow cells.
Figure 6
Figure 6. Clonal evolution from MDS to AML in RCMD-RS patient with SF3B1 mutation.
(a) FACS profiles of stem cell progenitors in BM MNCs in a serial sample at the MDS stage and AML stage of the disease. (b) Interphase FISH for tracking the del(7q) aberration in cells obtained at the AML stage of the disease. Two chromosome-7 aberrations, del(7q36) and del(7q22-7q36), were detected as two separate clones. Two individual cells are shown in the figure with one harbouring del(7q36) represented by a green probe and the other cell has del(7q22-7q36) represented by probes orange/green. (c) SNV profile derived from whole-exome sequencing. The shown profile depicts a heterozygous deletion (horizontal red line) of chromosome 7q in patient CD34+ bone marrow cells (AML stage, bottom) and absence of the deletion in paired control CD3+ cells (top). (d) Bar chart (FISH analysis) showing percentage of CD34+ cells (MDS stage), CD34+ cells (AML stage), MPL (AML stage), GMP (AML stage) with del(7q) aberration. (e) Bar chart (FISH analysis) showing the percentage of del(7q) aberration in LTC-derived cells from MDS-stage CD34+ cells (time point 1). (f) Mutational status of the gene mutations in sequential bone marrow samples (MDS-stage time-point 1, MDS-stage time-point 2 and AML stage). Coloured circles represent the MABs for each screened gene mutation. Black * represent absence of gene mutations in the AML-stage sample. Red * represent acquisition of additional mutation at the AML stage. (g) Mutational analysis of SF3B1, DNMT3A and SUV420H1 in HSCs, MLPs and GMPs from the AML stage of the disease. Sequencing depth for HSCs was >10,000 reads. (h) Proposed sequential acquisition of genetic lesions based on analysis of sequential samples, LTC-derived cells and single-cell clonogenic assays.
Figure 7
Figure 7. Predicted model for sequential acquisition of genetic lesions in MDS to AML transformation.
SF3B1 mutations are acquired in CD34+CD38CD90+CD45RACD49f+ HSCs. As HSCs replenish downstream progenitors, mutations acquired in stem cells are also propagated to mature progenitors but without conferring self-renewal potential. However, as the mature progenitors such as MLPs harbouring a mutant SF3B1 acquires a more ‘potent hit' such as SUV420H1 mutation, they confer self-renewal potential and suppress the HSC to MPP transition.

Similar articles

Cited by

References

    1. Mufti G. J. et al. Diagnosis and classification of myelodysplastic syndrome: International Working Group on Morphology of myelodysplastic syndrome (IWGM-MDS) consensus proposals for the definition and enumeration of myeloblasts and ring sideroblasts. Haematologica 93, 1712–1717 (2008). - PubMed
    1. Tefferi A. & Vardiman J. W. Myelodysplastic syndromes. N. Engl. J. Med. 361, 1872–1885 (2009). - PubMed
    1. Yoshida K. et al. Frequent pathway mutations of splicing machinery in myelodysplasia. Nature 478, 64–69 (2011). - PubMed
    1. Mian S. A. et al. Spliceosome mutations exhibit specific associations with epigenetic modifiers and proto-oncogenes mutated in myelodysplastic syndrome. Haematologica 98, 1058–1066 (2013). - PMC - PubMed
    1. Papaemmanuil E. et al. Somatic SF3B1 mutation in myelodysplasia with ring sideroblasts. N. Engl. J. Med. 365, 1384–1395 (2011). - PMC - PubMed

Publication types

MeSH terms