. 2015 Dec 7;36(4):559-73.
doi: 10.1128/MCB.00712-15. Print 2016 Feb 15.

Deregulated KLF4 Expression in Myeloid Leukemias Alters Cell Proliferation and Differentiation through MicroRNA and Gene Targets

Affiliations

Deregulated KLF4 Expression in Myeloid Leukemias Alters Cell Proliferation and Differentiation through MicroRNA and Gene Targets

Valerie A Morris et al. Mol Cell Biol. .

Abstract

Acute myeloid leukemia (AML) is characterized by increased proliferation and blocked differentiation of hematopoietic progenitors mediated, in part, by altered myeloid transcription factor expression. Decreased Krüppel-like factor 4 (KLF4) expression has been observed in AML, but how decreased KLF4 contributes to AML pathogenesis is largely unknown. We demonstrate decreased KLF4 expression in AML patient samples with various cytogenetic aberrations, confirm that KLF4 overexpression promotes myeloid differentiation and inhibits cell proliferation in AML cell lines, and identify new targets of KLF4. We have demonstrated that microRNA 150 (miR-150) expression is decreased in AML and that reintroducing miR-150 expression induces myeloid differentiation and inhibits proliferation of AML cells. We show that KLF family DNA binding sites are necessary for miR-150 promoter activity and that KLF2 or KLF4 overexpression induces miR-150 expression. miR-150 silencing, alone or in combination with silencing of CDKN1A, a well-described KLF4 target, did not fully reverse KLF4-mediated effects. Gene expression profiling and validation identified putative KLF4-regulated genes, including decreased MYC and downstream MYC-regulated gene expression in KLF4-overexpressing cells. Our findings indicate that decreased KLF4 expression mediates antileukemic effects through regulation of gene and microRNA networks, containing miR-150, CDKN1A, and MYC, and provide mechanistic support for therapeutic strategies increasing KLF4 expression.


Figures

FIG 1
FIG 1
KLF4 expression is decreased in CD34+ hematopoietic progenitors from AML patients (n = 285) versus healthy subjects (n = 10). Gene expression of KLF4 (A) and KLF2 (B) measured using the Affymetrix HU-133A microarray platform is from previously published data sets (33, 34). KLF4 expression was significantly decreased between AML and healthy cases (P = 0.009). No statistically significant differences were observed for other KLF genes (KLF1 to KLF13 were examined) between healthy subjects and AML cases. KLF2 expression is shown as an example. NK, normal karyotype; ND, not determined; “other” represents other cytogenetic abnormalities. The line indicates the mean expression in normal hematopoietic progenitors.
FIG 2
FIG 2
KLF2 and KLF4 promote differentiation and block proliferation in THP-1 cells. THP-1 cells were lentivirally transduced with the indicated control (ECV) or KLF isoforms and then sorted for GFP expression by fluorescence-activated cell sorting (FACS). (A) Cells were assessed for myeloid differentiation at 3 days postinfection (dpi) by examining CD11b cell surface expression by flow cytometry. (B) RNA was isolated from the indicated cells and assayed for expression of the indicated genes by RT-qPCR at 4 dpi (*, P < 0.01 compared to the value for ECV). (C) Cell proliferation was assessed over time by MTT assay (*, P < 0.01 compared to the value for ECV).
FIG 3
FIG 3
miR-150 transcription start site and minimal promoter region identified. (A) Schematic of the miR-150 promoter truncations cloned in front of the luciferase gene in pGL3enhancer. (B) Cell lines were cotransfected with the indicated miR-150 promoter truncation constructs and pRL-SV40 as a transfection control. Relative luciferase units (RLU) are displayed as the means ± standard deviations from triplicate experiments. Empty pGL3-promoter (pGL3 P) and pGL3-enhancer (pGL3 E) served as positive and negative controls (*, P < 0.01 compared to the value for pGL3 E). We identified the minimal miR-150 promoter region as bp −266 to +259 with respect to the major TSS. Promoter activity was detected in cells that express endogenous miR-150, Jurkat and KG1A cells (higher miR-150 expression) and THP-1 cells (low miR-150 expression) but not in K562 cells, which lack miR-150 expression.
FIG 4
FIG 4
KLF DNA binding and p300 binding sites are necessary for miR-150 promoter activity. (A) TRANSFAC analysis identified transcription factor DNA binding sites in the miR-150 minimal promoter. The pre-miR-150 sequence is underlined. The major and minor transcription start sites (TSSs) are indicated by arrows. (B) Jurkat and THP-1 cell lines were cotransfected with the minimal miR-150 promoter construct or the indicated mutation constructs, with pRL-SV40 as a transfection control. Relative luciferase units (RLU) are displayed as the means ± standard deviations of triplicate experiments. Site-directed mutagenesis of the p300 binding site or the two individual KLF binding sites (KLF A or KLF B) alone or in combination (KLF AB) decreased miR-150 promoter activity in all assayed cell lines. Mutagenesis of the other predicted transcription factor DNA binding sites did not alter miR-150 promoter activity (*, P < 0.05 compared to the value for the wild type).
FIG 5
FIG 5
KLF2 and KLF4 induce miR-150 promoter activity and endogenous miR-150 expression in K562 cells. (A) K562 cells were transiently cotransfected with the indicated empty control lentiviral vector (ECV) or KLF isoforms and the minimal miR-150 promoter construct, with pRL-SV40 as a transfection control. Relative luciferase units (RLU) are displayed as the means ± standard deviations from triplicate experiments (*, P < 0.01 compared to the value for ECV). (B) K562 cells were cotransfected with KLF4 or KLF2 and with the minimal miR-150 promoter construct or the indicated mutation constructs and assayed as described above (*, P < 0.01 compared to the value for the wild type). KLF and p300 binding sites were necessary for KLF2- and KLF4-induced miR-150 promoter activity. (C) K562 cells were lentivirally transduced with ECV or KLF isoforms, sorted for GFP expression by FACS, and assayed for miR-150 expression by RT-qPCR 7 days postinfection (dpi). KLF2 and KLF4 induced endogenous miR-150 expression (*, P < 0.01 compared to the value for ECV). (D) Cell lysates were harvested 7 dpi from GFP-sorted K562 cells lentivirally transduced with ECV, KLF2, or KLF4, and Western blotting was performed with the indicated antibodies.
FIG 6
FIG 6
KLF4 regulates miR-150 expression in THP-1 and Jurkat cells. (A) THP-1 cells were lentivirally transduced with ECV or KLF isoforms and sorted for GFP expression by FACS. RNA was isolated and assayed for miR-150 expression by RT-qPCR 3 dpi. (B) THP-1 cells were transiently transfected with negative-control or KLF4 siRNA by AMAXA nucleofection. The next day, cells were cotransfected with empty pGL3 enhancer (empty), the full-length or the minimal miR-150 promoter construct, and pRL-SV40 as a transfection control. Relative luciferase units (RLU) were calculated as a ratio of firefly to Renilla luciferase measurements relative to negative-control siRNA with empty luciferase reporter and are displayed as the means ± standard deviations from triplicate experiments (*, P < 0.05 compared to the value for the control). (C) Jurkat cells were transiently transfected with negative-control or KLF2 or KLF4 siRNA alone or together by AMAXA nucleofection. RNA was harvested from cells 72 h later, and expression of mature miR-150, KLF2 and KLF4 mRNA was assessed by RT-qPCR. (*, P < 0.05 compared to the value for the control).
FIG 7
FIG 7
Transient miR-150 inhibition does not alter KLF4- or KLF2-induced differentiation or decreased proliferation. K562 cells (A) and THP-1 cells (B) were transiently transfected with LNA-control or LNA-miR-150 inhibitors by AMAXA nucleofection. At 24 h, the cells were infected with ECV, KLF2, or KLF4 lentivirus and sorted for GFP expression 3 dpi. Cell proliferation was assessed over time by MTT assay. (C) CD11b induction was assessed 3 dpi by flow cytometry (P, not significant for LNA-control versus LNA-miR-150). (D) RNA was harvested from cells 5 dpi, and myeloid differentiation gene expression changes were assessed by RT-qPCR (P, not significant for LNA-control versus LNA-miR-150).
FIG 8
FIG 8
CRISPR/Cas9 sgRNA effectively target MIR150 and CDKN1A in THP-1 cells. THP-1 cells were transduced with the indicated nontargeting control (NT), miR-150 (150), or CDKN1A (p21) CRISPR sgRNA lentiviruses, and pooled clones were selected with puromycin for 7 days. (A) Genomic DNA was isolated from the cells and PCR amplified with primers surrounding the sgDNA cleavage sites for CDKN1A and MIR150. PCR products were treated or not treated with T7 endonuclease. (B) CDKN1A CRISPR THP-1 cells were treated with TPA (25 ng/ml) for 24 h to induce p21 protein expression, and cell lysates were examined by Western blotting with the indicated antibodies. (C) THP-1 miR-150 CRISPR cells were infected with ECV, KLF2, or KLF4 lentivirus, and RNA was isolated 3 dpi and analyzed for miR-150 expression. (D) The indicated sgRNA CRISPR THP-1 cells were infected with ECV, KLF2, or KLF4 lentivirus, and cell surface expression of CD11b was examined by flow cytometry 3 dpi. No statistically significant difference in CD11b expression was observed for miR-150 or CDKN1A CRISPR cells expressing KLF2 or KLF4.
FIG 9
FIG 9
Dual inhibition of miR-150 and CDKN1A via CRISPR/Cas9 does not significantly alter KLF4-induced differentiation, decreased proliferation, or repression of MYC. THP-1 cells were cotransduced with nontargeting control (NT-4), CDKN1A (p21-3), or miR-150 (150-4) sgRNA lentiCRISPRv2 viruses, and pooled clones were selected with puromycin and sorted for GFP. The cells were infected with ECV or KLF4 YFP-encoding lentivirus and sorted for dual GFP and YFP expression 3 dpi. (A) CD11b induction was assessed 3 dpi by flow cytometry. KLF4 induction of CD11b was not statistically significantly altered in individual or dual CDKN1A and miR-150 CRISPR THP-1 cells. (B) Cell proliferation was assessed over time by MTT assay. (C) Cell lysates were harvested 5 dpi and assessed by Western blotting with the indicated antibodies. KLF4 induction of p21 protein expression was decreased in the CDKN1A CRISPR cells. (D) RNA was isolated 5 dpi, and expression of the indicated genes was assessed by RT-qPCR. miR-150 expression was decreased in the miR-150 CRISPR cells (*, P < 0.01 compared to the value for NT-4/NT-4). KLF4-induced increases in KLF4, S100A8, S100A9, CDKN1A, and ITGAM (CD11b) gene expression and decreases in MYC gene expression were not statistically significantly altered by individual or dual CDKN1A and miR-150 CRISPR in THP-1 cells.
FIG 10
FIG 10
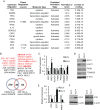
High-throughput GEP analysis identifies altered gene expression induced by KLF4 and unique gene expression signatures associated with CDKN1A and miR-150 expression in KLF4-expressing cells. Nontargeting control, CDKN1A, and miR-150 CRISPR THP-1 cells were transduced with ECV or KLF4 lentivirus. Cells were sorted for GFP expression, and RNA was harvested 5 dpi and examined with Illumina HumanHT-12 v.4 microarrays. (A) The table displays the top 15 significantly altered upstream transcription regulators, growth factors, and cytokines predicted by Ingenuity Pathway Analysis of gene expression changes in KLF4 versus control THP-1 cells (for the complete list, see Table S3 in the supplemental material). (B) Venn diagram showing overlap and differential gene expression in CDKN1A versus nontargeting control CRISPR KLF4-overexpressing cells and miR-150 versus nontargeting control CRISPR KLF4-overexpressing cells (for complete lists, see Tables S4 and S5). (C) KLF4 overexpression in THP-1 cells decreases mRNA expression of MYC and the MYC-regulated genes FASN and TOMM20 and increases mRNA expression of MXD1 compared to that in control cells as determined by RT-qPCR 4 dpi (*, P < 0.05 compared to the value for ECV). (D) KLF4 overexpression in THP-1 cells decreases protein expression of MYC, FASN, and TOMM20 compared to control cells as determined by Western blotting 4 dpi. (E) KLF4 overexpression in THP-1 cells decreases mRNA expression of BTK and PRMT1 and increases mRNA expression of E2F2 compared to that in control cells as determined by RT-qPCR 4 dpi (*, P < 0.05 compared to the value for ECV). (F) KLF4 overexpression in THP-1 cells increases protein expression of E2F2 and decreases protein expression of BTK compared to that in control cells as determined by Western blotting 4 dpi and 9 dpi, respectively.

Similar articles

Cited by

References

    1. Graf T, Enver T. 2009. Forcing cells to change lineages. Nature 462:587–594. doi:10.1038/nature08533. - DOI - PubMed
    1. Laslo P, Pongubala JM, Lancki DW, Singh H. 2008. Gene regulatory networks directing myeloid and lymphoid cell fates within the immune system. Semin Immunol 20:228–235. doi:10.1016/j.smim.2008.08.003. - DOI - PubMed
    1. Rosenbauer F, Tenen DG. 2007. Transcription factors in myeloid development: balancing differentiation with transformation. Nat Rev Immunol 7:105–117. - PubMed
    1. Cancer Genome Atlas Research Network. 2013. Genomic and epigenomic landscapes of adult de novo acute myeloid leukemia. N Engl J Med 368:2059–2074. doi:10.1056/NEJMoa1301689. - DOI - PMC - PubMed
    1. Tetreault MP, Yang Y, Katz JP. 2013. Kruppel-like factors in cancer. Nat Rev Cancer 13:701–713. doi:10.1038/nrc3582. - DOI - PubMed

Publication types