. 2016 Feb 5;291(6):2712-30.
doi: 10.1074/jbc.M115.676619. Epub 2015 Dec 7.

Global Kinetic Analysis of Mammalian E3 Reveals pH-dependent NAD+/NADH Regulation, Physiological Kinetic Reversibility, and Catalytic Optimum

Affiliations

Global Kinetic Analysis of Mammalian E3 Reveals pH-dependent NAD+/NADH Regulation, Physiological Kinetic Reversibility, and Catalytic Optimum

Michael A Moxley et al. J Biol Chem. .

Abstract

Mammalian E3 is an essential mitochondrial enzyme responsible for catalyzing the terminal reaction in the oxidative catabolism of several metabolites. E3 is a key regulator of metabolic fuel selection as a component of the pyruvate dehydrogenase complex (PDHc). E3 regulates PDHc activity by altering the affinity of pyruvate dehydrogenase kinase, an inhibitor of the enzyme complex, through changes in reduction and acetylation state of lipoamide moieties set by the NAD(+)/NADH ratio. Thus, an accurate kinetic model of E3 is needed to predict overall mammalian PDHc activity. Here, we have combined numerous literature data sets and new equilibrium spectroscopic experiments with a multitude of independently collected forward and reverse steady-state kinetic assays using pig heart E3. The latter kinetic assays demonstrate a pH-dependent transition of NAD(+) activation to inhibition, shown here, to our knowledge, for the first time in a single consistent data set. Experimental data were analyzed to yield a thermodynamically constrained four-redox-state model of E3 that simulates pH-dependent activation/inhibition and active site redox states for various conditions. The developed model was used to determine substrate/product conditions that give maximal E3 rates and show that, due to non-Michaelis-Menten behavior, the maximal flux is different compared with the classically defined kcat.

Keywords: enzyme kinetics; flavoprotein; global fitting; kcat; mathematical modeling; mitochondrial metabolism; pyruvate dehydrogenase complex (PDC).


Figures

FIGURE 1.
FIGURE 1.
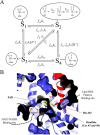
Mammalian E3 kinetic model and substrate/product-binding sites. A, pig heart E3 kinetic model consists of four redox states as follows: oxidized (S1), hydride-reduced disulfide (S2), hydride-reduced FAD (S3), and a hydride-reduced disulfide and FAD state (S4). Each enzyme redox state is depicted in the corresponding bubble captions, which illustrate the disulfide (S-S), flavin (FAD), and active site base (B:) chemical forms as part of the E3 enzyme (Enz). In the model, S2 has the ability to undergo (de)protonation, where the middle schematic in the bubble caption represents the charge transfer complex required for hydride transfer between the thiolate redox center and FAD cofactor to advance the mechanism between S2 and S3 enzyme states (3). Dihydrolipoamide, NAD+, lipoamide, NADH, and protons are represented by A, B, P, Q, and H+, respectively. Fractional occupancies, the fraction of a substrate or product bound to a given enzyme state, are represented by f, and subscripts indicate the substrate/product bound to a specific state (S1 through S4). Substrates and products are considered to bind randomly within each redox state and in rapid equilibrium compared with chemical steps. Our assumption of rapid equilibrium binding is supported by previous studies (3, 43, 46). B, x-ray structure of human E3 (Protein Data Bank code 1ZMD) (4) illustrates the general substrate/product binding situation common to E3s, where the re face of the FAD cofactor is exposed, and the si face is guarded by an active site disulfide. In the human E3 structure (4), NAD+ and NADH were shown to bind the re face of the FAD cofactor, whereas the si face does not bind either NAD redox state. There are available structures with bound NAD+ (Protein Data Bank code 1ZMC) and NADH (Protein Data Bank code 1ZMD). We chose to show the NADH-bound structure, which has a different binding mode than NAD+ where the nicotinamide ring of NADH is oriented toward the FAD cofactor. Structurally homologous enzymes in the flavin disulfide reductase family (69), molecular dynamics simulations (70), and structures of bound lipoamide inhibitors reveal the lipoamide binding cavity (71). The E3 human structure (4) is shown in a cutaway view so that the binding pockets, located in the protein interior, can be viewed. The structure (a dimer) is colored so that one monomer is blue and the other is red. Active site components are annotated accordingly with the bound NADH (gray) and FAD (yellow) cofactors shown in stick representation. The active site disulfide (Cys-45 and -50 in humans) and histidine (residue 452 in humans) are shown as yellow and red sticks, respectively. This figure was made using PyMOL (72) and Protein Data Bank code 1ZMD.
FIGURE 2.
FIGURE 2.
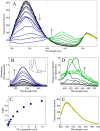
Equilibrium NAD+ titration of pig heart E3. A, pig heart E3 FAD fluorescence was excited at 455 nm and titrated with NAD+ in conditions described under “Experimental Procedures.” Pig heart E3 FAD fluorescence was quenched by increasing amounts of NAD+ (blue to black). B, linear least squares method was applied to estimate the fraction of bound NAD+ assuming the observed spectra are a linear sum of bound and unbound spectra (see “Experimental Procedures”). Solid lines are calculated spectra, and circles are observed spectra. C, determined α values are shown as a function of total NAD+.
FIGURE 3.
FIGURE 3.
dl-Lipoamide equilibrium fluorescence titration of pig heart E3. A, pig heart E3 fluorescence was excited at 280 nm and titrated with dl-lipoamide in conditions described under “Experimental Procedures.” Fluorescence spectra from 294 to 400 nm decreased with increasing dl-lipoamide additions (0, 0.016, 0.094, 0.373, 0.74, 1.43, 2.66, 4.53, 6.6, and 9.8 mm) (black to blue lines). These data (294–400 nm) were corrected (dashed lines in A) for an inner filter effect due to the absorption of dl-lipoamide as shown in B. Fluorescence spectra (A) from ∼400 to 500 nm increased with increasing dl-lipoamide additions (black to green). A fluorescence intensity peak was also observed near 500 nm and remained constant in intensity throughout the titration (black to yellow). B, absorption spectra of dl-lipoamide with increasing concentrations (0.526, 1, 1.98, 2.66, 3.62, 5.4, 7.72, and 9.97 mm; black to blue solid lines). Inset, dl-lipoamide absorption spectra were fitted (dashed lines) using linear least squares to obtain the molar absorptivity (m−1 cm−1) of dl-lipoamide to be used for inner filter effect correction. C, α values are plotted as a function of total dl-lipoamide. D, increasing concentrations of dl-lipoamide (0, 0.0157, 0.0938, 0.373, 0.74, 1.427, 2.66, and 4.53 mm; black to green) in the absence of protein were excited at 330 nm. E, pig heart E3 FAD fluorescence was excited at 455 nm and titrated with dl-lipoamide in the same conditions in A. Pig heart E3 FAD fluorescence spectra are shown with increasing dl-lipoamide concentrations (0, 0.015, 0.046, 0.156, 0.373, 1, 2, 3.6, and 5.4 mm; black to yellow).
FIGURE 4.
FIGURE 4.
Literature-derived equilibrium pig heart E3 FAD spectral titrations. A, pig heart E3 FAD absorption spectra were obtained from Fig. 3 in Ref. . In this experiment, pig heart E3 was anaerobically reduced with dithionite (initial red spectrum) and then titrated with NAD+ (0, 0.151, 0.303, 0.602, and 1.757 mm; red to black lines) at a pH of 5.8. B, semi-log plot of the singular values from a singular value decomposition of the spectra in A. C, fraction of NAD+ bound to the 2e reduced E3 state was calculated assuming the spectra in A are composed of only bound and unbound species and solving for this fraction using linear least squares. The resulting fractions, or α values, are shown as a function of total NAD+. D, pig heart E3 FAD absorption spectra were obtained from Fig. 4 in Ref. . In this experiment, oxidized pig heart E3 was anaerobically titrated with dihydrolipoamide (0, 10.6, 21.2, 31.8, 44.3, 65.3, and 84.67 μm; black to green). E, pig heart E3 FAD absorption spectra were from oxidized (light green), 2e reduced (dark green), and 4e reduced (black) obtained from Fig. 1 in Ref. . F, pig heart E3 absorption spectra of the different redox states in E were used to solve (see “Experimental Procedures”) the fraction of oxidized, 2e, and 4e reduced enzyme states as a function of the dihydrolipoamide titration in D. Extracted fractional enzyme states (oxidized, 2e reduced, and 4e reduced) are shown as a function of dihydrolipoamide.
FIGURE 5.
FIGURE 5.
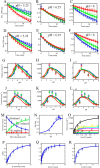
Mammalian E3 pH-dependent NAD+ activation/inhibition. A, pig heart E3 reverse reaction progress curves in acidic conditions (pH 5.25) in different initially added amounts of NAD+ (0, 100, and 500 μm), shown as blue, green, and red circles, respectively. Model simulations are shown as dashed (3-state model) and solid (4-state model) lines of the corresponding data marker color. B, pig heart E3 reverse reaction progress curves at basic conditions (pH 8) in different initially added amounts of NAD+ (0, 100, and 500 μm), shown as blue, green, and red circles, respectively. Model simulations are shown as dashed (3-state model) and solid (4-state model) lines of the corresponding data marker color. C, human liver E3 pH-dependent forward initial rates (black circles) taken from Fig. 5 of Ref. . Model simulations are shown as black dashed (3-state model) and solid (4-state model) lines. D, pig heart E3 pH-dependent reverse initial rates in different initially added amounts of NAD+ (0, 100, and 500 μm), shown as blue, green, and red circles, respectively, with 4-state model simulations shown as solid lines. E, pig heart E3 pH-dependent reverse initial rates (as in D) with 3-state model simulations shown as dashed lines of the corresponding data marker color. F, difference plots (observed turnover (NAD+ added) − observed turnover (no NAD+)) of data and simulations shown in D corresponding to the 4-state model. G, difference plots (observed turnover (NAD+ added) − observed turnover (no NAD+)) of data and simulations shown in E corresponding to the 3-state model. A–E, error bars represent standard deviations of the data from at least three experimental repeats, where error bars in F and G represent the propagation of error from the difference of the observed rates.
FIGURE 6.
FIGURE 6.
Global fitting of mammalian E3 reverse progress curves, reverse/forward initial velocity, and equilibrium titration data to a 4-state redox model with redox-dependent equilibrium dissociation constants. A–F, pig heart E3 reverse reaction progress curve data were collected in different initially added amounts of NAD+ (0, 100, and 500 μm), shown as blue, green, and red circles, respectively. Model simulations (4-state model) are shown as solid lines of the corresponding data marker color. All time-dependent assays shown in A–F contained 500 μm initially added NADH. A–C and D–F contained 0.25 and 1 mm dl-lipoamide, respectively. pH was held fixed at 5.25, 6.25, and 8 shown in A–C and D–F, respectively. G–L, pig heart E3 pH-dependent reverse initial velocity data were collected in different initially added amounts of NAD+ (0, 100, and 500 μm), shown as blue, green, and red circles, respectively. Model simulations (4-state model) are shown as solid lines of the corresponding data marker color. Initial rates shown in G–I were obtained in 500 μm initially added NADH and 0.25 (G), 1 (H), and 3 mm (I) dl-lipoamide. Initial rates shown in J–L were obtained with 250 μm initially added NADH and 0.25 (J), 1 (K), and 3 mm (L) dl-lipoamide. M, pig heart E3 fractional redox states were obtained from the dihydrolipoamide equilibrium titration shown in Fig. 4, D–F. The oxidized, 2e reduced, and 4e reduced states as a function of dihydrolipoamide are shown as blue, green, and red circles, respectively. N, human liver E3 forward initial rate data as a function of pH was obtained from Fig. 5 of Ref. and fitted along all other datasets in this figure. O, forward initial rate data (circles) as a function of NAD+ in different fixed concentrations of dihydrolipoamide (25 (blue), 40 (green), 50 (red), 100 (magenta), 250 (cyan), 500 (yellow), and 750 μm (black)) were taken from the top of Fig. 1 in (63) and simulated (lines) with globally fitted parameters along with all other datasets shown in this figure. P–R, α values (blue circles) obtained from Figs. 2C, 3C, and 4C were simulated (blue lines) with globally fitted parameters assuming rapid equilibrium binding of each ligand described by their corresponding enzyme state fractional occupancies (Equation 3). Error bars represent standard deviations of the data from at least three experimental repeats, and error bars for literature-derived data sets (M–O) were assigned a 10% error according to the maximum ordinate value.
FIGURE 7.
FIGURE 7.
Calculated mammalian E3 4-state redox steady-state distribution. The 4-state, redox steady-state distribution as a function of NAD+/NADH, Lipo/DHL, and pH was calculated using the globally fitted parameters (Table 1) obtained from fitting the data shown in Fig. 6. NAD+/NADH ratio values were selected based on a wide range found in the literature (56, 57), and Lipo/DHL ratio values were arbitrarily chosen. The total concentration of lipoamide and NAD was fixed to 10 and 3 mm, respectively, according to literature estimates (54). The concentration of lipoamide is based on a previous estimation considering the stoichiometry and volume of the pyruvate dehydrogenase complex (1).
FIGURE 8.
FIGURE 8.
Calculated mammalian E3 NAD+/NADH, Lipo/DHL, and pH-dependent flux surface. The globally fitted parameters (Table 1) obtained by fitting the data in Fig. 6 to the 4-state redox model were used to calculate the mam-E3 NAD+/NADH, Lipo/DHL, and pH-dependent flux surfaces. A, Mam-E3 flux as a function of NAD+/NADH and pH, at a constant Lipo/DHL ratio of 1, was used to calculate the mammalian E3 flux surface. B, E3 flux (NAD+/NADH, pH, Lipo/DHL = 1) cross-sections at pH 5, 6, 7, 7.5, and 8. The black dashed line is a reference for zero flux. C, E3 flux as a function of NAD+/NADH and Lipo/DHL, at a constant pH of 7.2, was used to calculate the mam-E3 flux surface. D, E3 flux (NAD+/NADH, pH = 7.2, Lipo/DHL) cross-sections at Lipo/DHL ratios of 0.1, 1, and 10. The black dashed line is a reference for zero flux. In all panels, the forward and reverse fluxes are defined as being positive and negative, respectively. The forward flux is defined from left to right in Reaction 1.
FIGURE 9.
FIGURE 9.
Calculated E. coli E3 NAD+/NADH, Lipo/DHL, and pH-dependent flux surface. The globally fitted parameters obtained from Moxley et al. (41), to the 3-state redox-dependent Kd model, were used to calculate the E. coli E3 NAD+/NADH, Lipo/DHL, and pH-dependent flux surfaces. A, E. coli E3 flux as a function of NAD+/NADH and pH, at a constant Lipo/DHL ratio of 1, was used to calculate the E. coli E3 flux surface. B, E. coli E3 flux (NAD+/NADH, pH, Lipo/DHL = 1) cross-sections at pH 5, 6, 7, 7.5, and 8. C, E. coli E3 flux as a function of NAD+/NADH and Lipo/DHL, at a constant pH of 7.2, was used to calculate the E. coli E3 flux surface. D, E. coli E3 flux (NAD+/NADH, pH = 7.2, Lipo/DHL) cross-sections at Lipo/DHL ratios of 0.1, 1, and 10. The black dashed line is a reference for zero flux. In all panels, the forward and reverse fluxes are defined as being positive and negative, respectively. The forward flux is defined from left to right in Reaction 1 in the text.
FIGURE 10.
FIGURE 10.
Calculated E. coli E3 NAD+/NADH, Lipo/DHL, and pH-dependent flux surface. The globally fitted parameters obtained from Moxley et al. (41), to the 3-state redox-dependent Kd model, were used to calculate the E. coli E3 NAD+/NADH, Lipo/DHL, and pH-dependent flux surfaces. A, E. coli E3 flux as a function of NAD+/NADH and pH, at a constant Lipo/DHL ratio of 5, was used to calculate the E. coli E3 flux surface. B, E. coli E3 flux (NAD+/NADH, pH, Lipo/DHL = 5) cross-sections at pH 7, 7.5, and 8. C, E. coli E3 flux as a function of NAD+/NADH and Lipo/DHL, at a constant pH of 7.5, was used to calculate the E. coli E3 flux surface. D, E. coli E3 flux (NAD+/NADH, pH 7.5, and Lipo/DHL) cross-sections at a Lipo/DHL ratio of 1. The black dashed line is a reference for zero flux. In all panels, the forward and reverse fluxes are defined as being positive and negative, respectively. The forward flux is defined from left to right in Reaction 1 in the text.
FIGURE 11.
FIGURE 11.
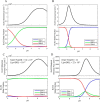
Mammalian E3 pH-dependent forward/reverse kcat and maximal forward/reverse pH-dependent fluxes with corresponding enzyme fractional states. A, top, mammalian E3 forward kcat as a function of pH was calculated as described under “Experimental Procedures” using globally fitted parameters (Table 1) obtained by fitting the data in Fig. 6 to the 4-state redox model. Bottom, enzyme redox fractional states corresponding to the forward kcat in A were calculated as described under “Experimental Procedures.” B, top, mammalian E3 reverse kcat as a function of pH was calculated in the same manner as the forward kcat and as described under “Experimental Procedures.” Bottom, enzyme redox fractional states corresponding to the reverse kcat were calculated as described under “Experimental Procedures.” C, top, parameterized (Table 1) 4-state redox-dependent flux expression was maximized using NAD+/NADH, Lipo/DHL, and pH as adjustable parameters to produce a flux maximized in the forward direction, shown as a function of pH. The lipoamide and NAD pool were constrained to 10 and 3 mm, respectively. Bottom, enzyme redox fractional states corresponding to the flux were computed with the resulting NAD+/NADH and Lipo/DHL ratios of 1012 and 10−12 respectively, as a function of pH. D, top, parameterized (Table 1) 4-state redox flux expression was maximized using NAD+/NADH, Lipo/DHL, and pH as adjustable parameters to produce a maximal flux in the reverse direction, shown as a function of pH. The lipoamide and NAD pool were constrained to 10 and 3 mm, respectively. Bottom, enzyme redox fractional states corresponding to the flux were computed with the resulting NAD+/NADH and Lipo/DHL ratios of 10−12 and 1012, respectively, as a function of pH. Table 2 provides the fitted parameter values for this analysis.
FIGURE 12.
FIGURE 12.
E. coli E3 pH-dependent forward/reverse kcat and maximal pH-dependent forward/reverse fluxes with corresponding enzyme fractional states. A, top, E. coli E3 forward kcat as a function of pH was calculated, as described under “Experimental Procedures,” using globally fitted parameters obtained from Moxley et al. (41) to a 3-state redox-dependent Kd model. Bottom, enzyme redox fractional states corresponding to the forward kcat were calculated as described under “Experimental Procedures.” B, top, E. coli E3 reverse kcat as a function of pH was calculated, as described under “Experimental Procedures,” using globally fitted parameters obtained from Moxley et al. (41) to a 3-state redox-dependent Kd model. Bottom, enzyme redox fractional states corresponding to the reverse kcat were calculated as described under “Experimental Procedures.” C, top, flux expression parameterized by globally fitted parameters obtained from Moxley et al. (41), to the 3-state redox-dependent Kd model, was maximized in the forward direction using NAD+/NADH, Lipo/DHL, and pH as adjustable parameters and shown as a function of pH. Lipoamide and NAD pools were constrained to 10 and 3 mm, respectively. Bottom, enzyme redox fractional states corresponding to the flux were computed with the resulting NAD+/NADH and Lipo/DHL ratios of 9.6 × 10¹¹ and 10−12, respectively, as a function of pH. D, top, flux expression parameterized by globally fitted parameters obtained from Moxley et al. (41), to the 3-state redox-dependent Kd model, was maximized in the reverse direction using NAD+/NADH, Lipo/DHL, and pH as adjustable parameters and shown as a function of pH. Lipoamide and NAD pools were constrained to 10 and 3 mm, respectively. Bottom, enzyme redox fractional states corresponding to the flux were computed with the resulting NAD+/NADH and Lipo/DHL ratios of 22 and 22 × 1011, respectively, as a function of pH. Table 2 provides the fitted parameter values for this analysis.
FIGURE 13.
FIGURE 13.
Maximal mammalian and E. coli E3 reverse flux at fixed pH values via NAD+/NADH and Lipo/DHL ratio optimization. A–C, 4-state redox-dependent Kd model flux expression parameterized (Table 1) by globally fitting the data shown in Fig. 6 was maximized in reverse mam-E3 flux using the NAD+/NADH and Lipo/DHL ratios as adjustable parameters at fixed pH values. D–F, Ec-E3 reverse flux was maximized in the same manner as the mam-E3 reverse flux using a 3-state redox-dependent Kd model described and parameterized in Moxley et al. (41). In each case, the total concentration of lipoamide and NAD was fixed to 10 and 3 mm, respectively, according to literature estimates (54, 57). The concentration of lipoamide is based on a previous estimation considering the stoichiometry and volume of the pyruvate dehydrogenase complex (1). The optimized value of the Lipo/DHL ratio was approximately the upper bound of 1012 in all cases. Fitted NAD+/NADH values were given tighter boundaries compared with optimizations shown in Figs. 11 and 12, as described under “Experimental Procedures.” A, maximal mam-E3 reverse flux at fixed pH values using NAD+/NADH and lipo/DHL ratios as adjustable parameters with the 4-state redox model flux expression. B, fitted NAD+/NADH ratios at fixed pH values for the mam-E3 reverse flux optimization. C, calculated mammalian fractional enzyme states at fixed pH values, using the fitted NAD+/NADH and Lipo/DHL ratios, in B. D, maximized Ec-E3 reverse flux at fixed pH values using NAD+/NADH and lipo/DHL ratios as adjustable parameters with the 3-state redox model flux expression described and parameterized in Moxley et al. (41). E, fitted NAD+/NADH ratios at fixed pH values for the Ec-E3 reverse flux optimization. F, calculated E. coli fractional enzyme states at fixed pH values using the fitted NAD+/NADH and Lipo/DHL ratios in E.
FIGURE 14.
FIGURE 14.
Maximal mammalian and E. coli E3 forward flux at fixed pH values via NAD/NADH and Lipo/DHL ratio optimization. A–C, 4-state redox model flux expression parameterized (Table 1) by globally fitting the data shown in Fig. 6 was maximized in forward mammalian E3 flux using the NAD+/NADH and Lipo/DHL ratios as adjustable parameters at fixed pH values. D–F, the E. coli E3 forward flux was maximized in the same manner as the mammalian E3 forward flux using a 3-state redox-dependent Kd model described and parameterized in Moxley et al. (41). In each case, the total concentration of lipoamide and NAD was fixed to 10 and 3 mm, respectively, according to literature estimates (54). The concentration of lipoamide is based on a previous estimation considering the stoichiometry and volume of the pyruvate dehydrogenase complex (1). The optimized value of the Lipo/DHL ratio was approximately the lower bound of 10−12 in all cases. Fitted NAD+/NADH values were given tighter boundaries compared with optimizations shown in Figs. 11 and 12, as described under “Experimental Procedures.” A, maximal mammalian E3 forward flux at fixed pH values using NAD+/NADH and lipo/DHL ratios as adjustable parameters with the 4-state redox model flux expression parameterized (Table 1) with the data in Fig. 6. B, fitted NAD+/NADH ratios at fixed pH values for the mammalian E3 forward flux optimization. C, calculated mammalian fractional enzyme states at fixed pH values, using the fitted NAD+/NADH and Lipo/DHL ratios, in B. D, maximized E. coli E3 forward flux at fixed pH values using NAD+/NADH and lipo/DHL ratios as adjustable parameters with the 3-state redox model flux expression described and parameterized in Moxley et al. (41). E, fitted NAD+/NADH ratios at fixed pH values for the E. coli E3 forward flux optimization. F, calculated E. coli fractional enzyme states at fixed pH values using the fitted NAD+/NADH and Lipo/DHL ratios in E.

Similar articles

Cited by

References

    1. Perham R. N. (2000) Swinging arms and swinging domains in multifunctional enzymes: catalytic machines for multistep reactions. Annu. Rev. Biochem. 69, 961–1004 - PubMed
    1. Massey V. (1960) The identity of diaphorase and lipoyl dehydrogenase. Biochim. Biophys. Acta 37, 314–322 - PubMed
    1. Massey V., Gibson Q. H., and Veeger C. (1960) Intermediates in the catalytic action of lipoyl dehydrogenase (diaphorase). Biochem. J. 77, 341–351 - PMC - PubMed
    1. Brautigam C. A., Chuang J. L., Tomchick D. R., Machius M., and Chuang D. T. (2005) Crystal structure of human dihydrolipoamide dehydrogenase: NAD+/NADH binding and the structural basis of disease-causing mutations. J. Mol. Biol. 350, 543–552 - PubMed
    1. Patel M. S., Nemeria N. S., Furey W., and Jordan F. (2014) The pyruvate dehydrogenase complexes: structure-based function and regulation. J. Biol. Chem. 289, 16615–16623 - PMC - PubMed

Publication types

LinkOut - more resources