. 2015 Dec 22;112(51):E7093-100.
doi: 10.1073/pnas.1514789112. Epub 2015 Dec 7.

The ancestral gene repertoire of animal stem cells

Affiliations

The ancestral gene repertoire of animal stem cells

Alexandre Alié et al. Proc Natl Acad Sci U S A. .

Abstract

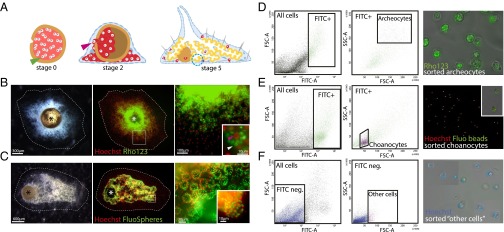
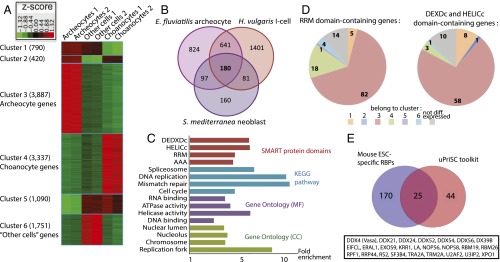
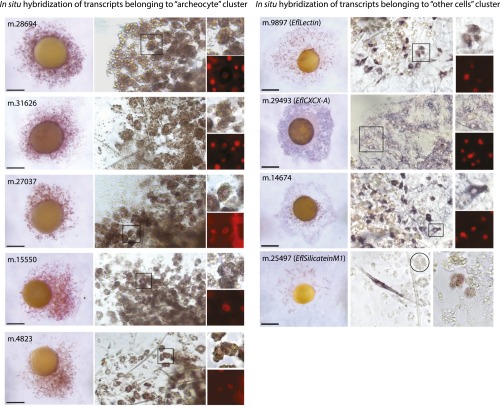
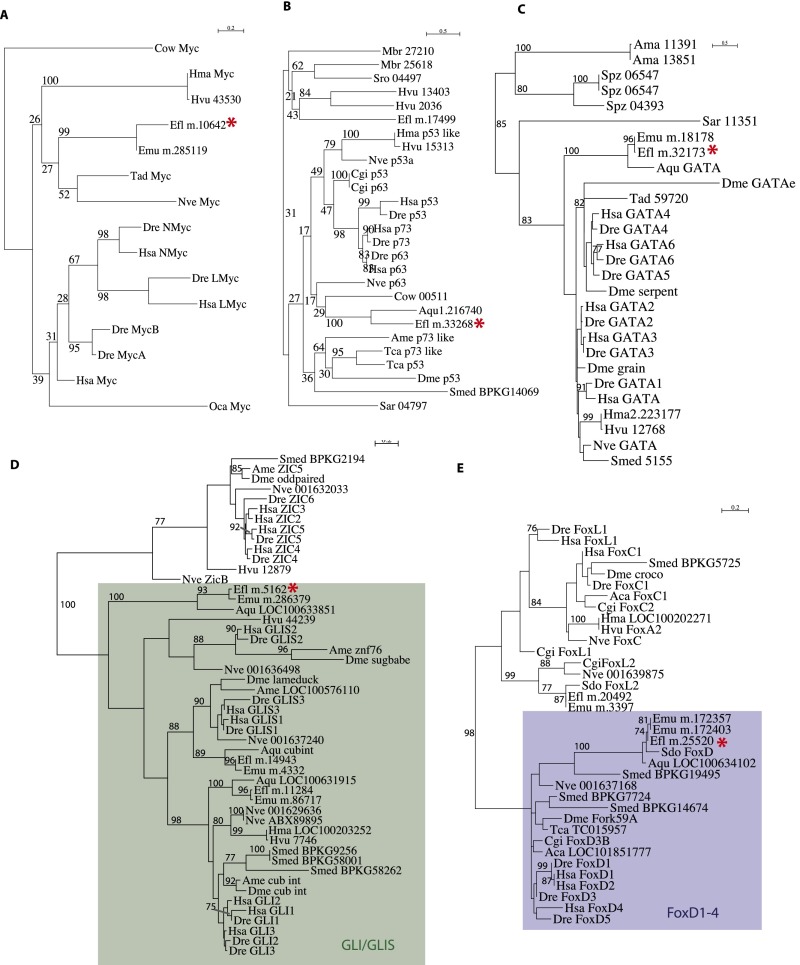
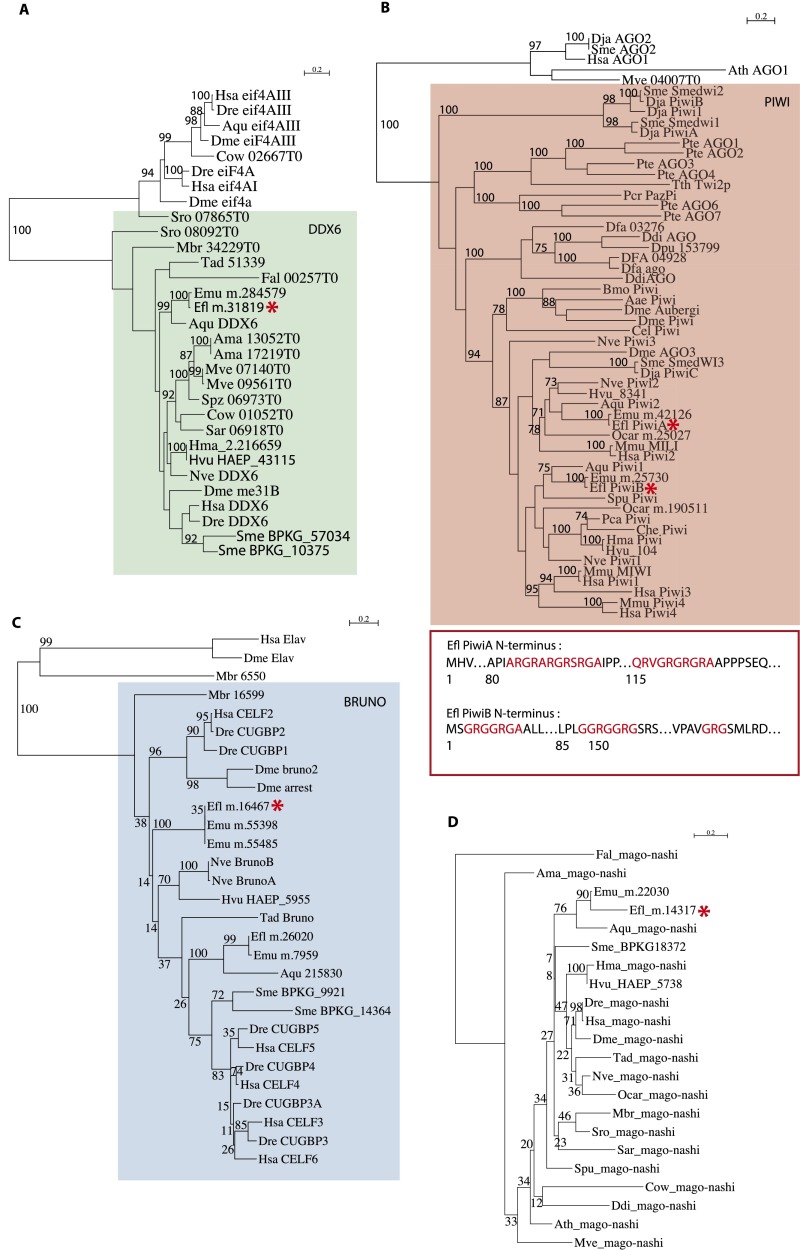
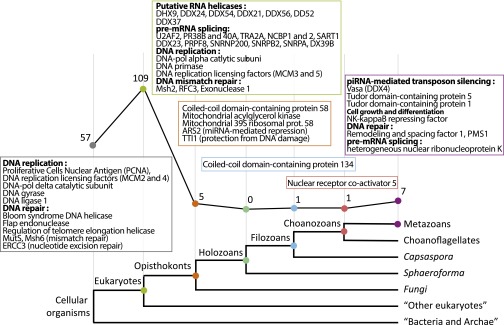
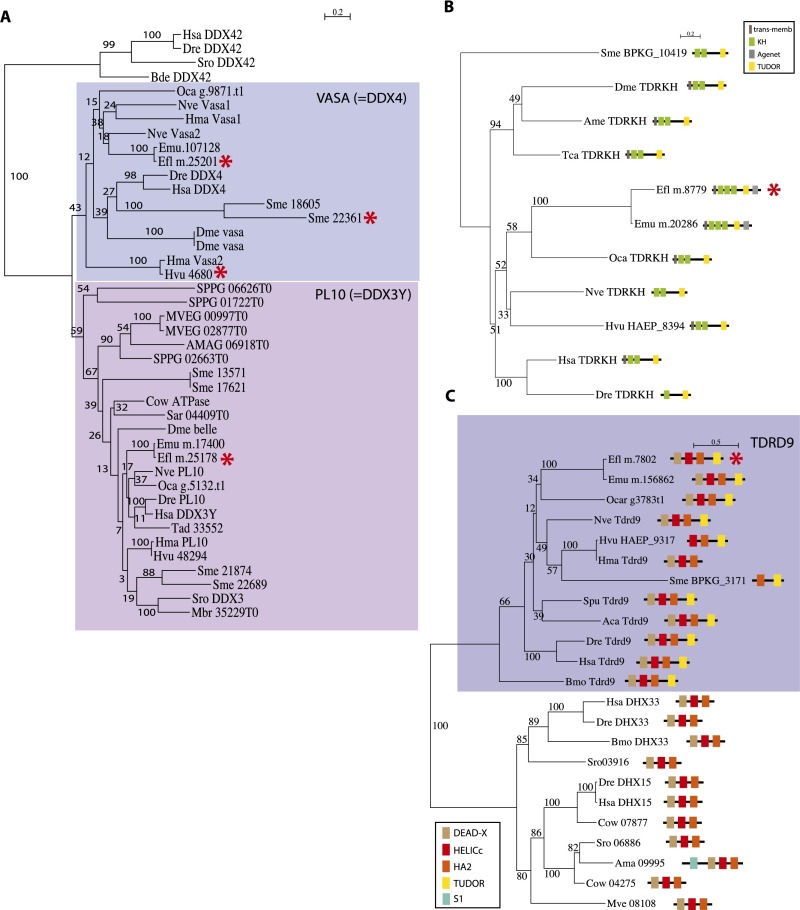
Stem cells are pivotal for development and tissue homeostasis of multicellular animals, and the quest for a gene toolkit associated with the emergence of stem cells in a common ancestor of all metazoans remains a major challenge for evolutionary biology. We reconstructed the conserved gene repertoire of animal stem cells by transcriptomic profiling of totipotent archeocytes in the demosponge Ephydatia fluviatilis and by tracing shared molecular signatures with flatworm and Hydra stem cells. Phylostratigraphy analyses indicated that most of these stem-cell genes predate animal origin, with only few metazoan innovations, notably including several partners of the Piwi machinery known to promote genome stability. The ancestral stem-cell transcriptome is strikingly poor in transcription factors. Instead, it is rich in RNA regulatory actors, including components of the "germ-line multipotency program" and many RNA-binding proteins known as critical regulators of mammalian embryonic stem cells.

Keywords: Porifera; RNA binding; evolution; stem cells; uPriSCs.


Conflict of interest statement

The authors declare no conflict of interest.

Figures

Fig. 1.
Fig. 1.
Staining of cells from juvenile Ephydatia and FACS sorting of archeocytes, choanocytes, and other cells. (A) Gemmule hatching process. Blue dotted circle, choanocyte chamber; green arrowhead, thesocyte; pink arrowhead, archeocyte. (B) Stage 2 juvenile E. fluviatilis (Left), Hoechst 33342 and Rho123 counterstaining (Middle), and magnified archeocytes (Right) containing Rhodamine-stained vitelline platelets (Inset, white arrowhead) and a large nucleolated nucleus (Inset, red arrowhead). (C) Stage 5 juvenile E. fluviatilis (Left), Hoechst 33342 and FluoSphere counterstaining (Middle), and magnified stained choanocyte chambers (Right and Inset) containing fluorescent beads (green). Asterisks in B and C indicate the gemmule coat. (D) FACS gate for archeocytes (Left panels) and photograph showing purified cells (Right panel) (large size and strong green fluorescence). (E) FACS gate for choanocytes (Left panels) and photograph showing purified cells (Right) (small size and strong green fluorescence). Inset shows two choanocytes with several ingested fluorescent beads. (F) FACS gate for other cells (Left panels) and purified cells (Right) (heterogeneous size and weak or no green fluorescence). Note that several fields have been combined to show the heterogeneity of cell sizes in that fraction. FITC-A, green fluorescence; FSC-A, forward scatter; SSC-A, side scatter.
Fig. 2.
Fig. 2.
Transcriptomic signature of archeocyte and uPriSC genes. (A) Heat map of the 11,275 genes differentially expressed between archeocytes, choanocytes, and other cells. (B) Venn diagram showing the 180 OrthoMCL groups overexpressed in the interstitial stem cells of H. vulgaris, the neoblasts of S. mediterranea, and the archeocytes of E. fluviatilis. (C) Enriched functional categories in the uPriSC repertoire (FDR < 5e-2). In each of the four annotation sources depicted, terms are ordered by FDR value (with the lower values on top). The full enrichment study data are provided in Dataset S2, Table S5. (D) Number of putative RBPs belonging to each expression cluster. DEAD-box helicases are on the right and RRM-containing genes on the left. (E) Venn diagram showing the 25 OrthoMCL groups corresponding to RBPs from mouse ESCs that belong to the uPriSC repertoire.
Fig. S1.
Fig. S1.
RNA-seq data analysis with EdgeR. (Top Left) Multidimensional scaling (MDS) plot from EdgeR analysis showing reproducibility between biological duplicates. FC, fold change; other49 and other44, cho46 and cho48, and arch43 and arch47 designate the biological duplicates for the samples of other cells, choanocytes, and archeocytes, respectively. Smear plots from EdgeR showing, in red, transcripts differentially expressed (FDR < 0.05) between, respectively, archeocytes and choanocytes (Top Right), archeocytes and other cells (Bottom Left), and choanocytes and other cells (Bottom Right). cpm, counts per million.
Fig. S2.
Fig. S2.
Controls of the specificity of the differential transcriptomic datasets with respect to corresponding cell types. Left panel, in situ hybridization for five genes belonging to the cluster archeocytes showing expression in cells with typical archeocyte morphology (nucleus with prominent nucleolus and many vitelline platelets). Images in the right column show enlarged views of stained archeocytes in the boxed areas in the middle column. (Scale bars, 300 µm.). Right panel, in situ hybridization for four genes belonging to the cluster other cells showing expression in diverse cell types (mesohyl cells for m.9897 and m.14674; basopinacocytes for m.29493; sclerocytes and archeocytes committed to sclerocyte fate for m.25497). (Scale bars, 400 µm.) Circle in m.25497 shows an unstained archeocyte.
Fig. S3.
Fig. S3.
ML phylogenetic analyses of TFs overexpressed in archeocytes. (A) Myc. (B) p53. (C) GATA. (D) Gli/Glis. (E) FoxD1–4. Red asterisks indicate Ephydatia transcripts overexpressed in archeocytes. The following is a list of abbreviations used for species names: Aae, Aedes aegypti; Aca, Aplysia californica; Ama, A. macrogynus; Ame, Apis mellifera; Aqu, Amphimedon queenslandica; Ath, Arabidopsis thaliana; Bde, Batrachochytrium dendrobatidis; Bmo, Bombyx mori; Cel, Caenorhabditis elegans; Cgi, Crassostrea gigas; Che, Clytia hemisphaerica; Cow, C. owczarzaki; Ddi, Dictyostelium discoideum; Dfa, Dictyostelium fasciculatum; Dja, Dugesia japonica; Dme, Drosophila melanogaster; Dre, Danio rerio; Efl, E. fluviatilis (from this study); Emu, E. muelleri; Fal, F. alba; Hma, Hydra magnipapillata; Hsa, Homo sapiens; Hvu HAEP, H. vulgaris (from ref. 8); Mbr, M. brevicollis; Mmu, Mus musculus; Mve, M. verticillata; Nve, Nematostella vectensis; Oca, Oscarella carmela; Pca, Podocoryne carnea; Pcr, Pseudourostyla cristata; Pte, Paramecium tetraurelia; Sar, S. arctica; Sme, S. mediterranea (from ref. 10); Sme BPKG, S. mediterranea (from ref. 12); Spu, Strongylocentrotus purpuratus; Spz, S. punctatus; Sro, S. rosetta; Tad, Trichoplax adherens; Tca, Tribolium castaneum; Tth, Tetrahymena sp.
Fig. S4.
Fig. S4.
ML phylogenetic analyses of GMP components (DDX6, Piwi, Bruno, and Mago-nashi) overexpressed in archeocytes. (A) DDX6. (B) Piwi. (C) Bruno. (D) Mago-Nashi. For Piwi, the diagram shows putative symmetrical dimethylation of arginine motifs (in red) in E. fluviatilis Piwi sequences. Red asterisks indicate Ephydatia transcripts overexpressed in archeocytes. For a list of abbreviations used for species names, see the Fig. S3 legend.
Fig. 3.
Fig. 3.
The phylogenetic history of the uPriSC repertoire. Most of the 180 metazoan uPriSC repertoire genes are of ancient origin. The Bottom panel shows the phylostrata to which orthoMCL groups were assigned (adapted from ref. 33). The x axis of the graph corresponds to the phylostrata (branches of the tree). Numbers plotted along the y axis (and indicated next to dots of the graph) indicate how many orthology groups belong to each phylostratum. For phylostrata “cellular organisms” and “eukaryotes,” selected examples of acquired genes are indicated in boxes, whereas for the other phylostrata, all corresponding genes are given.
Fig. S5.
Fig. S5.
ML phylogenetic analyses of GMP components (Vasa, Tdrd9, and Tdrkh) overexpressed in archeocytes. (A) Vasa. (B) Tdrkh. (C) Tdrd9. For Trdrkh and Tdrd9, the domain composition is displayed and Ephydatia transcripts overexpressed in archeocytes are indicated by a red asterisk. In the Vasa tree, asterisks indicate genes from Ephydatia, Hydra, and Schmidtea that belong to the uPriSC gene repertoire. List of abbreviations used for species names is given in the Fig. S3 legend.

Similar articles

Cited by

References

    1. Solana J. Closing the circle of germline and stem cells: The primordial stem cell hypothesis. Evodevo. 2013;4(1):2–16. - PMC - PubMed
    1. Tiozzo S, Brown FD, De Tomaso AW. Regeneration and stem cells in ascidians. In: Bosch TCG, editor. Stem Cells from Hydra to Man. Springer; Berlin: 2008. pp. 95–112.
    1. De Mulder K, et al. Characterization of the stem cell system of the acoel Isodiametra pulchra. BMC Dev Biol. 2009;9:69. - PMC - PubMed
    1. Shibata N, et al. Comprehensive gene expression analyses in pluripotent stem cells of a planarian, Dugesia japonica. Int J Dev Biol. 2012;56(1-3):93–102. - PubMed
    1. Agata K, et al. Two different evolutionary origins of stem cell systems and their molecular basis. Semin Cell Dev Biol. 2006;17(4):503–509. - PubMed

Publication types

Associated data