. 2015 Dec 22;112(51):15713-8.
doi: 10.1073/pnas.1522163112. Epub 2015 Dec 7.

BRD4 is a novel therapeutic target for liver fibrosis

Affiliations

BRD4 is a novel therapeutic target for liver fibrosis

Ning Ding et al. Proc Natl Acad Sci U S A. .

Abstract

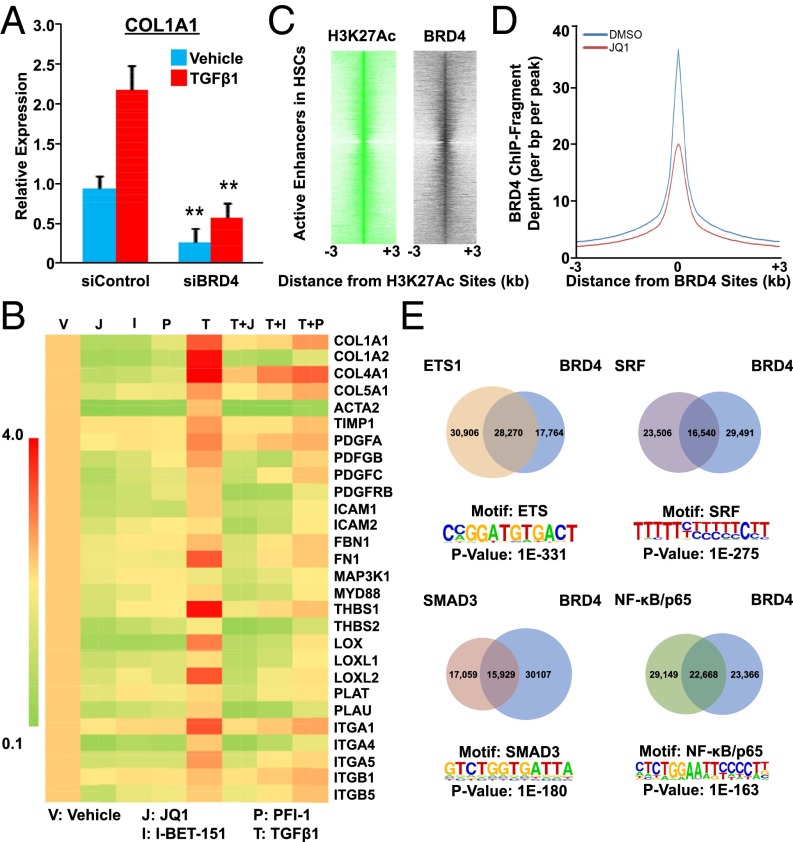
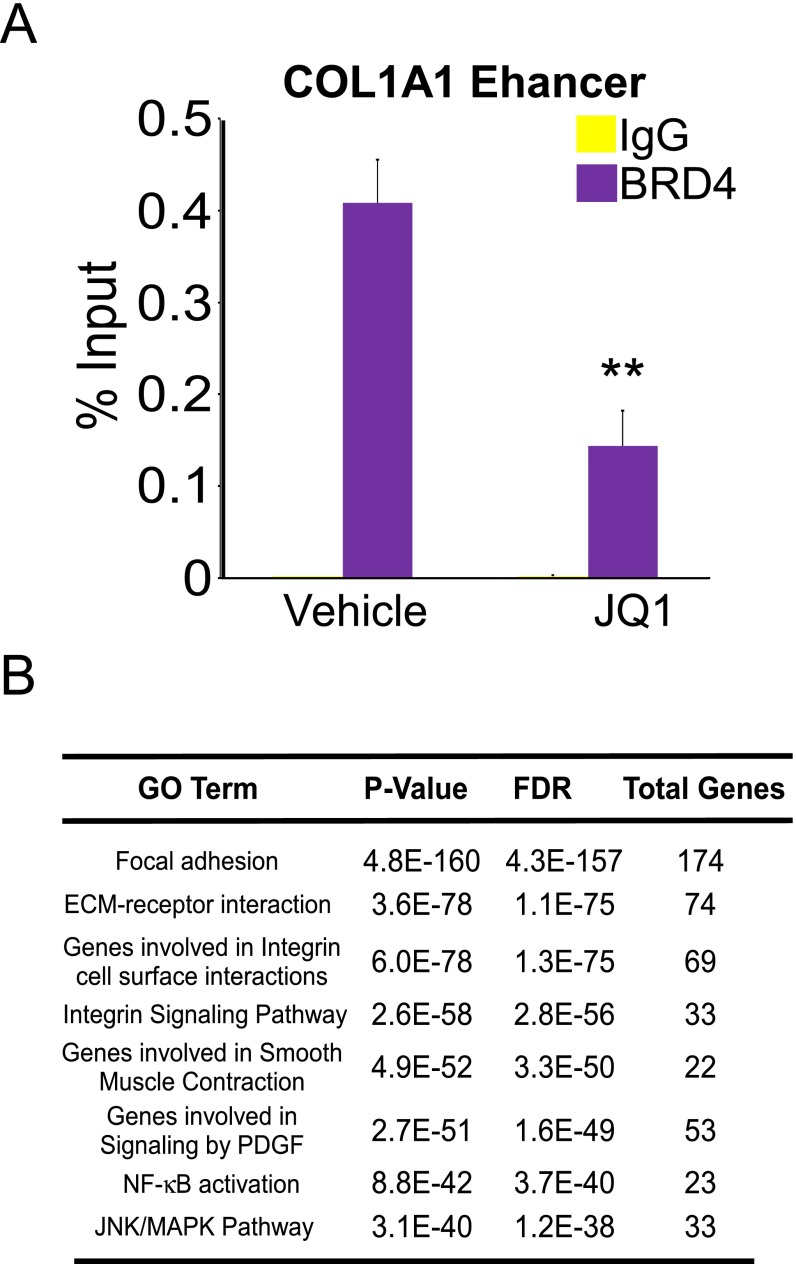
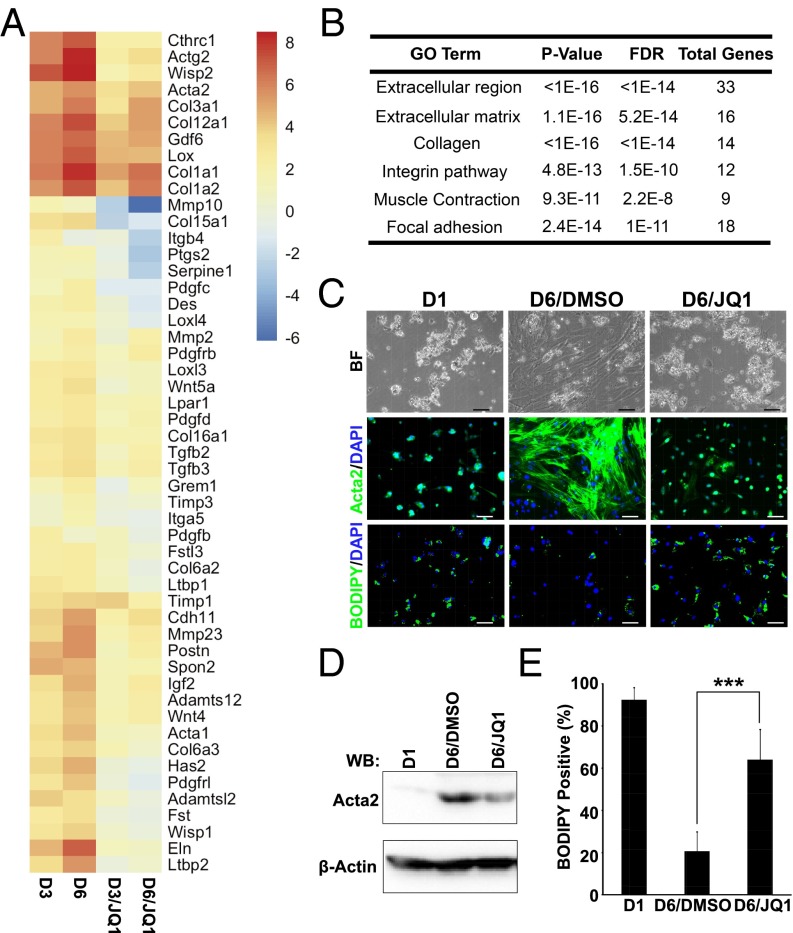
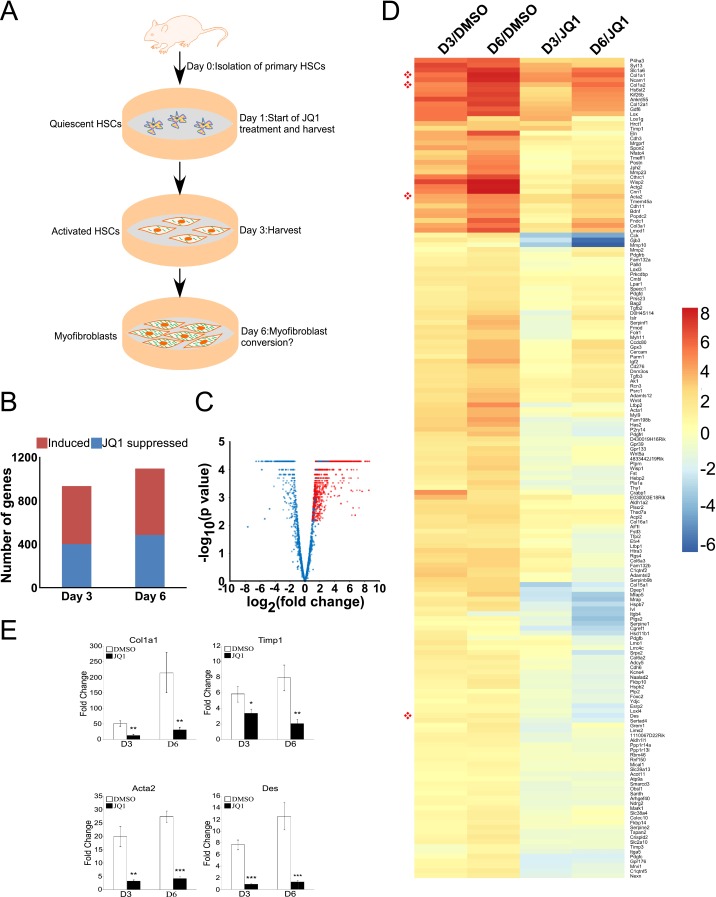
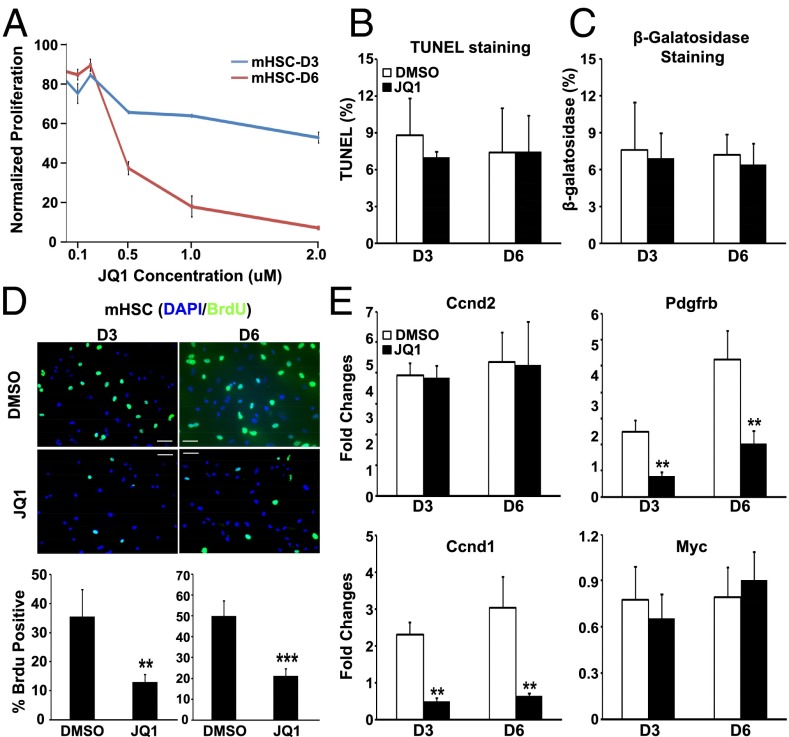
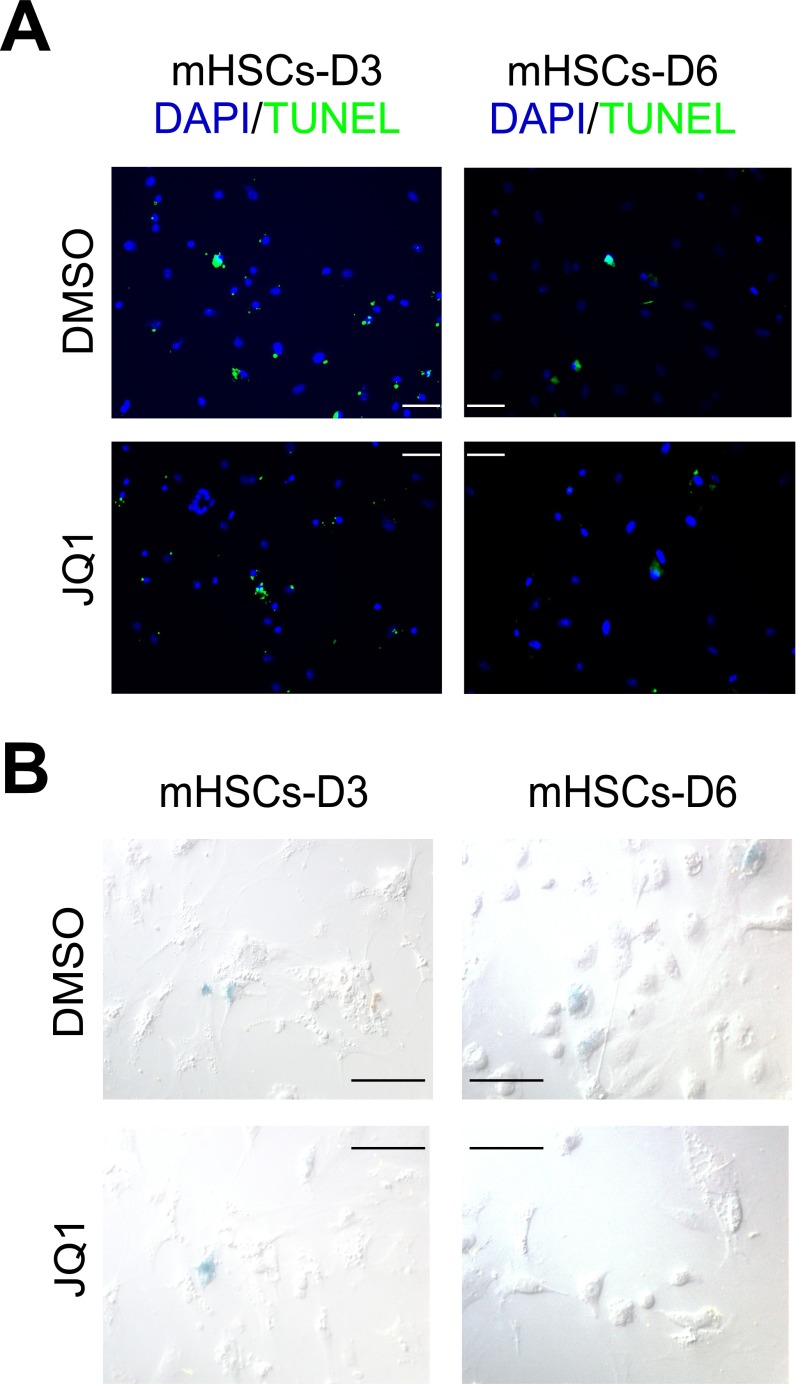
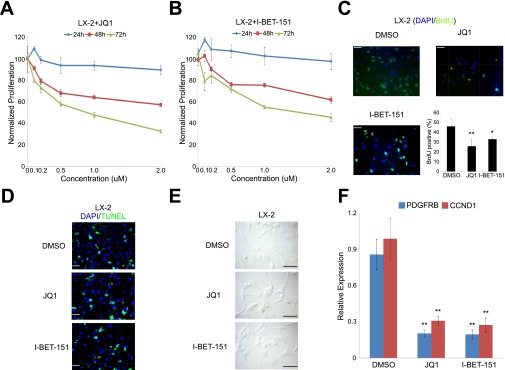
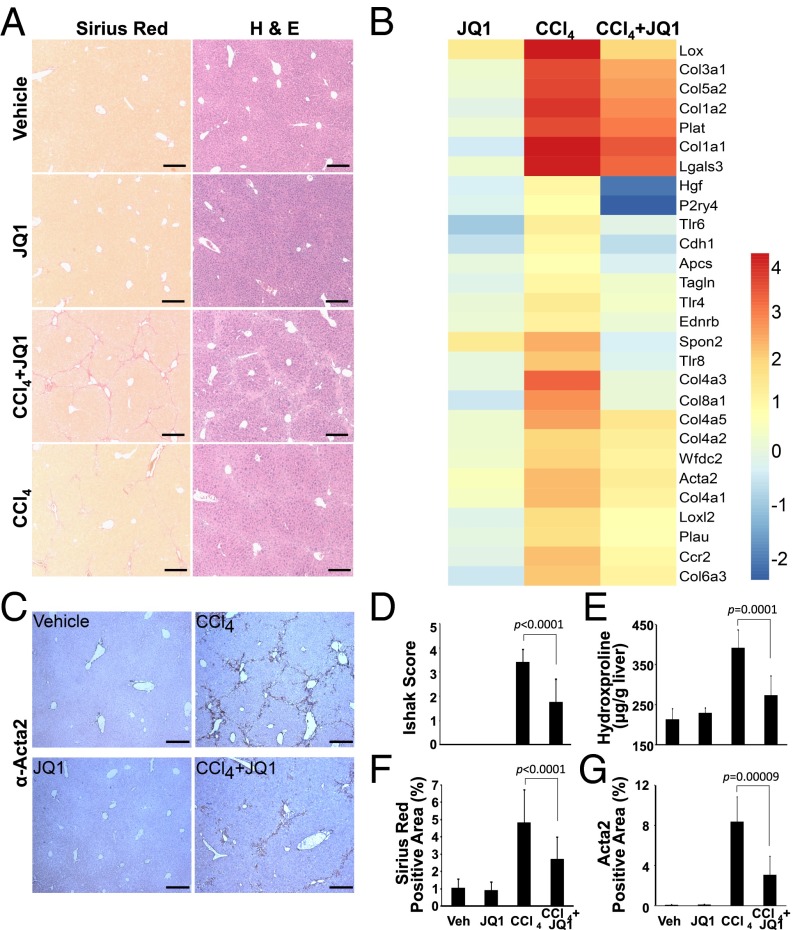
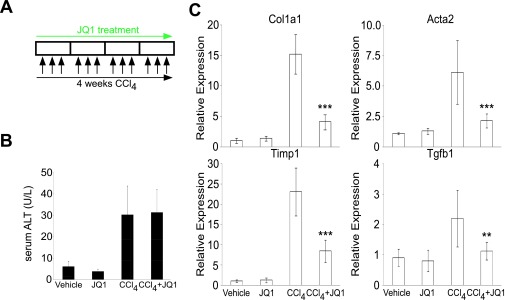
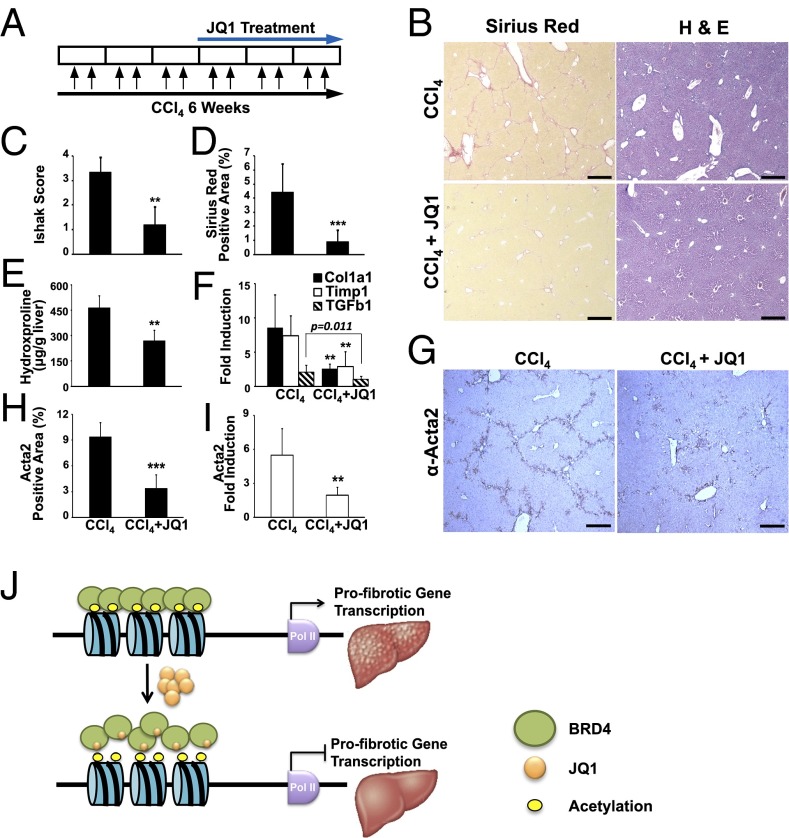
Liver fibrosis is characterized by the persistent deposition of extracellular matrix components by hepatic stellate cell (HSC)-derived myofibroblasts. It is the histological manifestation of progressive, but reversible wound-healing processes. An unabated fibrotic response results in chronic liver disease and cirrhosis, a pathological precursor of hepatocellular carcinoma. We report here that JQ1, a small molecule inhibitor of bromodomain-containing protein 4 (BRD4), a member of bromodomain and extraterminal (BET) proteins, abrogate cytokine-induced activation of HSCs. Cistromic analyses reveal that BRD4 is highly enriched at enhancers associated with genes involved in multiple profibrotic pathways, where BRD4 is colocalized with profibrotic transcription factors. Furthermore, we show that JQ1 is not only protective, but can reverse the fibrotic response in carbon tetrachloride-induced fibrosis in mouse models. Our results implicate that BRD4 can act as a global genomic regulator to direct the fibrotic response through its coordinated regulation of myofibroblast transcription. This suggests BRD4 as a potential therapeutic target for patients with fibrotic complications.

Keywords: BET inhibitor; BRD4; antifibrotic therapy; hepatic stellate cell; liver fibrosis.


Conflict of interest statement

Conflict of interest statement: N.D., R.T.Y., M.H.S., C.L., M.D., and R.M.E. are coinventors of technologies related to methods of treating fibrosis using BET inhibitors and may be entitled to royalties.

Figures

Fig. 1.
Fig. 1.
BRD4 modulates profibrotic response from genome in activated HSCs. (A) COL1A1 expression in control (siCNTL) or BRD4-specific (siBRD4) siRNA-transfected LX-2 cells treated with or without TGF-β1 (5 ng/mL for 16 h) as measured by RT-qPCR. Data represent the mean ± SEM of at least three independent experiments performed in triplicate. Asterisks denote statistically significant differences (Student's t test, *P < 0.05, **P < 0.01, ***P < 0.001). (B) Fold change of profibrotic gene expression in LX-2 cells treated with BRD4 inhibitors (JQ1 500 nM; I-BET 500 nM; and PFI-1 500 nM) with or without TGF-β1 (5 ng/mL for 16 h). Gene expression levels in cells treated with vehicle (DMSO) were arbitrarily set as 1. Data represent the mean ± SEM of at least three independent experiments performed in triplicate. (C) Intensity plots showing hierarchical clustering of ChIP-fragment densities as a function of distance from the center of statistically significant H3K27ac peaks (FDR = 0.0001) outside promoter regions (±2 kb of transcription start site). Intensity around position 0 of BRD4 (black) indicates overlapping BET/H3K27ac sites with H3K27ac (green) acting as a positive control. (D) Plots of BRD4 ChIP-Seq signal intensity relative to the center of their binding sites in LX-2 cells (±500 nM JQ1 for 16 h). (E) De novo analysis of most enriched motifs located within 100 bp of BRD4 peaks in LX-2 cells (FDR = 0.0001) and Venn diagram depicting overlap of BRD4 and ETS1/SRF/NF-κB/SMAD3 genomic binding sites in LX-2 cells.
Fig. S1.
Fig. S1.
Targeting of profibrotic enhancers by BRD4 in activated HSCs. (A) ChIP-qPCR at COL1A1 enhancer region in LX-2 cells treated with DMSO (vehicle) or JQ1 (500 nM, 16 h). Data represent the mean ± SEM of at least three independent experiments performed in triplicate. (B) Gene ontology (GO) analysis (MSigDB) of putative BRD4 target genes in LX-2 cells.
Fig. 2.
Fig. 2.
BRD4 inhibition blocks HSC activation. (A) Fold change of selected induced genes in primary activated HSCs treated with DMSO (0.1%) or JQ1 (500 nM) at different time points (days 3 and 6). Euclidean clustering of both rows and columns using log2-transformed mRNA-Seq expression data, n = 3 per treatment group. Bullets (red) indicate key fibrosis marker genes: Col1a1, Col1a2, Acta2, and Des. (B) Gene ontology (GO) analysis (MSigDB) of activation-induced genes that were suppressed by JQ1. (C) Representative images of quiescent (day 1: D1) and activated (day 6: D6) primary HSCs treated with DMSO (0.1%) or JQ1 (500 nM): bright field (Top), Acta2 immunofluorescence staining (Middle), and BODIPY staining (Bottom). (Scale bar, 50 μm.) (D) Expression of ACTA2 determined by Western blot analysis. (E) Quantitation of lipid-containing cells in C. Data represent the mean ± SEM of at least three independent experiments. Asterisks denote statistically significant differences (Student's unpaired t test, ***P < 0.001).
Fig. S2.
Fig. S2.
BRD4 inhibition suppresses profibrotic gene expression during HSC activation into myofibroblasts. (A) Diagram depicting in vitro HSC self-activation system. (B) Total numbers of genes induced during activation (red) and suppression of this induction by JQ1 (blue). (C) Volcano plot showing fold change (x axis) of JQ1 versus DMSO (shades of blue) on all genes up-regulated at both time points (days 3 and 6) versus day 1 (shades of red). Progression from light to dark shading represents increasing time (days 3 and 6). (D) Fold change of selected induced genes in primary activated HSCs treated with DMSO (0.1%) or JQ1 (500 nM) at different time points (days 3 and 6). Euclidean clustering of both rows and columns using log2-transformed mRNA-Seq expression data, n = 3 per treatment group. Bullets (red) indicate key fibrosis marker genes: Col1a1, Col1a2, Acta2, and Des. (E) Col1a1, Acta2, Timp1, and Des qRT-PCR analysis in primary murine HSCs treated with DMSO or JQ1 (500 nM) for indicated period. Data represent the mean ± SEM of at least three independent experiments performed in triplicate. Asterisks denote statistically significant differences (Student's t test, *P < 0.05, **P < 0.01, ***P < 0.001).
Fig. 3.
Fig. 3.
BRD4 inhibition blocks activated HSC proliferation. (A) Normalized proliferative activity of activated HSCs in the presence of the indicated JQ1 concentrations. (B) Apoptosis in JQ1-treated (500 nM) HSCs measured by TUNEL assay. (C) Cellular senescence of JQ1-treated (500 nM) HSCs measured by β-galactosidase staining. (D) BrdU incorporation in control (DMSO) and JQ1-treated (500 nM) HSCs. (E) Fold change in gene expression of Pdgfrb, Ccnd1, Ccnd2, and Myc in primary HSCs treated with DMSO or JQ1 (500 nM), as measured by RT-qPCR. Data represent the mean ± SEM of at least three independent experiments performed in triplicate. Asterisks denote statistically significant differences (Student's t test, *P < 0.05, **P < 0.01, ***P < 0.001). (Scale bar, 50 μM.)
Fig. S3.
Fig. S3.
No observable proapoptotic or prosenescent effects of JQ1 during HSC activation into myofibroblasts. (A) Representative images of TUNEL staining in primary murine HSCs treated with DMSO or JQ1 (500 nM) at the indicated time points. (B) Representative images of β-galactosidase staining to measure senescence in primary murine HSCs treated with DMSO or JQ1 (500 nM) at the indicated time points.
Fig. S4.
Fig. S4.
Antiproliferative properties of BET inhibitors in activated human HSCs. Antiproliferative activity of (A) JQ1 and (B) I-BET-151 against LX-2 cells. (C) BrdU incorporation assay in LX-2 cells treated with DMSO or JQ1/I-BET-151 (500 nM) for 72 h. (D) Detection of apoptosis in LX-2 cells treated with DMSO or JQ1/I-BET-151 (500 nM) for 72 h by TUNEL assay. (E) Detection of cellular senenscence in LX-2 cells treated with DMSO or JQ1/I-BET-151 (500 nM) for 72 h by β-galactosidase staining. (F) PDGFRB and CCND1 RT-qPCR analysis in LX-2 cells treated with DMSO or JQ1/I-BET-151 (500 nM) for 72 h. Data represent the mean ± SEM of at least three independent experiments performed in triplicate. Asterisks denote statistically significant differences (Student's t test, *P < 0.05, **P < 0.01, ***P < 0.001). (Scale bar, 50 μM.)
Fig. 4.
Fig. 4.
BRD4 inhibition protects against liver fibrosis. (A) Sirius red (Left) and hematoxylin and eosin (H&E, Right) staining of livers from 4-wk vehicle [corn oil plus 2-hydroxypropyl-β-cyclodextrin (HP-β-CD), n = 5], JQ1 (corn oil plus JQ1 50 mg/kg i.p., n = 5), carbon tetrachloride (CCl4 0.5 mL/kg plus HP-β-CD i.p., n = 10), and CCl4 plus JQ1 (n = 8) treated C57BL/6J mice. (Scale bar, 250 μm.) (B) Fold change of selected profibrotic genes in liver samples described in A. Euclidean clustering of both rows and columns using log2-transformed mRNA-Seq expression data, n = 3 per treatment group. (C) ACTA2 immunohistochemistry in liver samples described in A. Fibrosis quantified by (D) H&E staining (Ishak score), (E) hydroxyproline content, and (F) Sirius red staining. (G) Quantification of ACTA2 immunohistochemical staining in C. Data represent the mean ± SEM. Statistical significances are as indicated.
Fig. S5.
Fig. S5.
Serum ALT and gene expression analysis in prophylactic model of liver fibrosis. (A) Dosing regime in the preventive liver fibrosis model. (B) Hepatic injury was measured by serum ALT. (C) qRT-PCR measurement of hepatic gene expression levels of Col1a1, Acta2, Tgfβ1, and Timp1. Data represent the mean ± SEM. Asterisks denote statistically significant differences (Student's t test, *P < 0.05, **P < 0.01, ***P < 0.001).
Fig. 5.
Fig. 5.
Therapeutic benefits of BRD4 inhibition in liver fibrosis. (A) Dosing regime in the therapeutic liver fibrosis model. (B) Livers from 6-wk-treated C57BL/6J mice (CCl4, n = 10; CCl4+JQ1, n = 10) stained with Sirius red (Left) and hematoxylin and eosin (H&E, Right). (Scale bar, 250 μm.) Fibrosis quantified by (C) H&E staining (Ishak score), (D) Sirius red staining, and (E) hydroxyproline content. (F) Hepatic expression of Col1a1 and Timp1 measured by qRT-PCR. (G) HSC activation, determined by ACTA2 immunohistochemistry. (H) Quantification of ACTA2 immunohistochemical staining in G. (I) Hepatic expression of Acta2 measured by qRT-PCR. (J) Model depicting proposed epigenetic control of liver fibrogenesis by BETs. Data represent the mean ± SEM. Asterisks denote statistically significant differences (Student's unpaired t test, **P < 0.01, ***P < 0.001).

Comment in

  • Liver: Regulating profibrotic transcription.
    Thomas H. Thomas H. Nat Rev Gastroenterol Hepatol. 2016 Feb;13(2):62-3. doi: 10.1038/nrgastro.2015.222. Epub 2015 Dec 23. Nat Rev Gastroenterol Hepatol. 2016. PMID: 26695083 No abstract available.

References

    1. Wynn TA, Ramalingam TR. Mechanisms of fibrosis: Therapeutic translation for fibrotic disease. Nat Med. 2012;18(7):1028–1040. - PMC - PubMed
    1. Friedman SL, Sheppard D, Duffield JS, Violette S. Therapy for fibrotic diseases: Nearing the starting line. Sci Transl Med. 2013;5(167):167sr1. - PubMed
    1. Wynn TA. Cellular and molecular mechanisms of fibrosis. J Pathol. 2008;214(2):199–210. - PMC - PubMed
    1. Bataller R, Brenner DA. Liver fibrosis. J Clin Invest. 2005;115(2):209–218. - PMC - PubMed
    1. Friedman SL. Hepatic stellate cells: Protean, multifunctional, and enigmatic cells of the liver. Physiol Rev. 2008;88(1):125–172. - PMC - PubMed

Publication types

Associated data