. 2015 Dec 22;112(51):15585-90.
doi: 10.1073/pnas.1504493112. Epub 2015 Dec 7.

Detecting long-term metabolic shifts using isotopomers: CO2-driven suppression of photorespiration in C3 plants over the 20th century

Affiliations

Detecting long-term metabolic shifts using isotopomers: CO2-driven suppression of photorespiration in C3 plants over the 20th century

Ina Ehlers et al. Proc Natl Acad Sci U S A. .

Abstract

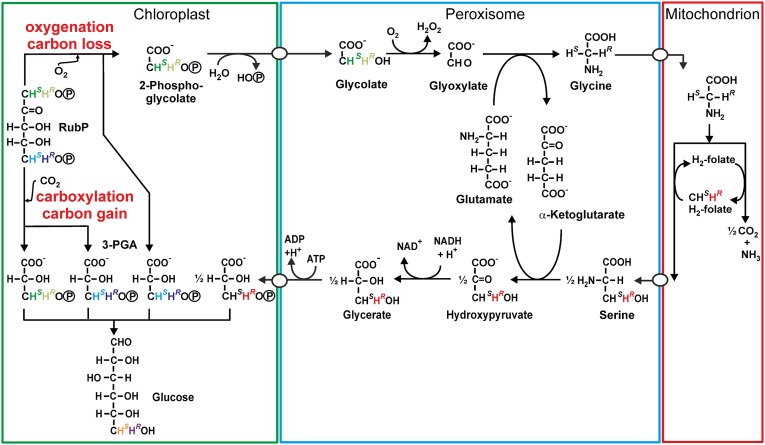
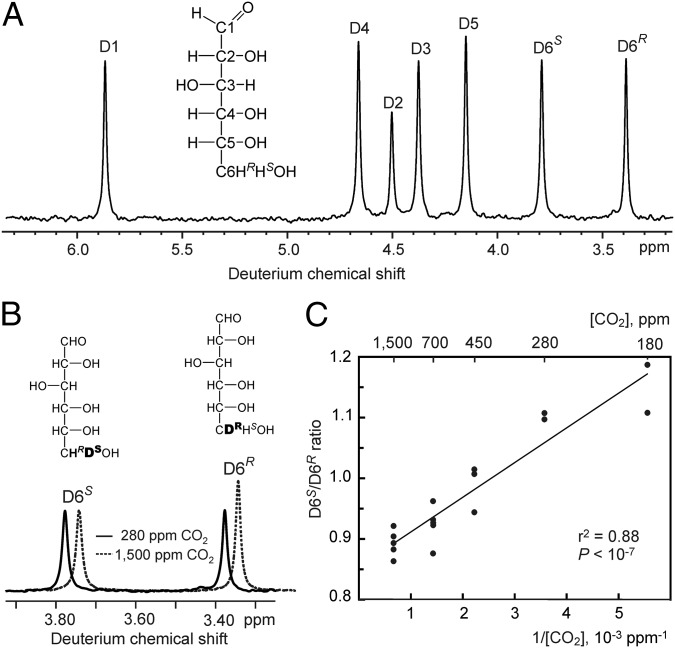
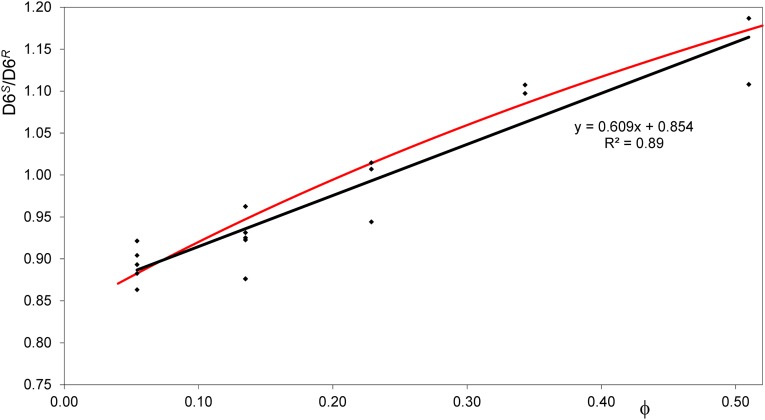
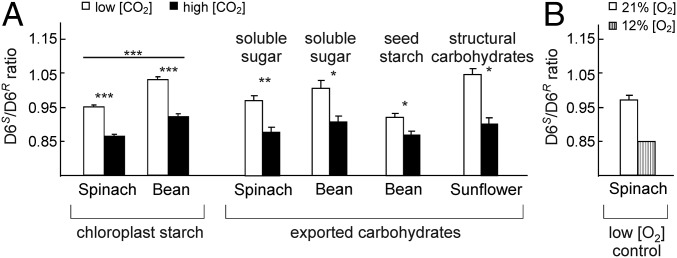
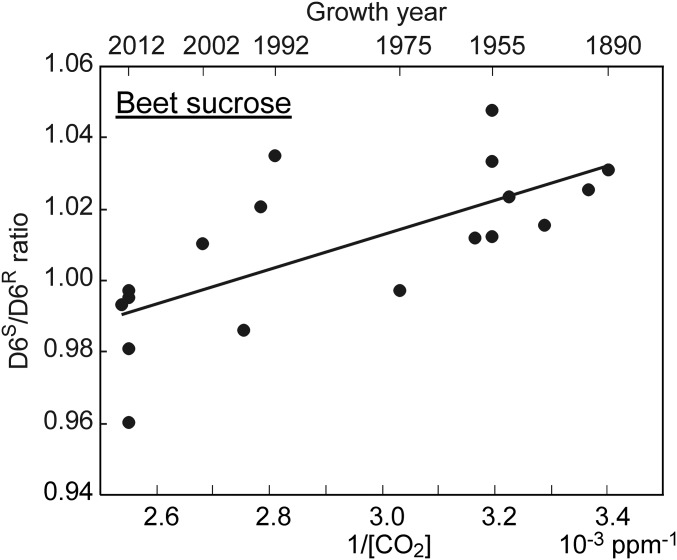
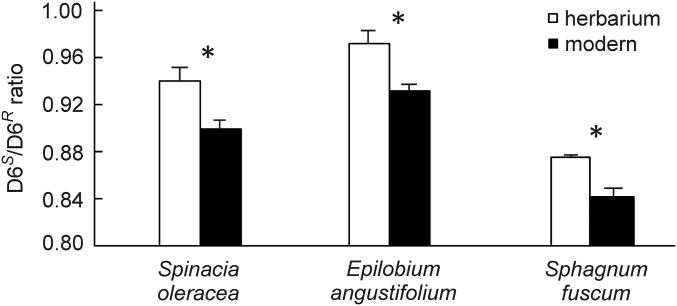
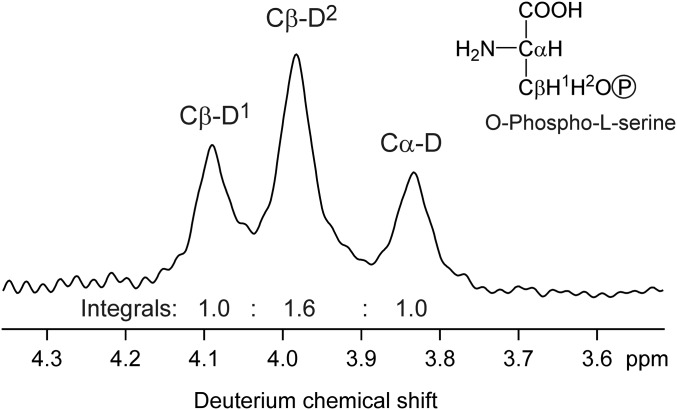
Terrestrial vegetation currently absorbs approximately a third of anthropogenic CO2 emissions, mitigating the rise of atmospheric CO2. However, terrestrial net primary production is highly sensitive to atmospheric CO2 levels and associated climatic changes. In C3 plants, which dominate terrestrial vegetation, net photosynthesis depends on the ratio between photorespiration and gross photosynthesis. This metabolic flux ratio depends strongly on CO2 levels, but changes in this ratio over the past CO2 rise have not been analyzed experimentally. Combining CO2 manipulation experiments and deuterium NMR, we first establish that the intramolecular deuterium distribution (deuterium isotopomers) of photosynthetic C3 glucose contains a signal of the photorespiration/photosynthesis ratio. By tracing this isotopomer signal in herbarium samples of natural C3 vascular plant species, crops, and a Sphagnum moss species, we detect a consistent reduction in the photorespiration/photosynthesis ratio in response to the ∼100-ppm CO2 increase between ∼1900 and 2013. No difference was detected in the isotopomer trends between beet sugar samples covering the 20th century and CO2 manipulation experiments, suggesting that photosynthetic metabolism in sugar beet has not acclimated to increasing CO2 over >100 y. This provides observational evidence that the reduction of the photorespiration/photosynthesis ratio was ca. 25%. The Sphagnum results are consistent with the observed positive correlations between peat accumulation rates and photosynthetic rates over the Northern Hemisphere. Our results establish that isotopomers of plant archives contain metabolic information covering centuries. Our data provide direct quantitative information on the "CO2 fertilization" effect over decades, thus addressing a major uncertainty in Earth system models.

Keywords: CO2 fertilization; acclimation; atmospheric change; deuterium; isotopomer.


Conflict of interest statement

The authors declare no conflict of interest.

Figures

Fig. 1.
Fig. 1.
Overview of metabolic pathways emanating from RubP by Rubisco activity. Upon carboxylation, 3-phosphoglycerate (3-PGA) molecules are formed from C1−C2 and C3−C5 of RuBP. Upon oxygenation, one 3-PGA molecule is formed from C3−C5 of RubP, and up to one-half 3-PGA is formed via the photorespiration pathway through the peroxisome and mitochondrion. The color coding of hydrogen atoms tracks the biochemical origins of hydrogens at C3 of 3-PGA, which give rise to the isotopomer signal encoded in the colored C6H2 group of glucose.
Fig. 2.
Fig. 2.
Effect of [CO2] on the D6S/D6R isotopomer ratio of photosynthetically generated glucose moieties in sunflower (H. annuus). (A) Deuterium NMR spectrum of a glucose derivative displaying one signal for each of the seven isotopomers of glucose. The signals’ integrals are proportional to the isotopomer abundances. (B) Excerpts of deuterium NMR spectra of glucose prepared from sunflower leaf starch, showing signals arising from the D6S and D6R isotopomers of the C6H2 group of glucose. The solid and dashed spectra were acquired from glucose formed at 280 ppm and 1,500 ppm CO2, respectively. The dashed spectrum has been shifted sideways to ease comparison. (C) Dependence of the D6S/D6R ratio of glucose from sunflower leaf starch on 1/[CO2] (in units of 10−3 ppm−1) during growth [r2 = 0.88, slope 0.057 ±0.006 (SEM), P < 10−7, n = 17, individual plants except for 180 and 280 ppm, where material from two to four plants had to be pooled for each sample].
Fig. S1.
Fig. S1.
The D6S/D6R isotopomer ratio as a function of ϕ (the oxygenation to carboxylation ratio). Glucose derivative was prepared from structural carbohydrates of sunflower leaves; input data are given in Table S1. The red curve shows a root-least-squares fit of the data to Eq. S1, and the black line shows a linear fit of the data.
Fig. 3.
Fig. 3.
Response of the D6S/D6R ratio of different species and metabolites to manipulation of the [CO2]/[O2] ratio. (A) [CO2] manipulation; white bars represent low and black bars represent high [CO2] of 360 ppm and 700 ppm, respectively, except for sunflower (200 ppm and 1,000 ppm). (B) O2 manipulation; white bar represents ambient atmosphere, and gray bar represents ambient [CO2] with reduced [O2] (12%); glucose from soluble sugars was analyzed. Values are averages ± SEM (n = 2–5), except for one single sample pooled from several plants. *P < 0.05; **P < 0.01; ***P < 0.001 (ANOVA).
Fig. 4.
Fig. 4.
Isotopomer response to changes in [CO2] in archived samples of beet sugar. D6S/D6R ratios of the glucose moiety of beet sucrose samples as a function of 1/[CO2] (in units of 10−3 ppm−1) during the year of growth, shown on the upper x axis (r2 = 0.49, P = 0.001, n = 18).
Fig. 5.
Fig. 5.
Isotopomer response comparing herbarium and modern samples. D6S/D6R ratios of structural carbohydrates of herbarium samples (open bars) and modern samples (black bars). Modern samples grew between 2011 and 2014, herbarium spinach samples grew between 1892 and 1908 ([CO2] ∼295 ppm), herbarium Epilobium samples grew between 1943 and 1954 ([CO2] ∼310 ppm), and herbarium Sphagnum samples grew between 1888 and 1923 ([CO2] ∼295 ppm). Values are averages ± SEM (n = 3–6); *P < 0.02.
Fig. S2.
Fig. S2.
Deuterium NMR spectrum of O-Phospho-l-serine (Santa Cruz Biotechnolgy), indicating D isotopomer abundances of serine formed by serine hydroxymethyl transferase during fermentation (33). The integrals of the signals, obtained by deconvolution, are proportional to the abundances of the Cα-D isotopomer and the two D isotopomers at Cβ, labeled Cβ-D1 and Cβ-D2. Although the stereochemical assignments of Cβ-D1 and Cβ-D2 are unknown, their strongly differing integrals show that serine hydroxymethyl transferase creates a strongly uneven D isotopomer ratio at C3 of serine, which, in the photorespiration pathway, is converted into an uneven D isotopomer ratio at C3 of 3-phosphoglycerate.

References

    1. Intergovernmental Panel on Climate Change . In: Climate Change 2013: The Physical Science Basis. Contribution of Working Group I to the Fifth Assessment Report of the Intergovernmental Panel on Climate Change. Stocker TF, et al., editors. Cambridge Univ Press; Cambridge, UK: 2013.
    1. Leuzinger S, et al. Do global change experiments overestimate impacts on terrestrial ecosystems? Trends Ecol Evol. 2011;26(5):236–241. - PubMed
    1. Drake JE, et al. Increases in the flux of carbon belowground stimulate nitrogen uptake and sustain the long-term enhancement of forest productivity under elevated CO2. Ecol Lett. 2011;14(4):349–357. - PubMed
    1. Jump AS, Hunt JM, Martínez-Izquierdo JA, Peñuelas J. Natural selection and climate change: Temperature-linked spatial and temporal trends in gene frequency in Fagus sylvatica. Mol Ecol. 2006;15(11):3469–3480. - PubMed
    1. Hetherington AM, Woodward FI. The role of stomata in sensing and driving environmental change. Nature. 2003;424(6951):901–908. - PubMed

Publication types

LinkOut - more resources