. 2015 Nov 30;4(6):5.
doi: 10.1167/tvst.4.6.5. eCollection 2015 Nov.

Computer-Based Image Analysis for Plus Disease Diagnosis in Retinopathy of Prematurity: Performance of the "i-ROP" System and Image Features Associated With Expert Diagnosis

Affiliations

Computer-Based Image Analysis for Plus Disease Diagnosis in Retinopathy of Prematurity: Performance of the "i-ROP" System and Image Features Associated With Expert Diagnosis

Esra Ataer-Cansizoglu et al. Transl Vis Sci Technol. .

Abstract

Purpose: We developed and evaluated the performance of a novel computer-based image analysis system for grading plus disease in retinopathy of prematurity (ROP), and identified the image features, shapes, and sizes that best correlate with expert diagnosis.

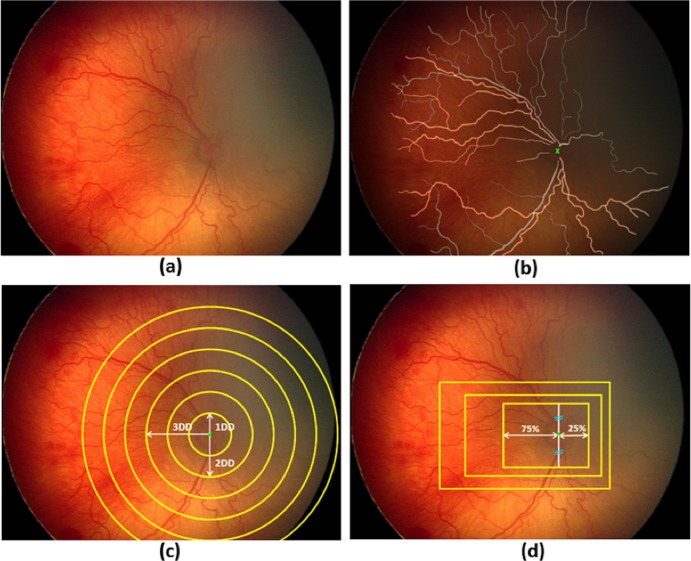
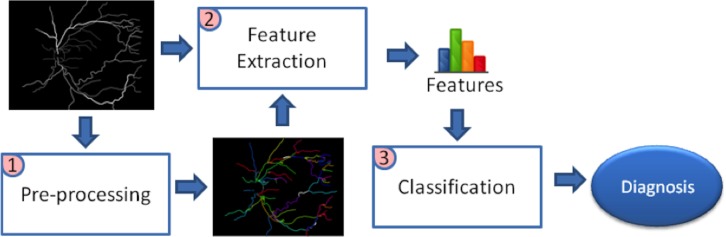
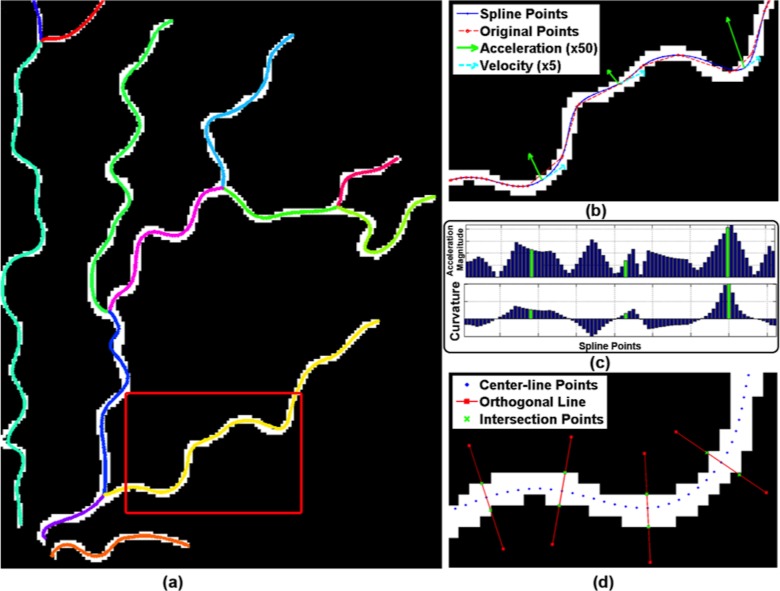
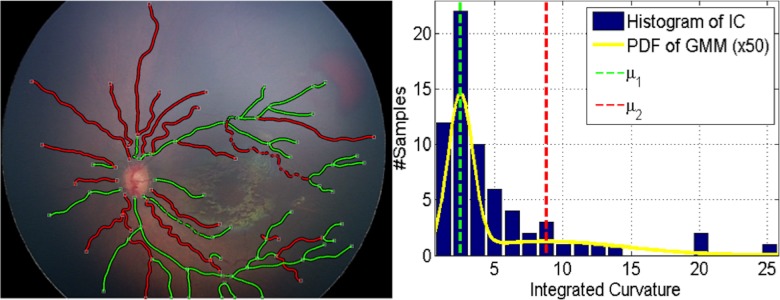
Methods: A dataset of 77 wide-angle retinal images from infants screened for ROP was collected. A reference standard diagnosis was determined for each image by combining image grading from 3 experts with the clinical diagnosis from ophthalmoscopic examination. Manually segmented images were cropped into a range of shapes and sizes, and a computer algorithm was developed to extract tortuosity and dilation features from arteries and veins. Each feature was fed into our system to identify the set of characteristics that yielded the highest-performing system compared to the reference standard, which we refer to as the "i-ROP" system.

Results: Among the tested crop shapes, sizes, and measured features, point-based measurements of arterial and venous tortuosity (combined), and a large circular cropped image (with radius 6 times the disc diameter), provided the highest diagnostic accuracy. The i-ROP system achieved 95% accuracy for classifying preplus and plus disease compared to the reference standard. This was comparable to the performance of the 3 individual experts (96%, 94%, 92%), and significantly higher than the mean performance of 31 nonexperts (81%).

Conclusions: This comprehensive analysis of computer-based plus disease suggests that it may be feasible to develop a fully-automated system based on wide-angle retinal images that performs comparably to expert graders at three-level plus disease discrimination.

Translational relevance: Computer-based image analysis, using objective and quantitative retinal vascular features, has potential to complement clinical ROP diagnosis by ophthalmologists.

Keywords: computer-based image analysis; machine learning; retinopathy of prematurity.


Figures

Figure 1
Figure 1
Illustration of manual mask generation and cropping processes: (a) original retinal image, (b) mask for manually segmented arteries (yellow) and veins (gray) overlaid on the original image. Optic disc (OD) center is marked with a green “x”, (c) generation of circular crops where each circle is centered at the OD center with diameters ranging from 1 to 6 disc diameters (DD), and (d) generation of rectangular crops maintaining an aspect ratio of 3 × 4 DD. Rectangles were drawn to capture more temporal (75%) than nasal (25%) vessels. Superior and inferior vessels were captured equally.
Figure 2
Figure 2
Computer-based image analysis system overview. The masks generated by manual segmentation were preprocessed to find the centerlines and construct the vascular tree. The tree and the manual mask then were fed into the feature extraction module, which outputs segment-based and point-based features quantifying vascular tortuosity and dilation. Given these features, a classification system was built to identify each image as plus, preplus, or normal.
Figure 3
Figure 3
Preprocessing and feature extraction: (a) the resulting vasculature tree after preprocessing is overlaid on manual segmentation. Centerlines of each vessel segment are smoothed by cubic splines and displayed with different colors. (b) Original center-line points (red) and spline fitted points (blue) are displayed for part of an example vessel segment shown in red rectangle in (a). Velocity and acceleration vectors also are displayed in green and cyan, respectively, for some example points. Note that as tortuosity increases, the magnitude of acceleration vector increases. (c) Bar plot of acceleration magnitude and curvature values computed for the points displayed in (b). The points where green acceleration vectors are displayed in (b) are shown with corresponding green bars in the graph. (d) Diameter for a center-line point is computed by drawing an orthogonal line (red lines) and finding its intersection (green crosses) with the vessel boundary. This is illustrated for some sample points.
Figure 4
Figure 4
Clustering of vessel segments based on the GMM on integrated curvature (IC) feature for an example image. In the left, white squares indicate the junction/end points of vessels. Each segment is shown with its corresponding cluster color. Right figure displays the histogram of the IC feature for that image, along with the GMM. The yellow line indicates the probability density function (PDF) of all the segments. The mean of each mixture component is shown with dashed lines with its respective color.
Figure 5
Figure 5
Results of nonlinear dimensionality reduction by applying MDS on GMM-based distance (top) and regular statistics (minimum, maximum, mean) of the acceleration feature. Left shows the 1-D MDS coordinates and the minimum, maximum, and mean of acceleration respectively. Right shows the rank of image when it is ordered based on corresponding MDS coordinate or acceleration statistic.

References

    1. Gilbert C,, Foster A. Childhood blindness in the context of VISION 2020: the right to sight. Bull World Health Organ. 2001; 79: 227–232. - PMC - PubMed
    1. The Committee for the Classification of Retinopathy of Prematurity. An international classification of retinopathy of prematurity. Arch Ophthalmol. 1984; 102: 1130–1134. - PubMed
    1. The Committee for the Classification of Retinopathy of Prematurity. The international classification of retinopathy of prematurity revisited. Arch Ophthalmol. 2005; 123: 991–999. - PubMed
    1. Chiang MF,, Jiang L,, Gelman R,, Du Y. Inter expert agreement of plus disease diagnosis in retinopathy of prematurity. Arch Ophthalmol. 2007; 125: 875–880. - PubMed
    1. Wallace D,, Quinn G,, Freedman S,, Chiang MF. Agreement among pediatric ophthalmologists in diagnosing plus and pre-plus disease in retinopathy of prematurity. J AAPOS. 2008; 12: 352–356. - PMC - PubMed

LinkOut - more resources