

Impact of Age, Race and Socio-economic Status on Temporal Trends in Late-Stage Prostate Cancer Diagnosis in Florida
- PMID: 26644992
- PMCID: PMC4669574
- DOI: 10.1016/j.spasta.2015.07.002
Impact of Age, Race and Socio-economic Status on Temporal Trends in Late-Stage Prostate Cancer Diagnosis in Florida
Abstract
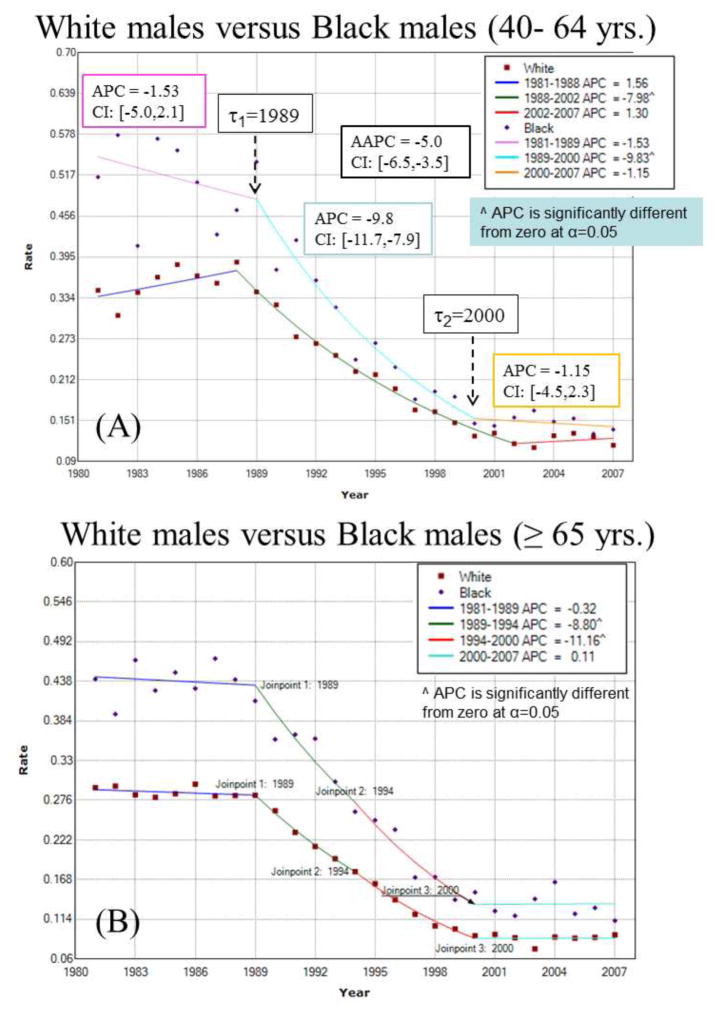
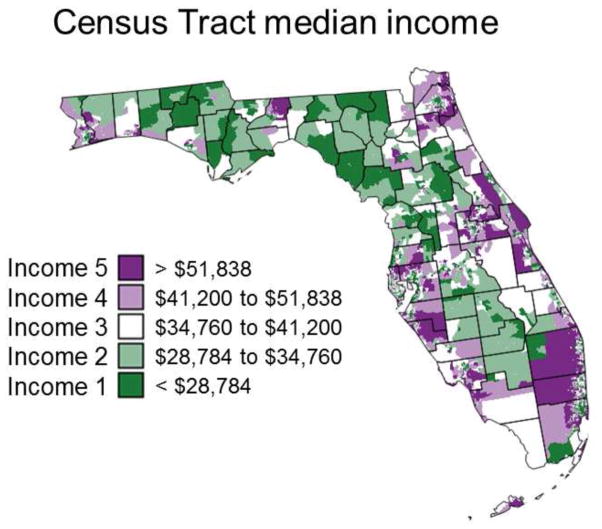
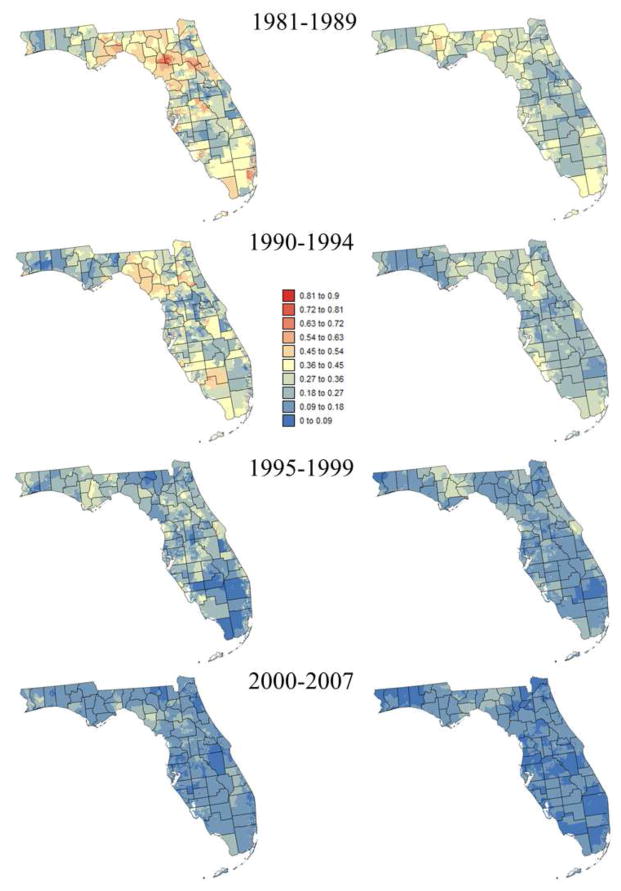
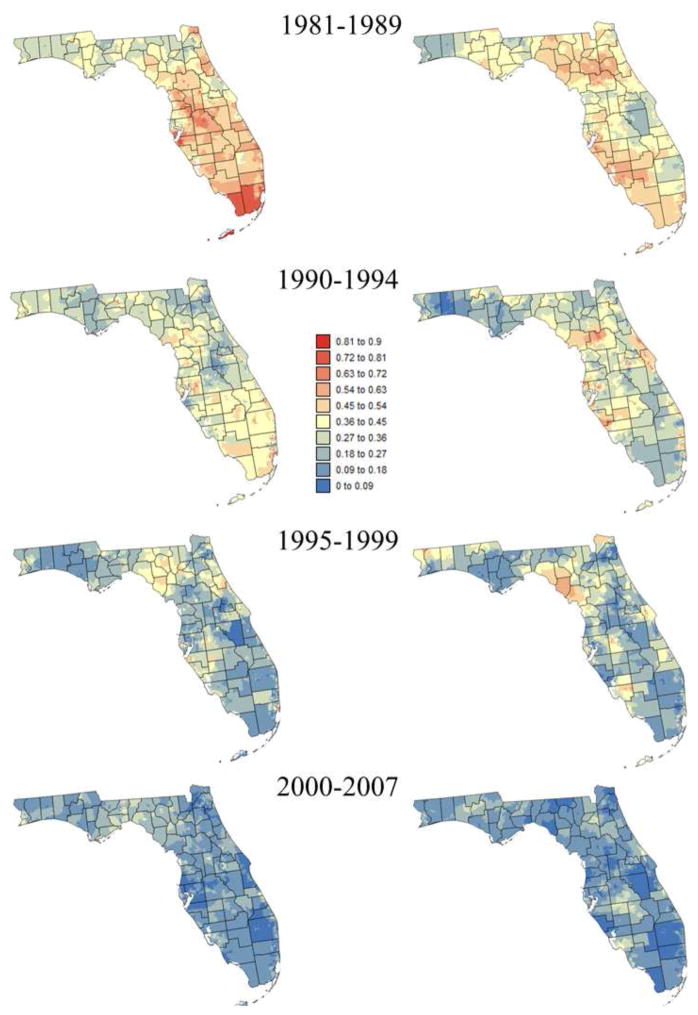
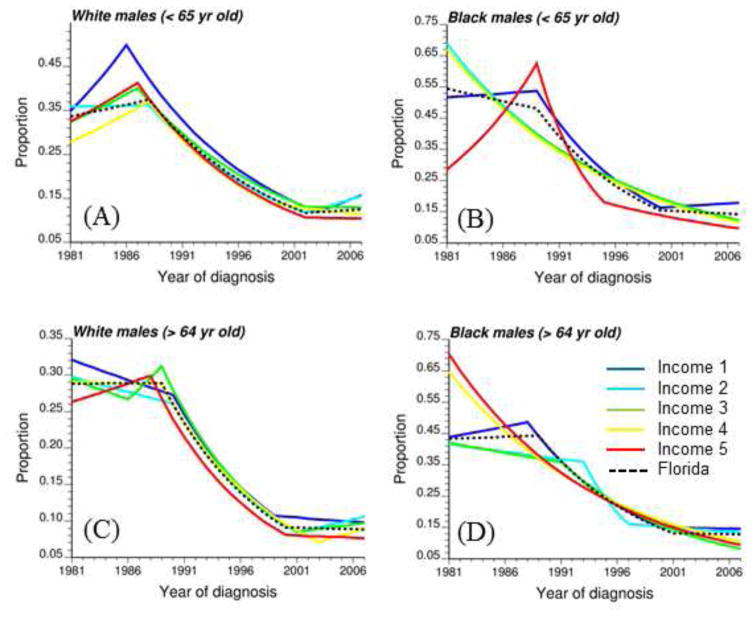
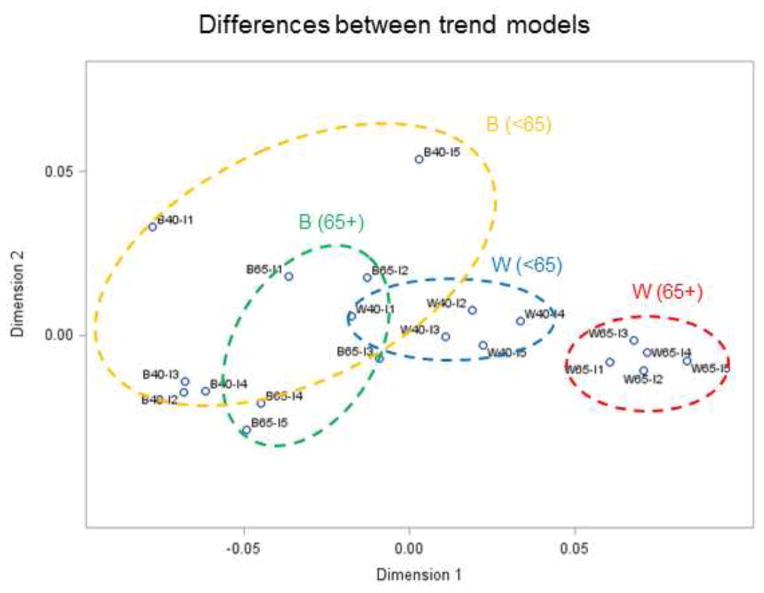
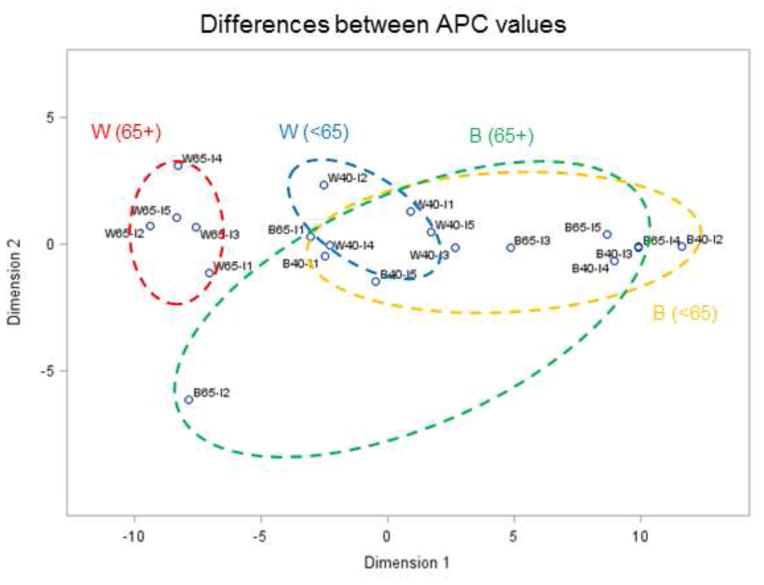
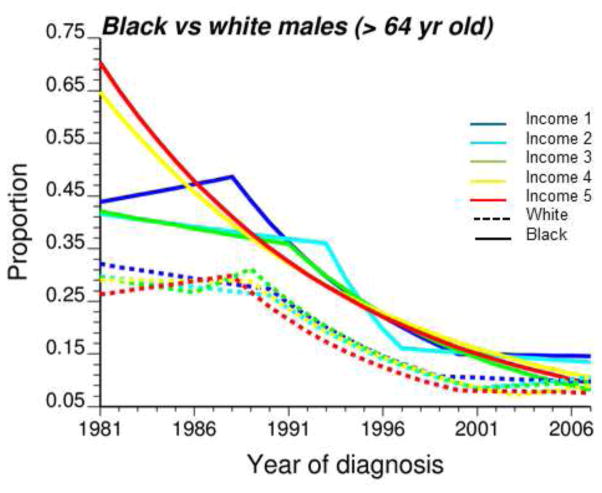
Individual-level data from the Florida Cancer Data System (1981-2007) were analysed to explore temporal trends of prostate cancer late-stage diagnosis, and how they vary based on race, income and age. Annual census-tract rates were computed for two races (white and black) and two age categories (40-65, >65) before being aggregated according to census tract median household incomes. Joinpoint regression and a new disparity statistic were applied to model temporal trends and detect potential racial and socio-economic differences. Multi-dimensional scaling was used as an innovative way to visualize similarities among temporal trends in a 2-D space. Analysis of time-series indicated that late-stage diagnosis was generally more prevalent among blacks, for age category 40-64 compared to older patients covered by Medicare, and among classes of lower socio-economic status. Joinpoint regression also showed that the rate of decline in late-stage diagnosis was similar among older patients. For younger patients, the decline occurred at a faster pace for blacks with rates becoming similar to whites in the late 90s, in particular for higher incomes. Both races displayed distinct spatial patterns with higher rates of late-stage diagnosis in the Florida Panhandle for whites whereas high rates clustered in South-eastern Florida for blacks.
Keywords: PSA screening; census tracts; disparities; joinpoint regression; socio-economic status.
Figures
Similar articles
-
Geographical, temporal and racial disparities in late-stage prostate cancer incidence across Florida: a multiscale joinpoint regression analysis.Int J Health Geogr. 2011 Dec 5;10:63. doi: 10.1186/1476-072X-10-63. Int J Health Geogr. 2011. PMID: 22142274 Free PMC article.
-
Analysis of geographical disparities in temporal trends of health outcomes using space-time joinpoint regression.Int J Appl Earth Obs Geoinf. 2013 Jun;22:75-85. doi: 10.1016/j.jag.2012.03.002. Int J Appl Earth Obs Geoinf. 2013. PMID: 23710162 Free PMC article.
-
Disparities Between Blacks and Whites in Stage at Diagnosis, Incidence, and Anatomic Subsite of Colorectal Cancer.Gastroenterol Hepatol (N Y). 2006 Jul;2(7):498-502. Gastroenterol Hepatol (N Y). 2006. PMID: 28289352 Free PMC article.
-
The impact of place and time on the proportion of late-stage diagnosis: the case of prostate cancer in Florida, 1981-2007.Spat Spatiotemporal Epidemiol. 2012 Sep;3(3):243-53. doi: 10.1016/j.sste.2012.03.001. Epub 2012 Mar 13. Spat Spatiotemporal Epidemiol. 2012. PMID: 22749210 Free PMC article.
-
Race/ethnic disparity in hypertension-related hospitalization in Florida.Ethn Dis. 2007 Summer;17(3):453-60. Ethn Dis. 2007. PMID: 17985497
Cited by
-
Clinical value of long noncoding RNA ZEB1 anti-sense1 in cancer patients: A meta-analysis.Medicine (Baltimore). 2020 Jul 31;99(31):e21307. doi: 10.1097/MD.0000000000021307. Medicine (Baltimore). 2020. PMID: 32756112 Free PMC article.
-
Geographical Variations in Prostate Cancer Outcomes: A Systematic Review of International Evidence.Front Oncol. 2019 Apr 8;9:238. doi: 10.3389/fonc.2019.00238. eCollection 2019. Front Oncol. 2019. PMID: 31024842 Free PMC article.
-
Racial disparities and considerations for active surveillance of prostate cancer.Transl Androl Urol. 2018 Apr;7(2):214-220. doi: 10.21037/tau.2017.09.11. Transl Androl Urol. 2018. PMID: 29732279 Free PMC article. Review.
-
Racial/ethnic disparities in de novo metastases sites and survival outcomes for patients with primary breast, colorectal, and prostate cancer.Cancer Med. 2018 Apr;7(4):1183-1193. doi: 10.1002/cam4.1322. Epub 2018 Feb 26. Cancer Med. 2018. PMID: 29479835 Free PMC article.
-
Application of Socio-Economic and Health Deprivation Indices to study the relationships between socio-economic status and disease onset and outcome in a metropolitan area subjected to aging, demographic fall and socio-economic crisis.J Prev Med Hyg. 2021 Sep 15;62(3):E718-E727. doi: 10.15167/2421-4248/jpmh2021.62.3.1890. eCollection 2021 Sep. J Prev Med Hyg. 2021. PMID: 34909500 Free PMC article.
References
-
- Barratt AL, Stockler MR. Screening for prostate cancer: Explaining new trial results and their implications to patients. Med J Aust. 2009;191(4):226–229. - PubMed
-
- Bernard J, Wilhelm N, Scherer M, May T, Schreck T. Time Series Paths: Projection-based explorative analysis of multivarate time series data. Journal of WSCG. 2012;20(2):97–106.
-
- BioMedware I. SpaceStat user manual version 4.1 2013
Grants and funding
LinkOut - more resources
Full Text Sources
Other Literature Sources
Research Materials
Miscellaneous