. 2015 Sep 23;1(3):210-223.
doi: 10.1016/j.cels.2015.08.015.

Optimizing cancer genome sequencing and analysis

Affiliations

Optimizing cancer genome sequencing and analysis

Malachi Griffith et al. Cell Syst. .

Abstract

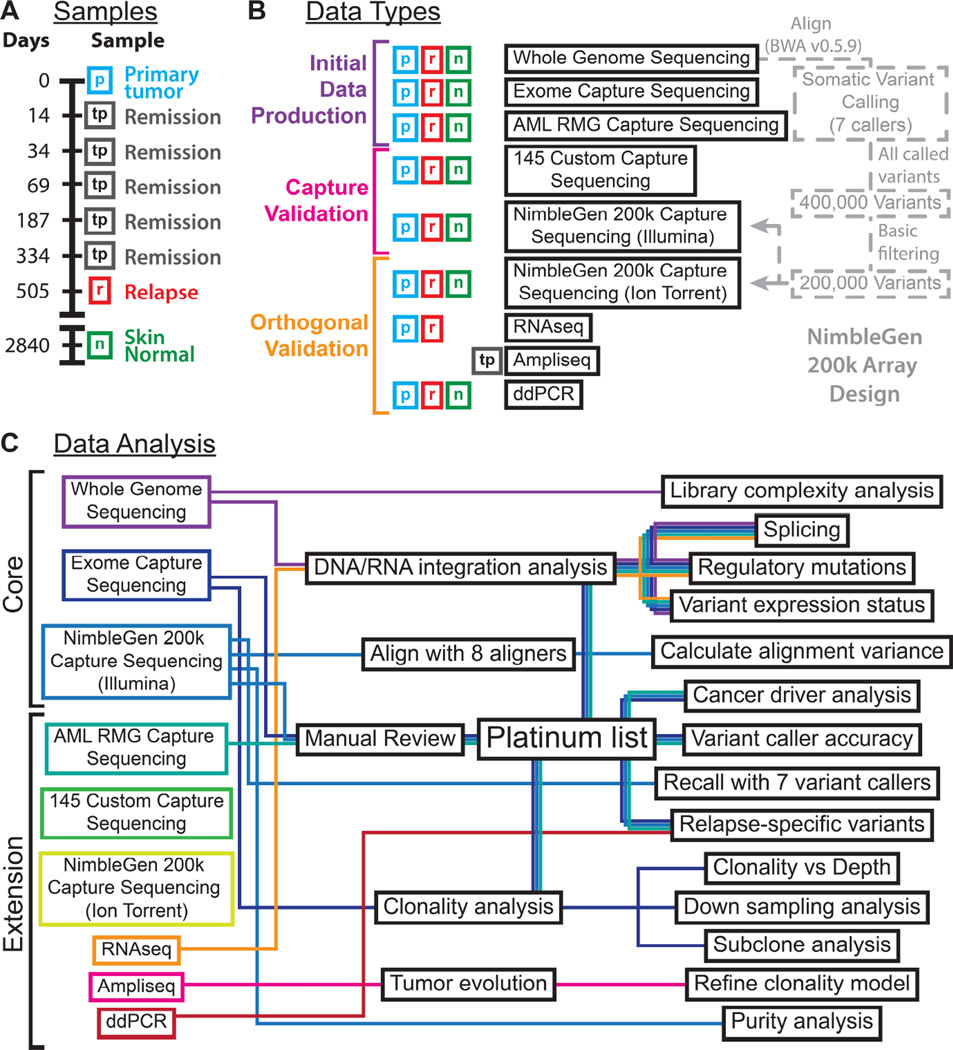
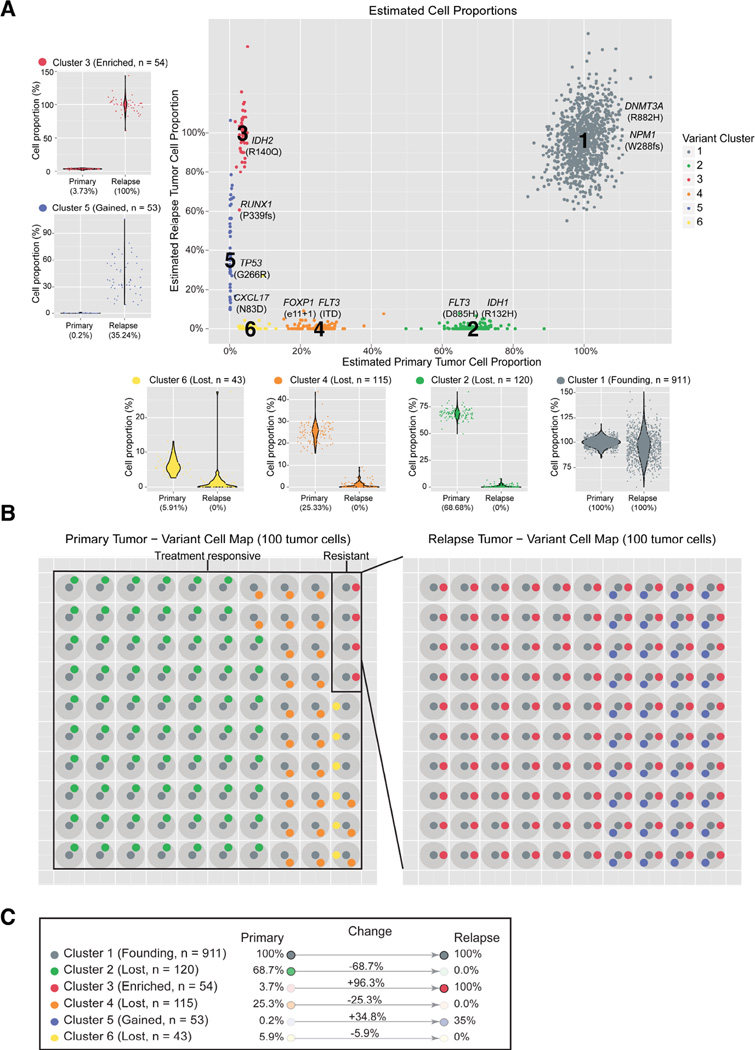
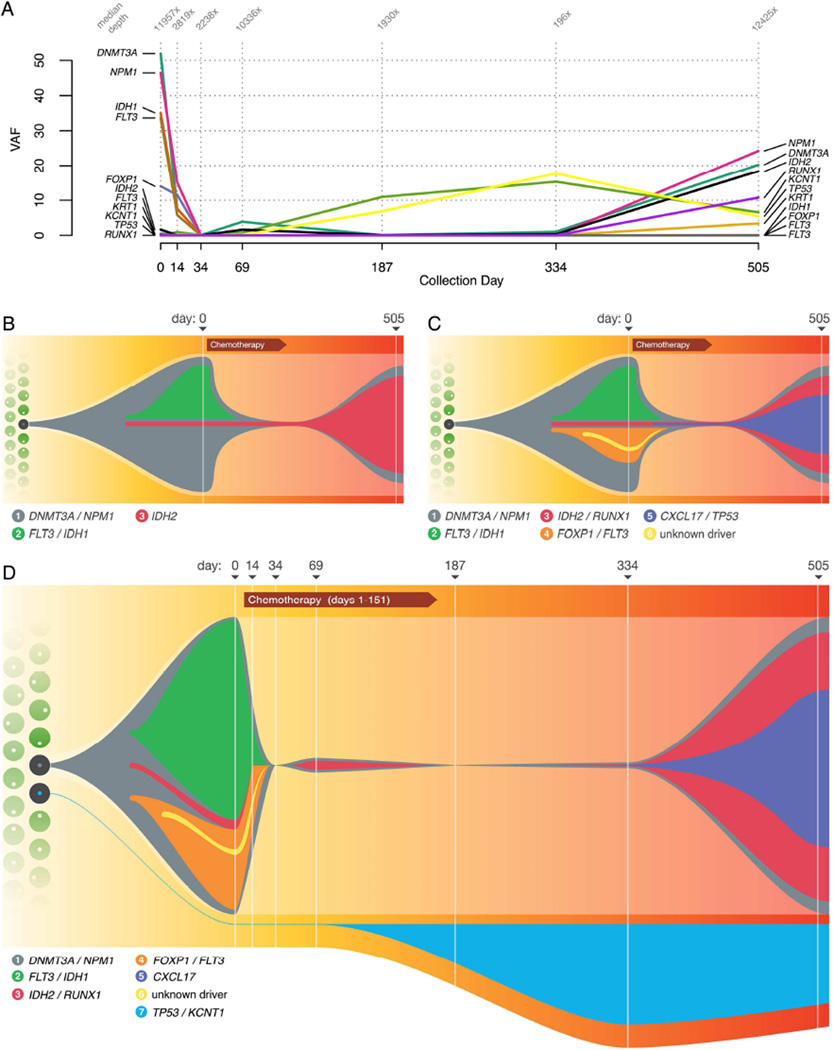
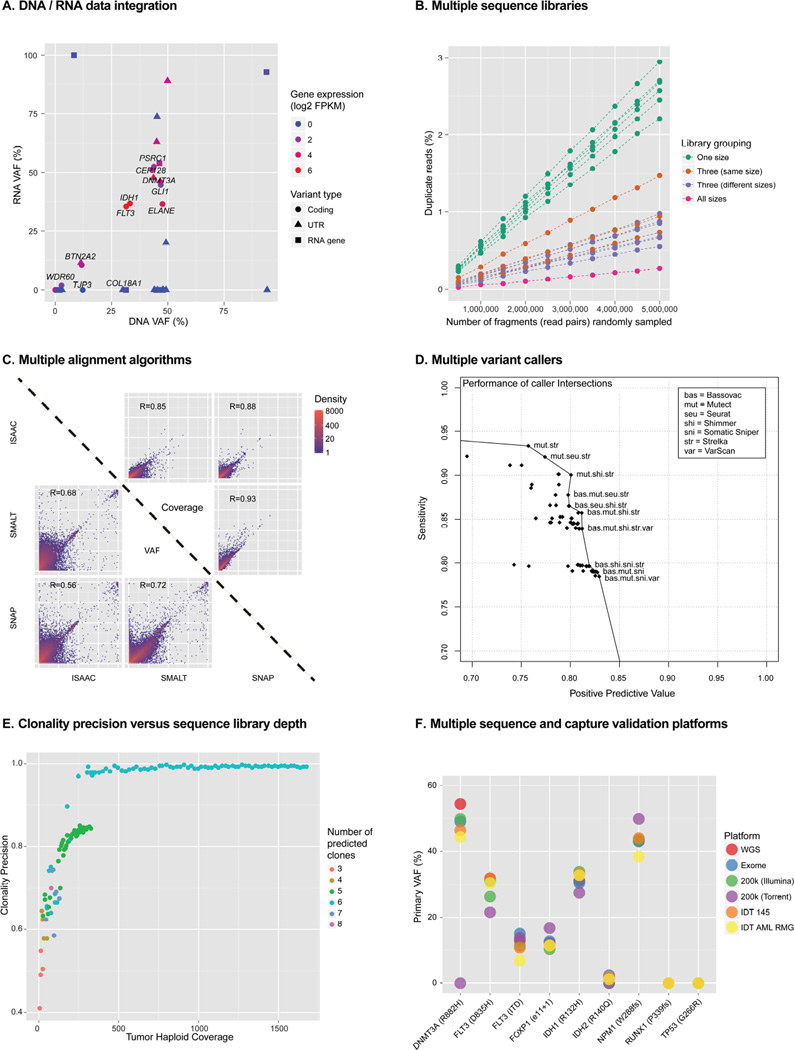
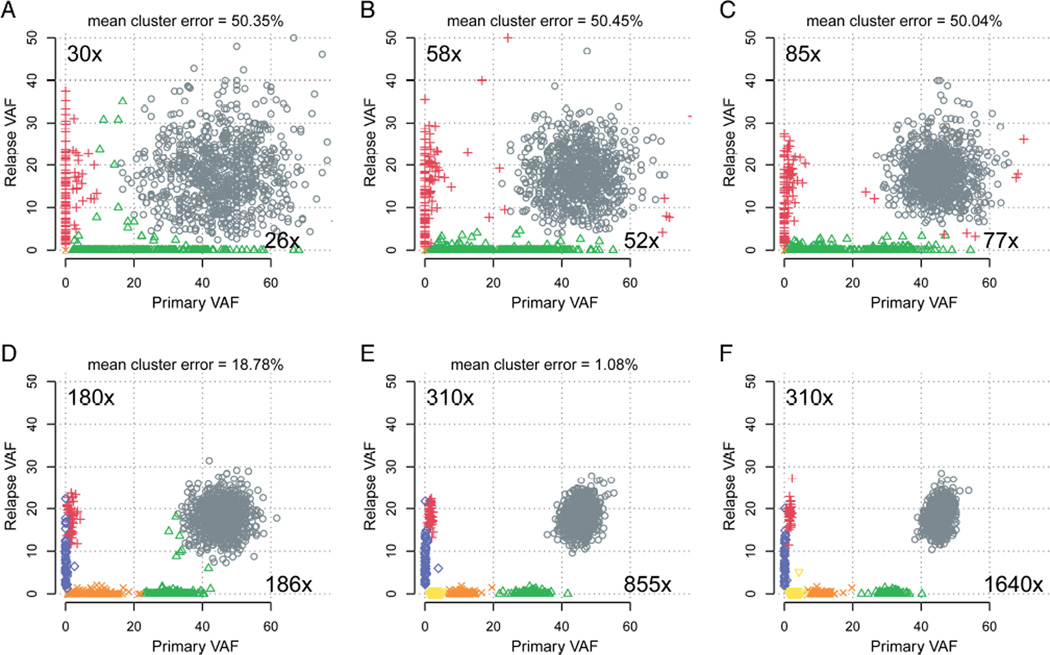
Tumors are typically sequenced to depths of 75-100× (exome) or 30-50× (whole genome). We demonstrate that current sequencing paradigms are inadequate for tumors that are impure, aneuploid or clonally heterogeneous. To reassess optimal sequencing strategies, we performed ultra-deep (up to ~312×) whole genome sequencing (WGS) and exome capture (up to ~433×) of a primary acute myeloid leukemia, its subsequent relapse, and a matched normal skin sample. We tested multiple alignment and variant calling algorithms and validated ~200,000 putative SNVs by sequencing them to depths of ~1,000×. Additional targeted sequencing provided over 10,000× coverage and ddPCR assays provided up to ~250,000× sampling of selected sites. We evaluated the effects of different library generation approaches, depth of sequencing, and analysis strategies on the ability to effectively characterize a complex tumor. This dataset, representing the most comprehensively sequenced tumor described to date, will serve as an invaluable community resource (dbGaP accession id phs000159).


Figures

Figure 1
Figure 1. Experimental overview
A) Samples from this study are depicted along a timeline with day 0 representing the day of AML diagnosis. B) Data types generated for each sample are indicated along with a basic summary of their dependencies. C) A depiction of the analysis strategies employed, their outputs and the datasets they rely on are depicted as a schematic ‘subway map’. Refer to Supplemental Experimental Procedures for additional methods and results associated with each.
Figure 2
Figure 2. Cancer driver variants and their clonal identities in primary and relapse
A) VAFs derived from the core dataset for all platinum variants are plotted for primary and relapse with colors assigned to variant clusters identified by SciClone. Each subpanel shows the change in VAF distributions for a single cluster from primary to relapse. Key AML-related variants are highlighted. B) A model of clonal heterogeneity within a theoretical 100 primary and relapse cells. C) Summary statistics and classification of each cluster with respect to clonal evolution.
Figure 3
Figure 3. Tracking tumor evolution and refining a model of clonal architecture
A) Variant allele frequency (VAF) of key mutations, at diagnosis (day 0), during progression through treatment, and at relapse (day 505). The median depth of coverage obtained at each variant position for each timepoint is indicated at top. Samples for intermediate timepoints between day 0 and 505 were obtained from FFPE blocks and in some cases were heavily degraded, leading to lower yields and sequence depth for some timepoints. B) Model of clonal architecture and tumor evolution, inferred from the original ~30× sequencing data. C) Ultra-deep sequencing and validation revealed additional subclonal complexity. D) Incorporating the results of single-cell sequencing and intermediate timepoints allows for refinements to the model, including establishing an independent origin for the TP53-mutant clonal population. Numbers in legend refer to cluster assignments. The ‘Chemotherapy’ label includes induction chemotherapy (day 1), and four rounds of consolidation chemotherapy at days 47, 81, 116, and 151.
Figure 4
Figure 4. Selected findings from comprehensive data analyses
A) Correlation of DNA and RNA VAFs for variants within exons. B) The effect of using multiple sequence libraries on library complexity. C) Representative comparisons of the effect of alignment algorithm on variant allele frequency estimation. D) The performance of variant callers when used in all possible combinations (intersections). E) The effect of increasing depth on the accuracy of clonal inference. F) Comparison of VAF estimation across six sequence platforms/datasets. Refer to the Supplemental Experimental Procedures and Supplemental Results for more details of each of these analyses.
Figure 5
Figure 5. The effect of coverage depth on subclonal inference
Clustering was performed using read counts from downsampled sequence data at all platinum SNVs. Panels A-E show the results of lower coverage, while panel F uses the ‘core’ validation data. For each cluster in the ‘truth set’ (panel F), the percentage of that cluster’s points correctly assigned was calculated. One minus the mean of these values gives the mean cluster error. An animated version of these plots with additional coverage levels is available as Video S1.

References

    1. Ajay SS, Parker SC, Abaan HO, Fajardo KV, Margulies EH. Accurate and comprehensive sequencing of personal genomes. Genome Res. 2011;21:1498–1505. - PMC - PubMed
    1. Biankin AV, Waddell N, Kassahn KS, Gingras MC, Muthuswamy LB, Johns AL, Miller DK, Wilson PJ, Patch AM, Wu J, et al. Pancreatic cancer genomes reveal aberrations in axon guidance pathway genes. Nature. 2012;491:399–405. - PMC - PubMed
    1. Borad MJ, Champion MD, Egan JB, Liang WS, Fonseca R, Bryce AH, McCullough AE, Barrett MT, Hunt K, Patel MD, et al. Integrated genomic characterization reveals novel, therapeutically relevant drug targets in FGFR and EGFR pathways in sporadic intrahepatic cholangiocarcinoma. PLoS Genet. 2014;10:e1004135. - PMC - PubMed
    1. Boutros PC, Ewing AD, Ellrott K, Norman TC, Dang KK, Hu Y, Kellen MR, Suver C, Bare JC, Stein LD, et al. Global optimization of somatic variant identification in cancer genomes with a global community challenge. Nat Genet. 2014;46:318–319. - PMC - PubMed
    1. Brodin J, Mild M, Hedskog C, Sherwood E, Leitner T, Andersson B, Albert J. PCR-induced transitions are the major source of error in cleaned ultra-deep pyrosequencing data. PLoS One. 2013;8:e70388. - PMC - PubMed