Hydrologic Alterations from Climate Change Inform Assessment of Ecological Risk to Pacific Salmon in Bristol Bay, Alaska
- PMID: 26645380
- PMCID: PMC4672932
- DOI: 10.1371/journal.pone.0143905
Hydrologic Alterations from Climate Change Inform Assessment of Ecological Risk to Pacific Salmon in Bristol Bay, Alaska
Erratum in
-
Correction: Hydrologic Alterations from Climate Change Inform Assessment of Ecological Risk to Pacific Salmon in Bristol Bay, Alaska.PLoS One. 2016 Jan 13;11(1):e0147242. doi: 10.1371/journal.pone.0147242. eCollection 2016. PLoS One. 2016. PMID: 26761202 Free PMC article. No abstract available.
Abstract
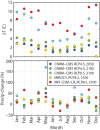
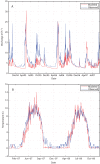
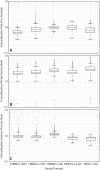
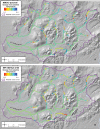
We developed an integrated hydrologic model of the upper Nushagak and Kvichak watersheds in the Bristol Bay region of southwestern Alaska, a region under substantial development pressure from large-scale copper mining. We incorporated climate change scenarios into this model to evaluate how hydrologic regimes and stream temperatures might change in a future climate, and to summarize indicators of hydrologic alteration that are relevant to salmon habitat ecology and life history. Model simulations project substantial changes in mean winter flow, peak flow dates, and water temperature by 2100. In particular, we find that annual hydrographs will no longer be dominated by a single spring thaw event, but will instead be characterized by numerous high flow events throughout the winter. Stream temperatures increase in all future scenarios, although these temperature increases are moderated relative to air temperatures by cool baseflow inputs during the summer months. Projected changes to flow and stream temperature could influence salmon through alterations in the suitability of spawning gravels, changes in the duration of incubation, increased growth during juvenile stages, and increased exposure to chronic and acute temperature stress. These climate-modulated changes represent a shifting baseline in salmon habitat quality and quantity in the future, and an important consideration to adequately assess the types and magnitude of risks associated with proposed large-scale mining in the region.
Conflict of interest statement
Figures






References
-
- Ruggerone GT, Peterman RM, Dorner B, Myers KW. Magnitude and trends in abundance of hatchery and wild pink salmon, chum salmon, and sockeye salmon in the north Pacific Ocean. Mar Coast Fish. 2010;2:306–328.
-
- Ghaffari H, Morrison RS, de Ruijter MA, Zivkovic A, Hantelmann T, Ramsey D, et al. Preliminary Assessment of the Pebble Project, Southwest Alaska. Prepared for Northern Dynasty Minerals Ltd. by WARDROP. Document # 1056140100-REP-R0001-00. February 17, 2011. Available: http://www.northerndynastyminerals.com/i/pdf/ndm/Pebble_Project_Prelimin....
-
- U.S.EPA. An Assessment of Potential Mining Impacts on Salmon Ecosystems of Bristol Bay, Alaska (Final Report). U.S. Environmental Protection Agency, Washington, DC: January 2014.
-
- Wobus C, Maest A, Prucha B, Albert D. Potential Hydrologic and Water Quality Alteration from Large-Scale Mining of the Pebble Deposit in Bristol Bay, Alaska: Results from an Integrated Hydrologic Model of a Preliminary Mine Design. Review Draft. Prepared for The Nature Conservancy, Anchorage, AK. 2012. Available: http://ofmpub.epa.gov/eims/eimscomm.getfile?p_download_id=513585.
Publication types
MeSH terms
LinkOut - more resources
Full Text Sources
Other Literature Sources
Medical

