. 2015 Dec 8:4:e12088.
doi: 10.7554/eLife.12088.

Mechanical sensitivity of Piezo1 ion channels can be tuned by cellular membrane tension

Affiliations

Mechanical sensitivity of Piezo1 ion channels can be tuned by cellular membrane tension

Amanda H Lewis et al. Elife. .

Abstract

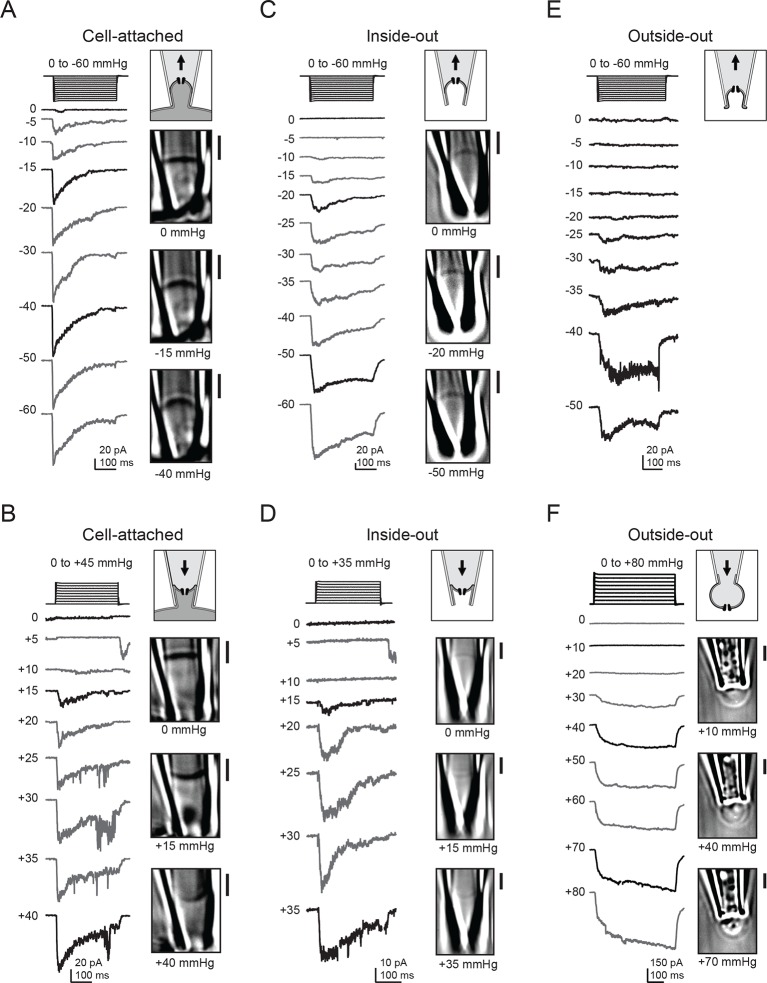
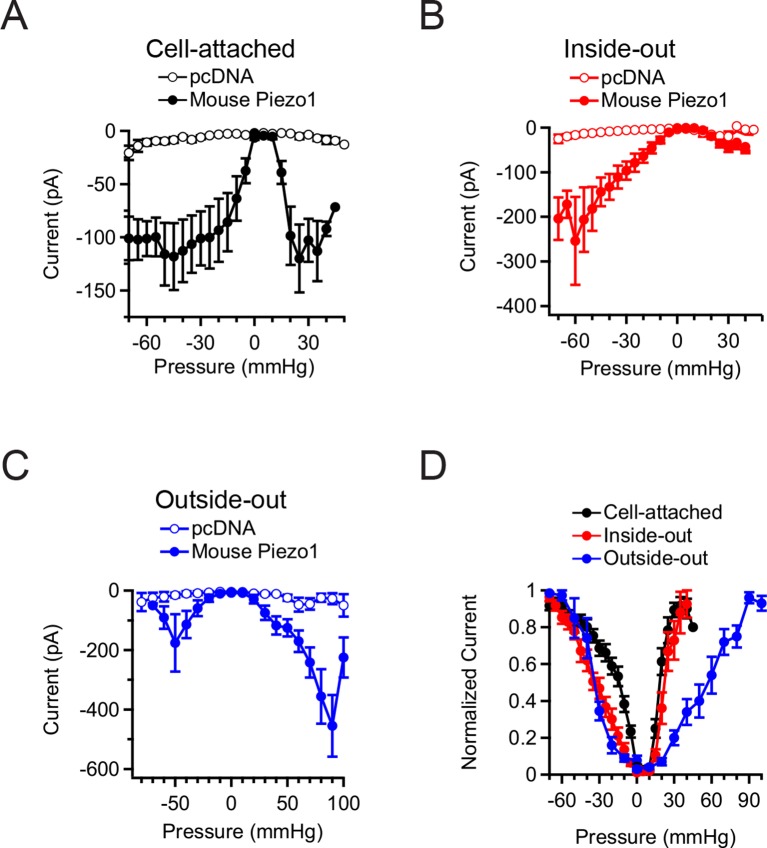
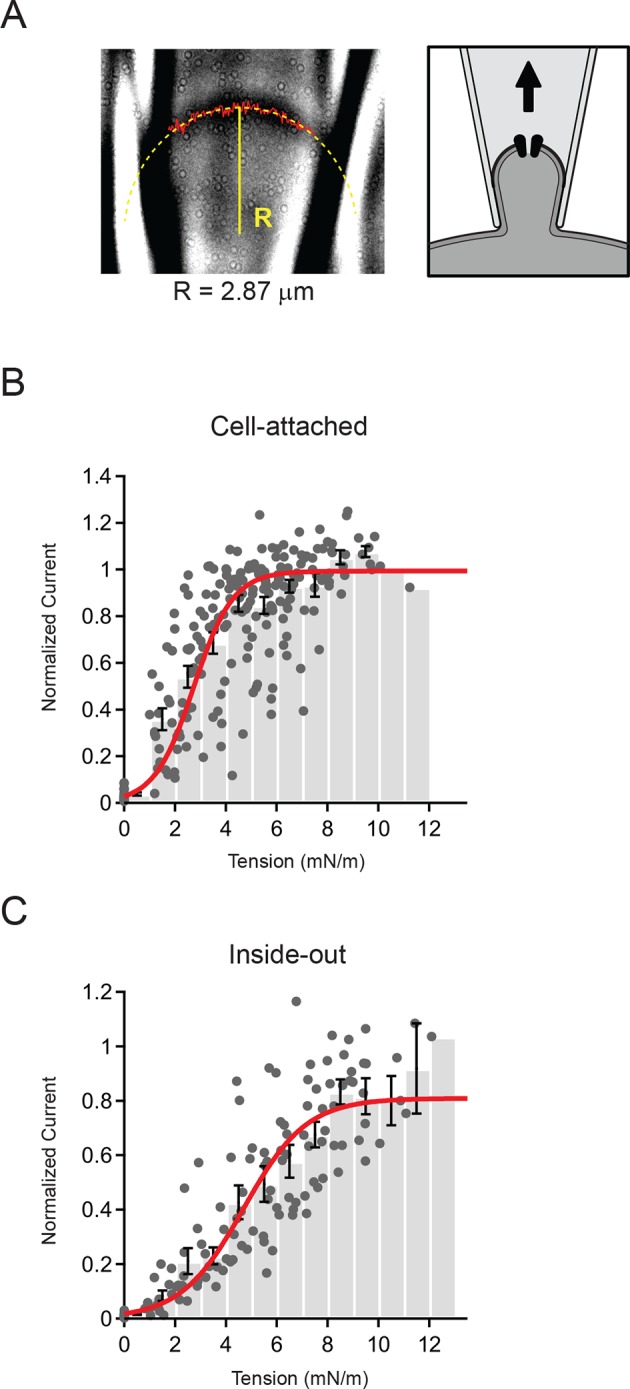
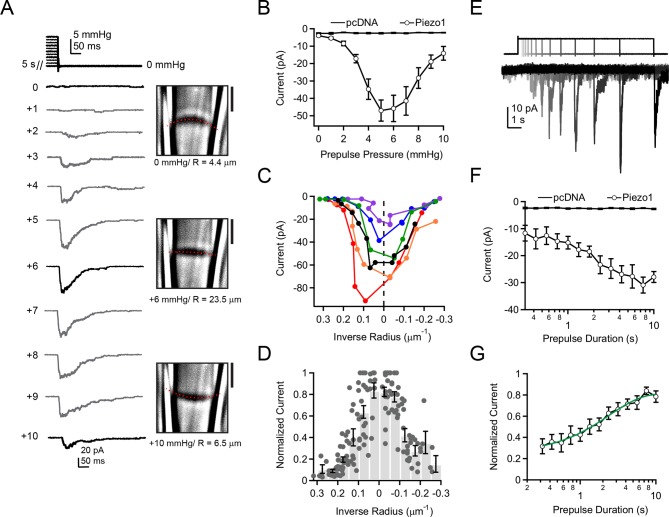
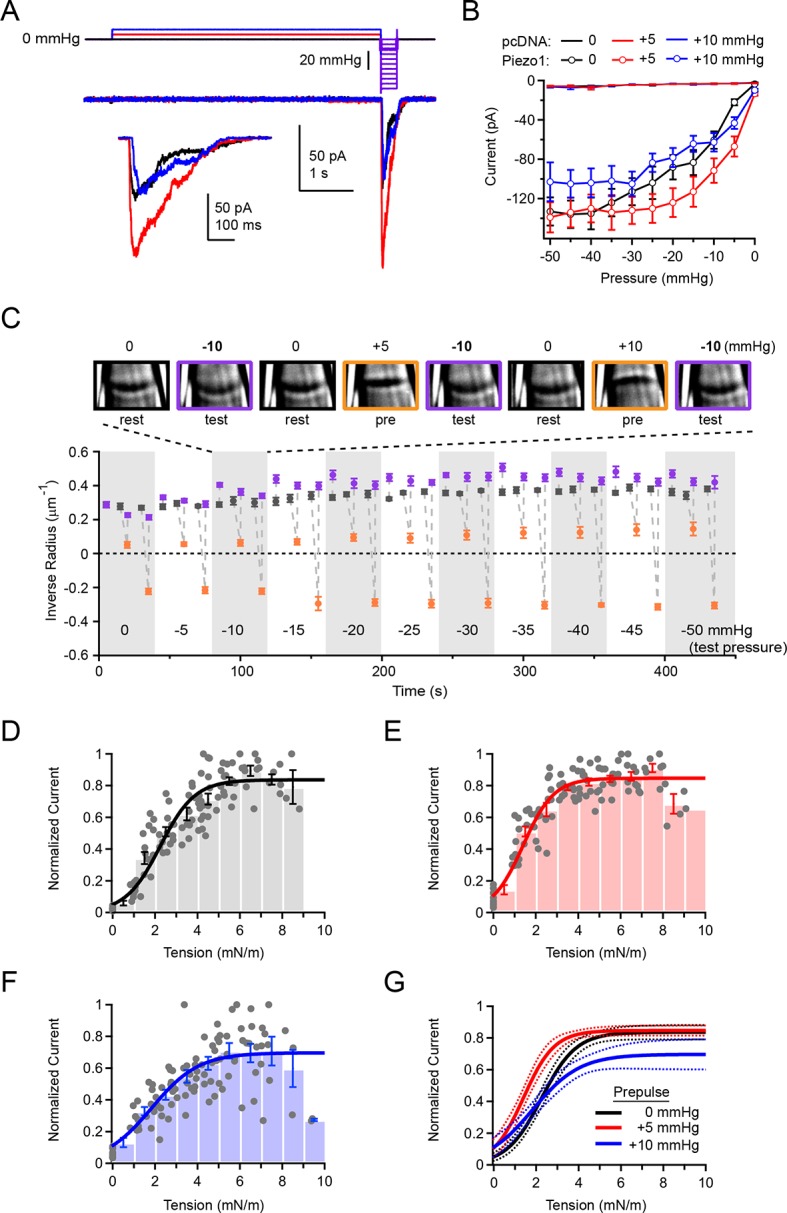
Piezo1 ion channels mediate the conversion of mechanical forces into electrical signals and are critical for responsiveness to touch in metazoans. The apparent mechanical sensitivity of Piezo1 varies substantially across cellular environments, stimulating methods and protocols, raising the fundamental questions of what precise physical stimulus activates the channel and how its stimulus sensitivity is regulated. Here, we measured Piezo1 currents evoked by membrane stretch in three patch configurations, while simultaneously visualizing and measuring membrane geometry. Building on this approach, we developed protocols to minimize resting membrane curvature and tension prior to probing Piezo1 activity. We find that Piezo1 responds to lateral membrane tension with exquisite sensitivity as compared to other mechanically activated channels and that resting tension can drive channel inactivation, thereby tuning overall mechanical sensitivity of Piezo1. Our results explain how Piezo1 can function efficiently and with adaptable sensitivity as a sensor of mechanical stimulation in diverse cellular contexts.

Keywords: Piezo1; biophysics; inactivation; ion channel; mechanically activated; neuroscience; none; structural biology; tension.


Conflict of interest statement

The authors declare that no competing interests exist.

Figures

Figure 1.
Figure 1.. Electrophysiology and high-contrast imaging of Piezo-containing membranes.
Pressure-step protocol, representative currents and corresponding images from individual cell-attached patches from a HEK293t cell expressing mouse Piezo1-IRES-GFP, upon negative (A) and positive (B) pressure stimulation. Pressure-step protocol, respective representative currents and corresponding images from individual inside-out patches upon negative (C) and positive (D) pressure stimulation. Pressure-step protocol, respective representative currents and images from individual outside-out patches upon negative (E) and positive (F) pressure stimulation. All patches were held at −80 mV. Scale bars are 2 µm for all images. DOI: http://dx.doi.org/10.7554/eLife.12088.003
Figure 2.
Figure 2.. Mean Piezo1 current responses for all patch configurations upon positive and negative pressure stimulation.
(A) Pressure-evoked currents from cell-attached patches from HEK293t cells expressing empty vector (pcDNA; open circles) or Mouse Piezo1-IRES-GFP (closed circles). Separate patches were tested for positive and negative pressure stimulation. N = 7 for pcDNA at negative pressure, N = 6 for pcDNA at positive pressure, N = 15 for Piezo1 at negative pressure and N = 12 for Piezo1 at positive pressure. (B) Pressure-evoked currents from inside-out patches from HEK293t cells expressing empty vector (pcDNA; open circles) or Mouse Piezo1-IRES-GFP (closed circles). Separate patches were tested for positive and negative pressure stimulation. N = 4 for pcDNA at negative pressure, N = 3 for pcDNA at positive pressure, N = 10 for Piezo1 at negative pressure and N = 7 for Piezo1 at positive pressure. (C) Pressure-evoked currents from outside-out patches from HEK293t cells expressing empty vector (pcDNA; open circles) or Mouse Piezo1-IRES-GFP (closed circles). Separate patches were tested for positive and negative pressure stimulation. N = 3 for pcDNA at negative pressure, N = 7 for pcDNA at positive pressure, N = 6 for Piezo1 at negative pressure and N = 11 for Piezo1 at positive pressure. (D) Normalized mean current-pressure relations for all six configurations. For each individual patch currents were normalized to the peak current for that patch. All data points are mean ± s.e.m. DOI: http://dx.doi.org/10.7554/eLife.12088.005
Figure 3.
Figure 3.. Measurement of membrane curvature and quantification of membrane tension.
(A) Representative image of cell-attached patch and schematic showing orientation of membrane. The solid red line marks the measured position of the membrane and the dashed yellow line is a circular fit to this position. Both steps were performed using a script written in Igor Pro (see Materials and methods). For this representative patch the radius R from the fit (solid yellow line) was 2.87 µm. (B) Current-tension histogram for Piezo1 responses to negative pressure in cell-attached patches from HEK293t cells. For each cell, current-pressure curves were fit with a sigmoid, and each response normalized to the plateau from the fit. Tension was calculated using the measured membrane curvature from the corresponding image for each response and normalized current plotted against tension (gray circles). Data were binned (bin width 1 mN/m) and pooled (black bars; mean ± s.e.m). Binned data were fit with a Boltzmann function: Imax/(1+exp(-(T-T50])/k])) where Imax is the maximal normalized current, T is tension, T50 is the tension of half-maximal activation, and k is the slope factor. The standard deviation of the normalized amplitude for each bin was used to weight the fit. Fit parameters Imax = 0.99±0.01, T50 = 2.7±0.1 mN/m, k = 0.8±0.1. N = 15 cells and 218 responses. (C) Current-tension histogram for Piezo1 responses to negative pressure in inside-out patches from HEK293t cells. Plot was generated as described in (B). Fit parameters: Imax = 0.81±0.04, T50 = 4.7±0.3 mN/m, k = 1.2±0.1. N = 10 cells and 123 responses. DOI: http://dx.doi.org/10.7554/eLife.12088.006
Figure 4.
Figure 4.. Activation of Piezo1 currents upon release of pressure stimulation.
(A) Left, pressure stimulus protocol and representative currents showing activation of Piezo1 ion channels in a cell-attached patch upon release of a 5 s positive pressure stimulus. Holding potential was −80 mV. Right, corresponding images for 0, +6, and +10 mmHg pressure steps with membrane patch radius R fit superimposed (red dashes) and calculated radius indicated below. (B) Mean peak current upon release of a 5 s positive pressure pulse (0 to +10 mmHg) for cells transfected with empty vector (pcDNA; N = 9 cells) and with mouse Piezo1 (N = 14 cells). (C) Current-radius relationships for six representative measurements performed as shown in (A). The solid black line is showing the measurement in (A). (D) Normalized current-radius relationship for all measurements. For each individual patch currents were normalized to the maximal response from that patch and plotted versus inverse radius. Data were binned (bin width 0.05 µm-1); bars represent mean normalized amplitude ± s.e.m. for each bin. N = 14 cell-attached patches and 148 responses. (E) Pressure-stimulus protocol and representative currents showing the time course of current increase with longer prepulse duration in a patch expressing mouse Piezo1. (F) Mean peak current as a function of prepulse duration for cells transfected with pcDNA or Piezo1 (N = 9 and N = 11, respectively). For each Piezo1 patch, the prepulse amplitude that caused maximal current for that cell (determined with protocol in (A)) was used. For our patch pipette sizes this was typically +5 or +6 mmHg; +5 mmHg was used for all pcDNA patches. (G) Normalized mean peak current as a function of prepulse duration for cells transfected with Piezo1. For each individual patch, currents were normalized to maximal response from that patch. Mean data were fit with an exponential function I=Imax + A*exp(-t-t0)/tau. Fit parameters Imax = 0.82±0.02, A = 0.49±0.02, tau = 2.4±0.3 ms. N = 11 cells. All data points are mean ± s.e.m. DOI: http://dx.doi.org/10.7554/eLife.12088.007
Figure 5.
Figure 5.. Overall Piezo1 sensitivity is regulated by resting membrane tension.
(A) Stimulus protocol and representative currents from a cell-attached HEK293t cell patch expressing mouse Piezo1-IRES-GFP. The test pulse for these currents was −10 mmHg (thick purple line); holding potential was −80 mV. Inset shows test currents at magnified scale. (B) Peak current-pressure relationships for test pulses (0 to −50mmHg, Δ5 mmHg) following 5 s 0 mmHg, +5 mmHg and +10 mmHg prepulses.. All data points are mean ± s.e.m. N = 8 cell-attached patches (pcDNA) and 11 cell-attached patches (Piezo1). (C) Mean patch curvature as a function of time during protocol performed shown in (A). Representative images of one individual patch are shown above. Each patch was tested with no prepulse (0 mmHg), a +5 mmHg prepulse, and a +10 mmHg prepulse at each test pressure before advancing to the next test pressure. Grey markers show inverse radius during rest periods (0 mmHg, between stimuli), purple markers show inverse radius during 300 ms test pulses (0 to −50 mmHg, Δ5 mmHg), orange markers show inverse radius during +5 mmHg or +10 mmHg prepulse. All data points are mean ± s.e.m. N = 11 for cell-attached patches. (D–F) Normalized current-tension relationships obtained from protocol shown in (A) using no prepulse (0 mmHg) (D), +5 mmHg prepulse (E) and +10 mmHg prepulse (F). Currents from individual patches are normalized to the maximal response for each patch. Data were pooled and binned (bin width 1 mN/m); bars represent mean ± s.e.m. N = 11 patches. Binned data were fit with a Boltzmann function I = Imax/(1+exp(-(T-T50/k)) where I is normalized current, Imax is the plateau, T is tension, T50 is the tension of half-maximal activation, and k is the slope factor. The standard deviation of the normalized amplitude for each bin was used to weight the fit. Fit parameters for no prepulse (0 mmHg): Imax = 0.84±0.02, T50 = 2.2±0.1 mN/m, k = 0.8±0.1. For +5 mmHg prepulse: Imax = 0.85±0.01, T­­50 = 1.4±0.1 mN/m, k = 0.7±0.1. For +10 mmHg prepulse: Imax = 0.70±0.04, T50 = 1.8±0.2 mN/m, k = 1.1±0.2. (G) Fits from D-F overlayed (solid line) with 95% confidence intervals (dashed lines). DOI: http://dx.doi.org/10.7554/eLife.12088.008

References

    1. Akitake B, Anishkin A, Sukharev S. The "dashpot" mechanism of stretch-dependent gating in MscS. The Journal of General Physiology. 2005;125:143–154. doi: 10.1085/jgp.200409198. - DOI - PMC - PubMed
    1. Albuisson J, Murthy SE, Bandell M, Coste B, Louis-Dit-Picard H, Mathur J, Fénéant-Thibault M, Tertian G, de Jaureguiberry JP, Syfuss PY, Cahalan S, Garçon L, Toutain F, Simon Rohrlich P, Delaunay J, Picard V, Jeunemaitre X, Patapoutian A. Dehydrated hereditary stomatocytosis linked to gain-of-function mutations in mechanically activated PIEZO1 ion channels. Nature Communications. 2013;4:1884. doi: 10.1038/ncomms2899. - DOI - PMC - PubMed
    1. Antonny B. Mechanisms of membrane curvature sensing. Annual Review of Biochemistry. 2011;80:101–123. doi: 10.1146/annurev-biochem-052809-155121. - DOI - PubMed
    1. Bae C, Gnanasambandam R, Nicolai C, Sachs F, Gottlieb PA. Xerocytosis is caused by mutations that alter the kinetics of the mechanosensitive channel PIEZO1. Proceedings of the National Academy of Sciences of the United States of America. 2013;110:e12088. doi: 10.1073/pnas.1219777110. - DOI - PMC - PubMed
    1. Blumenthal NR, Hermanson O, Heimrich B, Shastri VP. Stochastic nanoroughness modulates neuron–astrocyte interactions and function via mechanosensing cation channels. Proceedings of the National Academy of Sciences of the United States of America. 2014;111:16124–16129. doi: 10.1073/pnas.1412740111. - DOI - PMC - PubMed

Publication types