

Declining resilience of ecosystem functions under biodiversity loss
- PMID: 26646209
- PMCID: PMC4686828
- DOI: 10.1038/ncomms10122
Declining resilience of ecosystem functions under biodiversity loss
Abstract
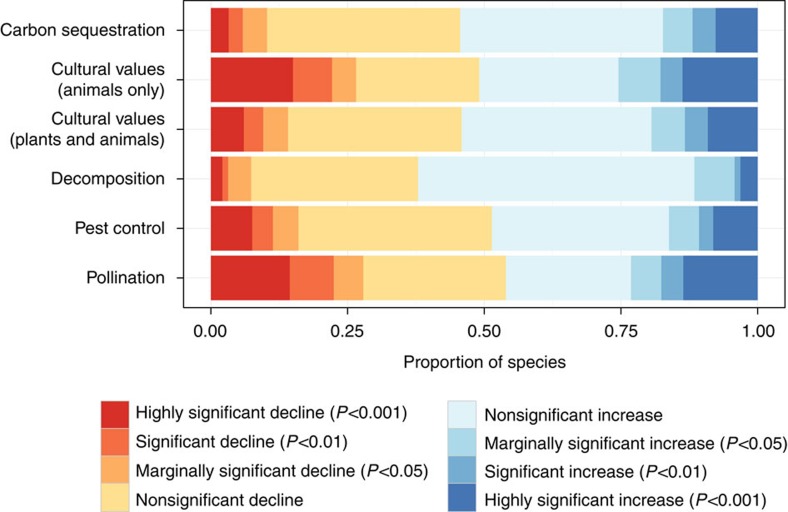
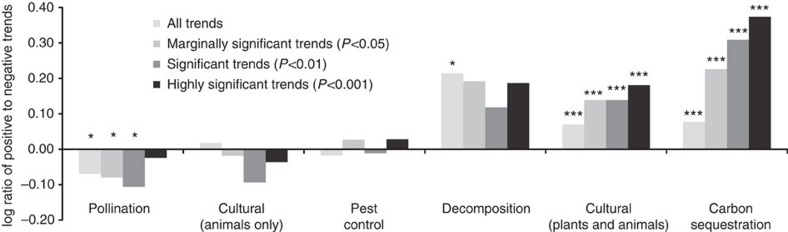
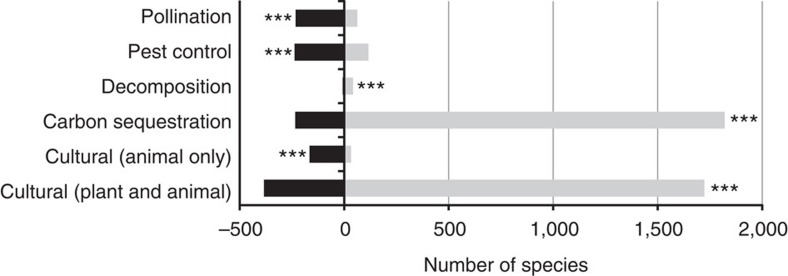
The composition of species communities is changing rapidly through drivers such as habitat loss and climate change, with potentially serious consequences for the resilience of ecosystem functions on which humans depend. To assess such changes in resilience, we analyse trends in the frequency of species in Great Britain that provide key ecosystem functions--specifically decomposition, carbon sequestration, pollination, pest control and cultural values. For 4,424 species over four decades, there have been significant net declines among animal species that provide pollination, pest control and cultural values. Groups providing decomposition and carbon sequestration remain relatively stable, as fewer species are in decline and these are offset by large numbers of new arrivals into Great Britain. While there is general concern about degradation of a wide range of ecosystem functions, our results suggest actions should focus on particular functions for which there is evidence of substantial erosion of their resilience.
Figures
Similar articles
-
Biodiversity and Resilience of Ecosystem Functions.Trends Ecol Evol. 2015 Nov;30(11):673-684. doi: 10.1016/j.tree.2015.08.009. Epub 2015 Oct 1. Trends Ecol Evol. 2015. PMID: 26437633 Review.
-
Patterns of invertebrate functional diversity highlight the vulnerability of ecosystem services over a 45-year period.Curr Biol. 2021 Oct 25;31(20):4627-4634.e3. doi: 10.1016/j.cub.2021.07.080. Epub 2021 Aug 18. Curr Biol. 2021. PMID: 34411527
-
Pollution, habitat loss, fishing, and climate change as critical threats to penguins.Conserv Biol. 2015 Feb;29(1):31-41. doi: 10.1111/cobi.12349. Epub 2014 Aug 7. Conserv Biol. 2015. PMID: 25102756 Review.
-
Parallel declines in pollinators and insect-pollinated plants in Britain and the Netherlands.Science. 2006 Jul 21;313(5785):351-4. doi: 10.1126/science.1127863. Science. 2006. PMID: 16857940
-
Biodiversity increases the resistance of ecosystem productivity to climate extremes.Nature. 2015 Oct 22;526(7574):574-7. doi: 10.1038/nature15374. Epub 2015 Oct 14. Nature. 2015. PMID: 26466564
Cited by
-
Stable gullies provide a suitable habitat for functional insects and reduce the threat of pests on crops in farmland of Northeast China.Ecol Evol. 2024 Jul 7;14(7):e11686. doi: 10.1002/ece3.11686. eCollection 2024 Jul. Ecol Evol. 2024. PMID: 38975262 Free PMC article.
-
Biodiversity loss and climate extremes - study the feedbacks.Nature. 2022 Dec;612(7938):30-32. doi: 10.1038/d41586-022-04152-y. Nature. 2022. PMID: 36446988 No abstract available.
-
Harnessing the microbiome to prevent global biodiversity loss.Nat Microbiol. 2022 Nov;7(11):1726-1735. doi: 10.1038/s41564-022-01173-1. Epub 2022 Jul 21. Nat Microbiol. 2022. PMID: 35864220 Review.
-
Agriculture and climate change are reshaping insect biodiversity worldwide.Nature. 2022 May;605(7908):97-102. doi: 10.1038/s41586-022-04644-x. Epub 2022 Apr 20. Nature. 2022. PMID: 35444282
-
Just a small bunch of flowers: the botanical knowledge of students and the positive effects of courses in plant identification at German universities.PeerJ. 2019 Mar 13;7:e6581. doi: 10.7717/peerj.6581. eCollection 2019. PeerJ. 2019. PMID: 30886774 Free PMC article.
References
-
- Mace G. M., Norris K. & Fitter A. H. Biodiversity and ecosystem services: a multilayered relationship. Trends Ecol. Evol. 27, 19–26 (2012). - PubMed
-
- Balvanera P. et al. Quantifying the evidence for biodiversity effects on ecosystem functioning and services. Ecol. Lett. 9, 1146–1156 (2006). - PubMed
-
- Cardinale B. J. et al. Biodiversity loss and its impact on humanity. Nature 486, 59–67 (2012). - PubMed
-
- Loreau M. & de Mazancourt C. Biodiversity and ecosystem stability: a synthesis of underlying mechanisms. Ecol. Lett. 16, 106–115 (2013). - PubMed
-
- Oliver T. H. et al. Biodiversity and resilience of ecosystem functions. Trends Ecol. Evol 30, 673–684 (2015). - PubMed
Publication types
MeSH terms
Grants and funding
LinkOut - more resources
Full Text Sources
Other Literature Sources
Molecular Biology Databases
