Review
. 2015 Dec 23;115(24):13165-307.
doi: 10.1021/acs.chemrev.5b00299. Epub 2015 Dec 8.

Supramolecular Hydrogelators and Hydrogels: From Soft Matter to Molecular Biomaterials

Affiliations
Review

Supramolecular Hydrogelators and Hydrogels: From Soft Matter to Molecular Biomaterials

Xuewen Du et al. Chem Rev. .

Abstract

In this review we intend to provide a relatively comprehensive summary of the work of supramolecular hydrogelators after 2004 and to put emphasis particularly on the applications of supramolecular hydrogels/hydrogelators as molecular biomaterials. After a brief introduction of methods for generating supramolecular hydrogels, we discuss supramolecular hydrogelators on the basis of their categories, such as small organic molecules, coordination complexes, peptides, nucleobases, and saccharides. Following molecular design, we focus on various potential applications of supramolecular hydrogels as molecular biomaterials, classified by their applications in cell cultures, tissue engineering, cell behavior, imaging, and unique applications of hydrogelators. Particularly, we discuss the applications of supramolecular hydrogelators after they form supramolecular assemblies but prior to reaching the critical gelation concentration because this subject is less explored but may hold equally great promise for helping address fundamental questions about the mechanisms or the consequences of the self-assembly of molecules, including low molecular weight ones. Finally, we provide a perspective on supramolecular hydrogelators. We hope that this review will serve as an updated introduction and reference for researchers who are interested in exploring supramolecular hydrogelators as molecular biomaterials for addressing the societal needs at various frontiers.


Conflict of interest statement

The authors declare no competing financial interest.

Figures

Figure 1
Figure 1
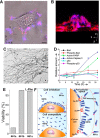
(A) Illustration of the process for creating polymeric hydrogels via cross-linking (left), or formation of supramolecular hydrogels via a chemical or physical perturbation initiated self-assembly (right). Adapted with permission from ref (6). Copyright 2006 Wiley-VCH Verlag GmbH & Co. KGaA. (B) Molecular structures of 1 and 2. (C) Molecular structure of Nap-FF (3). (D) Optical image and negatively stained TEM image of the hydrogel of 3. Adapted from ref (14). Copyright 2011 American Chemical Society.
Scheme 1
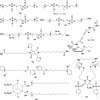
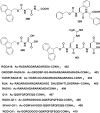
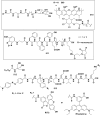
Scheme 1. Representative Molecular Structures of Hydrogelators To Form Hydrogels after Receiving Different Stimuli
Scheme 2
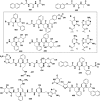
Scheme 2. Representative Molecular Structures of Precursors and Hydrogelators To Form Hydrogels after Chemical Reactions
Scheme 3
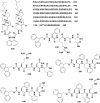
Scheme 3. Representative Molecular Structures of Hydrogelators
Scheme 4
Scheme 4. Molecular Structures of a Photochemical Precursor of a Hydrogelator
Scheme 5
Scheme 5. Representative Molecular Structure of Hydrogelators
Scheme 6
Scheme 6. Representative Molecular Structures of Precursors and Hydrogelators To Form Hydrogels on the Basis of Catalysis
Scheme 7
Scheme 7. Representative Molecular Structures of Hydrogelators
Scheme 8
Scheme 8. Representative Molecular Structures of Urea-Containing Hydrogelators
Scheme 9
Scheme 9. Representative Molecular Structures of Pyridine-Containing Hydrogelators
Scheme 10
Scheme 10. Alkyl-Chain-Containing Hydrogelators
Scheme 11
Scheme 11. Representative Molecular Structures of Alkyl-Chain-Containing Hydrogelators
Scheme 12
Scheme 12. Hydrogelators Containing Multi/Polyhydroxyl Groups
Scheme 13
Scheme 13. Hydrogelators Having C3 Symmetry
Figure 2
Figure 2
Cryo-TEM images of unilamellar dioleoylphosphocholine (DOPC) vesicles coexisting with a network of well-defined fibers of 67 with a high aspect ratio. Adapted with permission from ref (321). Copyright 2008 Wiley-VCH Verlag GmbH & Co. KGaA.
Figure 3
Figure 3
Catalytic formation of trishydrazone hydrogelator 70 from soluble building blocks 68 and 69 leads to supersaturation followed by formation of fibers that eventually cross-link to form a network that traps the surrounding solvent, leading to gelation: blue, hydrophilic functional groups; red, hydrophobic functional groups. Adapted with permission from ref (142). Copyright 2014 Nature America.
Scheme 14
Scheme 14. Bile Acid-Derived Hydrogelators
Scheme 15
Scheme 15. Some Bile Acid- or Cholesterol-Derived Hydrogelators
Scheme 16
Scheme 16. Bolaamphiphiles as Hydrogelators
Scheme 17
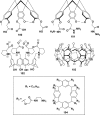
Scheme 17. Some Hydrogelators Containing a Cavity
Scheme 18
Scheme 18. Some Hydrogelators Containing a Polyaromatic Core
Scheme 19
Scheme 19. Some Hydrogelators of Homotypic Hydrogels
Scheme 20
Scheme 20. Some Hydrogelators Composed of Two Components
Scheme 21
Scheme 21. Some Representative Hydrogelators Composed of Two Components
Figure 4
Figure 4
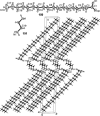
ORTEP diagrams of 150 and 151 with the atom numbering scheme for the asymmetric unit, and the molecular packing of 150 and 151 showing the columnar supramolecular architectures, characterized by a lipophilic exterior and a polar interior. Adapted with permission from ref (55). Copyright 2008 Wiley-VCH Verlag GmbH & Co. KGaA.
Scheme 22
Scheme 22. Ligands That Bind Metal Ions via Carboxylic Group To Form Supramolecular Hydrogels
Scheme 23
Scheme 23. Some of the Ligands That Bind Metal Ions via Nitrogen in the Supramolecular Hydrogels and Some Representative Complexes
Scheme 24
Scheme 24. Some of the Ligands That Bind Metal Ions via Nitrogen in the Supramolecular Hydrogels and Some Representative Complexes
Scheme 25
Scheme 25. Some of the Ligands That Bind Metal Ions via Nitrogen in the Supramolecular Hydrogels and Some Representative Complexes
Scheme 26
Scheme 26. Some of the Ligands Bearing Thiol Groups
Scheme 27
Scheme 27. Chemical Structure of a Ligand Containing Phosphate Groups
Scheme 28
Scheme 28. Metal Complexes As Hydrogelators
Scheme 29
Scheme 29. Representative Molecular Structures of Amino Acid Derivative Hydrogelators Containing an Alkyl Chain
Scheme 30
Scheme 30. Representative Hydrogelators of Ionic Amino Acid Derivatives
Scheme 31
Scheme 31. Representative Molecular Structures of Hydrogelators Containing Aromatic Groups
Scheme 32
Scheme 32. Representative Molecular Structure of a Hydrogelator Based on a Bolaamphiphile
Figure 5
Figure 5
Molecular model of 209 self-assembled structures. The model is based on the crystal X-ray structure of the diphenylalanine peptide. The dipeptide backbone and hydrophobic side chains are shown as stick representations. Adapted with permission from ref (564). Copyright 2007 Biophysical Society.
Scheme 33
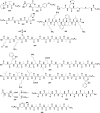
Scheme 33. Representative Molecular Structures of Cyclopeptide Hydrogelators
Scheme 34
Scheme 34. Representative Molecular Structure of a Peptidic Hydrogelator with Capped N- and C-Terminals
Scheme 35
Scheme 35. Representative Molecular Structures of Hydrogelators Containing Alkyl/Lipid Chains
Scheme 36
Scheme 36. Representative Molecular Structures of Hydrogelators Containing Aromatic Groups
Figure 6
Figure 6
Molecular packing and hydrogen bonds in the crystal of 3 (recrystallized from ethanol): views from the (A) a, (B) b, and (C) c axes and (D) view from the c axis to show the hydrogen bonding (green dotted lines) of one molecule with four other molecules and some aromatic–aromatic interactions (yellow lines). Adapted from ref (14). Copyright 2011 American Chemical Society.
Scheme 37
Scheme 37. Representative Molecular Structures of Hydrogelators Containing Naphthalenyl Groups
Scheme 38
Scheme 38. Representative Molecular Structures of Hydrogelators Containing Pyrene Groups
Scheme 39
Scheme 39. Representative Molecular Structures of Hydrogelators Containing Aromatic Groups
Scheme 40
Scheme 40. Representative Molecular Structures of Hydrogelators Containing a Photoresponsive Group
Scheme 41
Scheme 41. Representative Molecular Structures of Hydrogelators Based on Bolaamphiphiles
Scheme 42
Scheme 42. Representative Molecular Structures of Hydrogelators Based on Dendrimers or Dendrons
Scheme 43
Scheme 43. Representative Molecular Structures of Hydrogelators
Scheme 44
Scheme 44. Hydrogelators Containing Nucleobases
Figure 7
Figure 7
TEM images of gel 340 (scale bar 50 nm). Adapted from ref (819). Copyright 2009 American Chemical Society.
Scheme 45
Scheme 45. Nucleobase Derivatives for Multicomponent Hydrogels
Scheme 46
Scheme 46. Some Monosaccharide-Based Hydrogelators
Scheme 47
Scheme 47. Some Monosaccharide-Based Hydrogelators
Scheme 48
Scheme 48. Monosaccharide-Based Hydrogelators
Scheme 49
Scheme 49. Some Oligosaccharide-Based Hydrogelators
Scheme 50
Scheme 50. Representative Molecular Structures of Hydrogelators for 3D Cell Culture
Figure 8
Figure 8
The viability of NIH/3T3 cells encapsulated in 30 mM 407 microgels was quantified with calcein/ethidium homodimer staining. The assay was conducted 2 h after the incubation of (a) 1 day, (b) 2 days, and (c) 3 days. The scale bar in (a) represents 100 mm. The magnification is the same in (a)–(c). Adapted with permission from ref (918). Copyright 2011 Royal Society of Chemistry.
Scheme 51
Scheme 51. Representative Molecular Structures of Hydrogelators for 3D Cell Culture
Scheme 52
Scheme 52. Representative Molecular Structures of Hydrogelators for 3D Cell Culture
Figure 9
Figure 9
Confocal microscopy of SHED cells 1, 3, or 11 days after 3D encapsulation in 422 hydrogels. Adapted from ref (934). Copyright 2014 American Chemical Society.
Scheme 53
Scheme 53. Representative Molecular Structures of Hydrogelators for 3D Cell Culture
Scheme 54
Scheme 54. Representative Molecular Structures of Hydrogelators for 3D Cell Culture
Scheme 55
Scheme 55. Representative Molecular Structures of Cell-Compatible Hydrogelators
Scheme 56
Scheme 56. Representative Molecular Structures of Cell-Compatible Hydrogelators
Figure 10
Figure 10
(A) Dephosphorylation process catalyzed by ALP with 454A to result in nanofibers and a hydrogel. (B) Cell viability test for 72 h of 454. (C) Optical images of HeLa cells on the surface 0 and 20 h after creation of scratchs in the presence of hydrogel 454T (by adding 27.7 mM 454T to the media). Adapted with permission from ref (965). Copyright 2011 Wiley-VCH Verlag GmbH & Co. KGaA.
Scheme 57
Scheme 57. Representative Molecular Structures of Cell-Compatible Hydrogelators
Figure 11
Figure 11
Formation mechanism of hydrogel 465: (A) hydrogen-bond-driven self-assembly, (B) self-assembled fibrils, (C) fibrils with a hydrogelator concentration lower than the minimum gelation concentration (MGC), (D) entangled fibrils with a hydrogelator concentration higher than the MGC, (D) well-organized 3D hierarchical nanoarchitectures with ultrasound treatment, (F) cells seeded in hydrogels, (G) optical image of the hydrogel (the transition from solution to hydrogel was reversible). Adapted with permission from ref (85). Copyright 2013 Royal Society of Chemistry.
Scheme 58
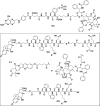
Scheme 58. Representative Molecular Structures of Cytotoxic Hydrogelators
Figure 12
Figure 12
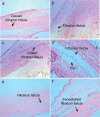
Histological section of rabbit eyes which underwent filtration surgery (a) alone at 14 days postsurgery, received the Fmoc-FF (6) hydrogel at (b) 7 and (c) 14 days postsurgery, and received the glycopeptide hydrogel (476) at (d) 7, (e) 14, and (f) 21 days postsurgery. Hematoxylin–eosin; magnification 100×. Adapted with permission from ref (92). Copyright 2012 Royal Society of Chemistry.
Scheme 59
Scheme 59. Representative Molecular Structures of Hydrogelators for Cell Adhesion
Figure 13
Figure 13
(A) Percentages of strongly attached 3T3-L1 cells. 3T3-L1 cells were incubated on the flat hydrogels composed of 482 containing 0%, 10%, or 20% 483, fibronectin (FN), tissue-culture-treated plates (TCTPs), or nonadhesive plate surfaces in Dulbecco’s modified Eagle’s medium containing 5 mM Ca2+. (B) Fluorescence microscopic images of cell-adhered peptide gel strings. PC12 cells were cultured in Dulbecco’s modified Eagle’s medium containing 5 mM Ca2+ for 6 days. The scale bar represents 100 μm. Adapted with permission from ref (993). Copyright 2012 The Society of Polymer Science, Japan (SPSJ).
Scheme 60
Scheme 60. Representative Molecular Structures of Hydrogelators for Cell Adhesion
Scheme 61
Scheme 61. Representative Molecular Structures of Hydrogelators
Scheme 62
Scheme 62. Representative Molecular Structures of Hydrogelators
Figure 14
Figure 14
Temperature-dependent UV/vis spectra of aqueous solutions (∼10–5 M) of (A) 494 and (B) 495 containing 1 equiv of disperse orange 3. Arrows indicate the spectroscopic changes with increasing temperature. The insets depict the changes in the absorbance at 400 nm as a function of temperature. Adapted with permission from ref (1021). Copyright 2010 Wiley-VCH Verlag GmbH & Co. KGaA.
Scheme 63
Scheme 63. Representative Molecular Structures of Hydrogelators for Chemosensing
Scheme 64
Scheme 64. Representative Molecular Structures of Hydrogelators for Chemosensors
Figure 15
Figure 15
Schematic illustration of the sensing strategy of diffraction grating for human thrombin detection. (A) The hydrogel 508 contains an aptamer and its complementary sequence as the supermolecular cross-linking points and swells when exposed to the human thrombin. (B) Response of the hydrogel grating to human thrombin in the solution. Adapted with permission from ref (1036). Copyright 2013 Royal Society of Chemistry.
Scheme 65
Scheme 65. Representative Molecular Structures of Hydrogelators for Biosensors
Scheme 66
Scheme 66. Representative Molecular Structures of Fluorescent Hydrogelators
Figure 16
Figure 16
(A) Optical images of the oxidation-induced gel–sol transition and the TEM images corresponding to the samples at different states of transition. The hydrogel (reduced state) is formed by 0.8% (w/v) 10 in water at pH 1. The scale bar represents 10 nm. (B) Fluorescent images of a HeLa cell incubated with 3 (200 μM, 24 h). Adapted from ref (117). Copyright 2013 American Chemical Society.
Scheme 67
Scheme 67. Representative Molecular Structures of Hydrogelators
Figure 17
Figure 17
(A) The nanofibers of 520 could specifically bind to Cu2+, leading to the formation of fluorescence-quenched elongated nanofibers. Confocal images (bright field + fluorescence) of (B) HeLa cells treated with 520 (0.05 wt %) at a 2 h time point and (C) HeLa cells pretreated with 100 μM Cu2+ and then treated with 520 (0.05 wt %) at a 6 h time point. Adapted from ref (1065). Copyright 2014 American Chemical Society.
Figure 18
Figure 18
LSCM xy projections taken of 2.5 × 10³ CFUs/dm2E. coli incubated on (A) a borosilicate control surface and (B) the hydrogel of 2 wt % 251 after 24 h. The gel is viewed parallel to the z-axis. Green fluorescence denotes live cells, and red fluorescence denotes dead cells with compromised membranes. (C) LSCM xy projections taken of 2.5 × 10⁹ CFUs/dm2E. coli incubated on the surface of the hydrogel of 2 wt % 251 viewed perpendicular to the z-axis. Arrows denote the gel–bacterial interface. Adapted from ref (1068). Copyright 2007 American Chemical Society.
Scheme 68
Scheme 68. Representative Molecular Structures of Antibacterial Hydrogelators
Scheme 69
Scheme 69. Representative Molecular Structures of Antibacterial Hydrogelators
Figure 19
Figure 19
(A) Representative SEM images and (B) overlapping fluorescence images for the LIVE/DEAD bacterial staining assay of S. aureus before and after contact with the coassembled (200 + 533) hydrogel for 2 h. Two fluorescent dyes were used in LIVE/DEAD staining in which SYTO 9 with green color labeled both live and dead bacteria while propidium iodide with red color stained only dead bacteria. Adapted with permission from ref (1082). Copyright 2015 Wiley-VCH Verlag GmbH & Co. KGaA.
Scheme 70
Scheme 70. Representative Molecular Structures of Hydrogelators for Tissue Engineering
Figure 20
Figure 20
Nanofibrous hydrogels are reported to be compatible with NIH/3T3 fibroblasts. In the presence of serum, fibroblasts spread by 28 h. At 72 h, spreading appeared to be spindle-like, resembling the natural morphology of the cell type. The fibroblasts proliferated for a minimum of 96 h. These images are from a single hydrogel of 544. Adapted with permission from ref (1117). Copyright 2012 Royal Society of Chemistry.
Figure 21
Figure 21
(A–L) Analysis of transplanted mucosal epithelial cells in recipient tissues at postoperative days 14 and 28. Serial frozen sections of middle-ear bullae after transplantation (0.5 × 10⁶ cells/mL) at (A–F) postoperative day 14 and (G–L) postoperative day 28. (A, B, G, H) Fluorescence images at several time points. Enhanced green fluorescent protein (EGFP)-expressing cells were detected on the internal surface of recipient middle-ear bullae (green, EGFP; blue, 4′,6-diamidino-2-phenylindole) (A, G). Results of immunostaining with (C, I) antipancytokeratin, (D, J) antivimentin, (E, K) anticollagen III, and (F, L) anticollagen IV antibody. EGFP-expressing cells were positive for pancytokeratin (C, I, arrows), but not for vimentin (D, J). Collagen III-positive regions were detected mainly in the subepithelium (E, K). Collagen IV-positive regions were detected under the monolayer structure of donor cells at 14 and 28 days after transplantation (F, L, arrowheads). The scale bars represent 50 μm. Adapted with permission from ref (1121). Copyright 2013 Dove Medical Press Ltd.
Scheme 71
Scheme 71. Representative Molecular Structures of Hydrogelators Encapsulating Drugs
Figure 22
Figure 22
(a) Profiles of the mean blood concentration of 125I-NaI vs time after subcutaneous (sc) administration to rats (160 μCi/kg) (■, control, 125I-NaI solution, AUC (area under the curve) = 1213.3 μCi·h/L; ●, experimental, 125I-NaI in gel II, AUC = 1453.5 μCi·h/L). (b) Dynamic (upper two lines) and static (lower line) single-photon emission computed tomography (SPECT) images of rats with 131I-NaI (500 μCi/rat; left, in solution; right, in gel II) administered sc. (c) Profiles of the mean blood concentration of 125I-epidepride vs time after sc administration to rats (160 μCi/kg) (■, control, 125I-epidepride solution, AUC = 645.5 μCi·h/L; ●, experimental, 125I-epidepride in gel II, AUC = 693.6 μCi·h/L). (d) Dynamic SPECT images of rats with 131I-epidepride (500 μCi/rat; left, in gel II; right, in solution) administered sc. Adapted from ref (1176). Copyright 2009 American Chemical Society.
Scheme 72
Scheme 72. Representative Molecular Structures of Hydrogelators Encapsulating Drugs
Figure 23
Figure 23
(A) Illustration of the injectable nature of the hydrogel and its vitamin release phenomenon with vitamin B12. (B) Percentage release plot of some important biomolecules from hydrogel 564 at physiological pH (7.46) and temperature (37 °C), where the concentration of the drugs loaded into the hydrogel was 1.14 mg/mL for cyanocobalamin (vitamin B12) and 0.24 mg/mL for vancomycin. Adapted from ref (1179). Copyright 2014 American Chemical Society.
Scheme 73
Scheme 73. Representative Molecular Structures of Hydrogelators Encapsulating Drugs
Scheme 74
Scheme 74. Representative Molecular Structures of Hydrogelators Conjugated with Drugs
Figure 24
Figure 24
Supramolecular nanofibers sequester the potential targets (e.g., 16S rRNA (in red)) in the gel phase. Adapted with permission from ref (1202). Copyright 2012 Royal Society of Chemistry.
Scheme 75
Scheme 75. Representative Molecular Structures of Hydrogelators Conjugated with Drugs
Scheme 76
Scheme 76. Representative Molecular Structures of Hydrogelators Conjugated with Drugs
Scheme 77
Scheme 77. Representative Molecular Structures of Hydrogelators Conjugated with Drugs
Figure 25
Figure 25
(A) Percentage of wound area left in different groups at day 7 compared to the original wound area (mean ± SEM) at day 0. (B) Photographs of wounds in animals treated with PBS buffer, 3 (hydrogel containing 1.0 wt % 3), free NO + GAL (solution containing 0.2 wt % NO donor with daily addition of 1.5 × 10⁻⁴ U of β-galactosidase), NO gel (hydrogel containing 1.0 wt % 3 and 0.6 wt % 595 without the addition of β-galactosidase), and NO gel + GAL (hydrogel containing 1.0 wt % 3 and 0.6 wt % 595 with the addition of 1.5 × 10⁻⁴ U of β-galactosidase each day). Adapted with permission from ref (1211). Copyright 2013 Royal Society of Chemistry.
Scheme 78
Scheme 78. Representative Molecular Structures of Hydrogelators for Immunological Modulation
Figure 26
Figure 26
Process of a peptide-based nanofibrous hydrogel enhancing the immune responses of HIV DNA vaccines. Adapted from ref (943). Copyright 2014 American Chemical Society.
Scheme 79
Scheme 79. Representative Molecular Structures of Hydrogelators for Immunological Modulation
Figure 27
Figure 27
(A) Molecule 623 self-assembles to form a hydrogel. Gross appearance of the wound site treated without (B) or with (C) the gel on day 6. Adapted with permission from ref (1235). Copyright 2007 Royal Society of Chemisty.
Scheme 80
Scheme 80. Some Supramolecular Hydrogelators for Wound Healing
Figure 28
Figure 28
Interplay between supramolecular assemblies and proteins. (I) Enzyme-instructed self-assembly (EISA): the enzyme transforms a precursor to the self-assembling small molecules (i.e., hydrogelator) to form the supramolecular assemblies (in the form of nanofibers/hydrogel). (II) Molecular hydrogel protein binding (MHPB) assay: the hydrogels formed by the supramolecular assemblies bind proteins for proteomic analysis and identification of the protein targets of the assemblies.
Figure 29
Figure 29
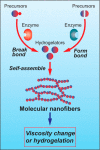
Illustration of EISA to form supramolecular nanofibers via bond formation or bond cleavage and the macroscopic outcomes (i.e., viscosity change or hydrogelation).
Figure 30
Figure 30
(A) Molecular structures of the precursor 14 and its corresponding hydrogelator 15 and the enzymatic transformation. (B) Transmission electron microscopy (TEM) image of the nanofibers made by the self-assembly of 15. Optical images of (C) the solution of 14 in alkali buffer (pH 9.8) and (D) the hydrogel formed by adding the phosphatase to the solution of 14 to produce the nanofibers of 15. Adapted with permission from ref (153). Copyright 2004 Wiley-VCH Verlag GmbH & Co. KGaA.
Figure 31
Figure 31
(A) Structures of the precursors 200 and 208 and the hydrogelator 447 and the enzymatic transformation. (B) SEM image of the corresponding nanofibers (scale bar 500 nm). Inset: optical image of the hydrogel. Adapted from ref (162). Copyright 2006 American Chemical Society.
Figure 32
Figure 32
(A) Structures of the precursor 630 and the hydrogelator 631 and the corresponding transformations catalyzed by phosphatase and kinase. (B) TEM images showing (I, left) the nanofibers of 630 formed by adjusting the pH, (II, middle) the absence of nanofibers due to enzymatic phosphorylation of 630, and (III, right) the restored nanofibers of 630 by enzymatic dephosphorylation of 631. (C) Optical images of (I) the hydrogel of 630 formed by changing the pH, (II) the solution obtained by treating the hydrogel with a kinase and ATP (at 50% conversion), and (III) the hydrogel of 630 restored by adding phosphatase. Adapted from ref (1254). Copyright 2006 American Chemical Society.
Figure 33
Figure 33
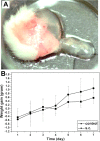
(A) Optical image of the hydrogel formed 1 h after subcutaneously injecting the solution of the precursor 631 into the mice. (B) Weight gain of the mice (n = 6, initial body weight 20 ± 2 g) after subcutaneously injecting 0.5 mL of 631 at 0.8 wt % concentration. A saline solution (0.5 mL) served as the control. Adapted from ref (1254). Copyright 2006 American Chemical Society.
Figure 34
Figure 34
(A) Structures of the precursor 632 and the hydrogelator 633 and the enzyme-catalyzed transformation. (B) TEM image of the nanofibers of 633. (C) Hydrogel formed by mixing blood, PBS buffer, and alkaline phosphatase. (D) Gel formed by mixing the solution of 632 (1.0 wt % in PBS buffer, pH 7.4), alkaline phosphatase, and the cytoplasm collected from 1.0 × 10⁶ broken HeLa cells. Adapted with permission from ref (1255). Copyright 2007 Wiley-VCH Verlag GmbH & Co. KGaA.
Figure 35
Figure 35
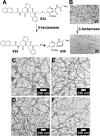
(A) Structures of the precursor 634 and the hydrogelator 635 and the β-lactamase-catalyzed transformation. (B) TEM images showing the enzymatic formation of nanofibers of 635: top, the solution, bottom, the gel. (C–F) Images showing formation of nanofibers of 635 in the lysates of E. coli that express different β-lactamases (C, CTX-M13; D, CTX-M14; E, SHV-1; F, TEM-1). Adapted from ref (159). Copyright 2007 American Chemical Society.
Scheme 81
Scheme 81. Molecular Structures of Representative Hydrogelators Formed via Enzymatic Transformation
Scheme 82
Scheme 82. Molecular Structures of Small Representative Hydrogelators Formed via Enzymatic Transformation
Figure 36
Figure 36
(A) An esterase to convert the precursor 653 to the hydrogelator 654. (B) TEM image of the nanofiber formed by 654 (inset: optical image of the hydrogel). MTT assays of (C) NIH/3T3 cells and (D) HeLa cells treated with 653 at concentrations of 0.08, 0.04, and 0.02 wt %. Adapted with permission from ref (1289). Copyright 2007 Wiley-VCH Verlag GmbH & Co. KGaA.
Figure 37
Figure 37
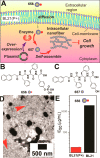
(A) A schematic representation of intracellular nanofiber formation and the inhibition of bacterial growth. (B, C) Structures and graphic representations of the precursor 656 and the corresponding hydrogelator 657. (D) TEM image of the nanofibers of 657 (indicated by arrows) formed inside the bacteria after culturing with 656. (E) Concentration of 656 needed to inhibit BL21(P+) and BL21 by forming nanofibers of 657 inside the bacteria. Adapted with permission from ref (1259). Copyright 2007 Wiley-VCH Verlag GmbH & Co. KGaA.
Scheme 83
Scheme 83. Some Precursors and Hydrogelators for Intracellular Self-Assembly
Figure 38
Figure 38
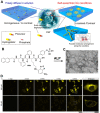
(A) Principle of imaging enzyme-instructed self-assembly inside cells. (B) Chemical structures of 658a. (C) TEM image of the hydrogel made of 658b. (D) Fluorescent confocal microscopy images showing the time course of fluorescence emission inside the HeLa cells incubated with 500 or 50 μM 658a in PBS buffer. Adapted with permission from ref (156). Copyright 2012 Nature Publish Group.
Figure 39
Figure 39
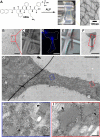
(A) Precursor 659a self-assembles to form nanofibers/hydrogels upon the addition of ALP. (B–I) Correlative light and electron microscopy (CLEM) images of HeLa cells incubated for 48 h with 500 μM 659a and 200 nM 660a. (B–E) Differential interference contrast (DIC) and fluorescence light microscopy images of treated HeLa cells growing on an Aclar plastic film. (F–I) TEM images of the cell of interest shown in (B)–(E). Adapted from ref (212). Copyright 2013 American Chemical Society.
Scheme 84
Scheme 84. Structures of Precursors That Are the Substrates of Ectophosphatases and the Corresponding Hydrogelators
Figure 40
Figure 40
(A) Overlaid images and (B) 3D stacked z-scan image of Congo red- and DAPI-stained HeLa cells after the incubation of the HeLa cell with 661a for 12 h. (C) TEM image of the pericellular hydrogels on the HeLa cells treated by 661a (280 μM). (D) Change of the relative amount of apoptosis signal molecules over time in HeLa cells treated by 661a (280 μM). (E) Cell viability of HeLa cells incubated with 661a (280 μM), 661b (280 μM), and 661a (280 μM) plus l-Phe (1.0 mM). (F) Illustration of enzyme-instructed self-assembly to form pericellular nanofibers/hydrogel and selectively induce cell death. Adapted with permission from ref (288). Copyright 2014 John Wiley and Sons. Adapted from ref (1256). Copyright 2014 American Chemical Society.
Figure 41
Figure 41
IC50 values of precursors and their hydrogelators on HeLa cells. F and Y indicate phenylalanine and tyrosine. Adapted from ref (1256). Copyright 2014 American Chemical Society.
Figure 42
Figure 42
(A) Chemical structures of precursors and hydrogelators made of a carbohydrate amphiphile. (B) Enzyme-instructed self-assembly for pericellular nanofiber formation/hydrogelation on Saos-2 cells. Adapted from ref (1285). Copyright 2015 American Chemical Society.
Figure 43
Figure 43
(A) Molecular structures of the precursors and the hydrogelators containing different fluorophores. (B) Illustration of the distinct spatial distribution of the small molecules in a cellular environment. Fluorescent confocal images of the HeLa cells incubated with 500 μM (C) 658a, (D) 664a, (E) 665a, and (F) 666a for 30 min. Adapted from ref (1063). Copyright 2013 American Chemical Society.
Figure 44
Figure 44
(a) Illustration of how enzyme-instructed molecular self-assembly induces cancer cell death. (b) Chemical structures of precursor ER-C16 (667) and hydrogelators G-C16 (668). Adapted from ref (894). Copyright 2015 American Chemical Society.
Figure 45
Figure 45
Illustration of the MHPB assay and hydrogel protein pull-down coupled with electrophoresis and tandem mass spectrometry for identifying cytosolic proteins that bind to supramolecular nanofibers. (A) Photoreaction of the hydrogelator and supramolecular nanofibers that bind with proteins. (B) Silver staining of the SDS–PAGE gel shows that different conditions alter the protein binding on the supramolecular hydrogel. Adapted with permission from ref (883). Copyright 2012 Royal Society of Chemistry.
Figure 46
Figure 46
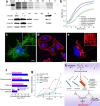
(a) Molecular hydrogel protein binding (MHPB) assay: upper panel, silver staining of SDS–PAGE reveals a major protein band at ∼55 kDa in lane B; lower panel, Western blot confirms the cytoskeletal proteins as the primary protein targets. (b) Tubulin polymerization assays with 3. (c–e) Confocal images showing the assemblies of 3 impede the dynamics of cytoskeletal proteins. (f) Cellular uptake of 3 in HeLa cells treated by endocytosis inhibitors. (g) Time-dependent activation of the apoptotic proteins of HeLa cells treated with 3. (h) Mechanism of the selective cytotoxicity of 3 toward cancer cells. Adapted with permission from ref (1248). Copyright 2014 American Society for Biochemistry and Molecular Biology. Adapted with permission from ref (1290). Copyright 2013 John Wiley and Sons.

References

    1. Lehn J. M. Perspectives in Supramolecular Chemistry - from Molecular Recognition Towards Molecular Information-Processing and Self-Organization. Angew. Chem., Int. Ed. Engl. 1990, 29, 1304–1319. 10.1002/anie.199013041. - DOI
    1. Whitesides G. M.; Mathias J. P.; Seto C. T. Molecular Self-Assembly and Nanochemistry - a Chemical Strategy for the Synthesis of Nanostructures. Science 1991, 254, 1312–1319. 10.1126/science.1962191. - DOI - PubMed
    1. Luisi P. L. Chemistry Constraints on The Origin of Life. Isr. J. Chem. 2015, 55, 906–918. 10.1002/ijch.201400177. - DOI
    1. Estroff L. A.; Hamilton A. D. Water Gelation by Small Organic Molecules. Chem. Rev. 2004, 104, 1201–1217. 10.1021/cr0302049. - DOI - PubMed
    1. Terech P.; Weiss R. G. Low Molecular Mass Gelators of Organic Liquids and the Properties of Their Gels. Chem. Rev. 1997, 97, 3133–3159. 10.1021/cr9700282. - DOI - PubMed

Publication types