. 2016 Sep:150:22-33.
doi: 10.1016/j.exer.2015.11.016. Epub 2015 Dec 2.

Early astrocyte redistribution in the optic nerve precedes axonopathy in the DBA/2J mouse model of glaucoma

Affiliations

Early astrocyte redistribution in the optic nerve precedes axonopathy in the DBA/2J mouse model of glaucoma

Melissa L Cooper et al. Exp Eye Res. 2016 Sep.

Abstract

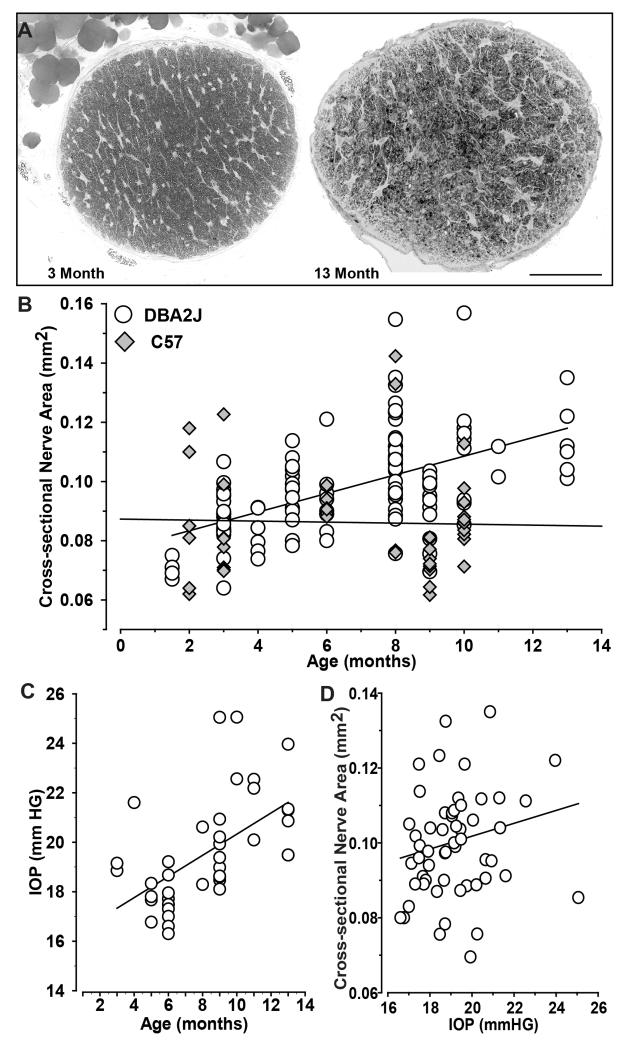
Glaucoma challenges the survival of retinal ganglion cell axons in the optic nerve through processes dependent on both aging and ocular pressure. Relevant stressors likely include complex interplay between axons and astrocytes, both in the retina and optic nerve. In the DBA/2J mouse model of pigmentary glaucoma, early progression involves axonopathy characterized by loss of functional transport prior to outright degeneration. Here we describe novel features of early pathogenesis in the DBA/2J nerve. With age the cross-sectional area of the nerve increases; this is associated generally with diminished axon packing density and survival and increased glial coverage of the nerve. However, for nerves with the highest axon density, as the nerve expands mean cross-sectional axon area enlarges as well. This early expansion was marked by disorganized axoplasm and accumulation of hyperphosphorylated neurofilamants indicative of axonopathy. Axon expansion occurs without loss up to a critical threshold for size (about 0.45-0.50 μm(2)), above which additional expansion tightly correlates with frank loss of axons. As well, early axon expansion prior to degeneration is concurrent with decreased astrocyte ramification with redistribution of processes towards the nerve edge. As axons expand beyond the critical threshold for loss, glial area resumes an even distribution from the center to edge of the nerve. We also found that early axon expansion is accompanied by reduced numbers of mitochondria per unit area in the nerve. Finally, our data indicate that both IOP and nerve expansion are associated with axon enlargement and reduced axon density for aged nerves. Collectively, our data support the hypothesis that diminished bioenergetic resources in conjunction with early nerve and glial remodeling could be a primary inducer of progression of axon pathology in glaucoma.

Keywords: Astrocyte; Axonopathy; Glaucoma; Gliosis; Neurodegeneration; Retinal ganglion cell.


Figures

Figure 1
Figure 1. Nerve size increases with age in DBA/2J mice
A. Cross-sections through 3 month (left) and 13 month (right) DBA/2J optic nerve about 0.2 mm proximal to the globe demonstrate different cross-sectional areas (0.083 vs. 0.11 mm2, respectively). Enlargement of the older nerve was accompanied by increased glial coverage and diminished axon packing. B. Cross-sectional area of individual DBA/2J optic nerves compared to C57 nerves across ages. DBA/2J nerve area increases with age (r = 0.54, p<0.001), while C57 does not (r = 0.03, p = 0.84). C. IOP (mmHG) increases with age across our sample (r = 0.57, p < 0.001) D. Nerve size tends to increase also with IOP in the DBA/2J, but this is not significant (r=0.19, p=0.17). Scale = 100 μm (A).
Figure 2
Figure 2. Increased nerve size is associated with pathology
A. High-magnification light micrograph of cross-section through a small four month DBA/2J optic nerve (0.068 mm2) demonstrates tight packing of axons (5.8 × 10⁵ axons/mm2) interspersed with thin astrocyte processes. B. A larger three month DBA/2J nerve (0.095mm2) with diminished axon packing (2.0 × 10⁵ axons/mm2) and increased astrocyte hypertrophy (arrowheads). Axons also appear larger. C. A 10 month nerve (0.093 mm2) with extensive gliosis and numerous degenerating axon profiles with multi-laminar myelin sheaths (*). D. Electron micrograph through same nerve in C highlights multi-laminar degenerating profiles (*). Scale = 5 μm (A, B, C) or 2 μm (D).
Figure 3
Figure 3. Quantification of axon pathology with nerve expansion
A. Axon density diminishes with nerve expansion (r = 0.39, p=0.009), while number of degenerating axon profiles (B) increases (r = 0.68, p=0.003). C. For each nerve, mean cross-sectional axon area also increases with nerve size (r = 0.50, p<0.001). D. Portion of each nerve covered by glial processes does not increase significantly with nerve size (r = 0.21, p=0.13).
Figure 4
Figure 4. Axons enlarge prior to degeneration
A. Low magnification electron micrograph of 4 month nerve with tight axonal packing (5.6 × 10⁵ axons/mm2), nerve area of 0.069 mm2, and mean axon area of 0.31 μm2. Arrowheads indicate ramifying astrocyte processes. B. Larger 9 month nerve (0.091 mm2) has larger mean axon area (0.40 μm2) but comparable density (6.0 × 10⁵ axons/mm2). C. Higher magnification electron micrograph of a small 9 month nerve (0.08 mm2) and mean axon area of 0.35 μm2. Axon density was 6.2 × 10⁵ axons/mm2. Mitochondria in axons and astrocyte processes (arrowheads) are indicated (m). D. Larger 9 month nerve (0.095 mm2) has expanded mean axon area of 0.41 μm2 but comparable axon density (6.0 × 10⁵ axons/mm2). E. High power image of nerve in C demonstrates well-ordered packing of neurofilaments and microtubules in axoplasm (dashed square) and prominent axolemma separating the axoplasm and myelin sheath (arrows). F. Enlarged axon from nerve in D shows disordered axoplasm, phagocytic vacuole (*) and little or no distinguishable axolemma. Scale = 5 μm (A, B), 0.5 μm (C, D) and 0.25 μm (E, F).
Figure 5
Figure 5. Axon expansion eventually leads to loss
Axon density vs. mean axon area for nerves ranging from the highest density group (top 20%) to the entire sample. Best-fitting linear regression is included for each group. Density and axon area become negatively correlated by the 70th percentile (r = −0.36, p=0.03). For each ranking, the average cross-sectional nerve area for the group is given.
Figure 6
Figure 6. Increased Axon Size is accompanied by astrocyte withdrawal
A. Light micrograph of cross-section through young (1.5 mo) DBA/2J optic nerve demonstrates tight packing of axons (5.2 × 10⁵ axons/mm2) separated by glial processes (arrowheads). Nerve area is 0.075 mm2 and mean axon area is 0.37 μm2. B. A 5 month nerve has similar axon density (5.1 × 10⁵ axons/mm2) but is larger (0.10 mm2) with increased axon area (0.46 μm2) and diminished astrocyte ramification (arrowheads). C. Electron micrograph of a small 9 month nerve (0.076 mm2) with axon density of 5.7 × 10⁵ axons/mm2 interspersed with glial processes (arrowheads). Mean cross-sectional area of axons was 0.28 μm2. D. Cross-section through same nerve as C with astrocyte processes labeled with antibodies against GFAP (red) and axons labeled for phosphorylated neurofilaments (pNF, green). E. A 9 month nerve with same axon density was larger (0.11 mm2) and had significantly expanded axon area (0.41 μm2) with less inter-axonal space. F. Immuno-labeling of same nerve demonstrates increased phosphorylated neurofilaments in axons and greatly reduced ramification of GFAP-labeled astrocytes. Scale = 5 μm (A, B), 1 μm (C, E) and 10 μm (D, F).
Figure 7
Figure 7. Method to quantify changes in glial distribution
A. Outline of an 11 month DBA/2J nerve (black) with high axon density and small axons (0.29 μm2) with glial processes highlighted (white). Twenty concentric divisions (red) from the outer edge to the center each delineate an area representing 5% of the nerve. Glial coverage appears nearly uniform from division to division. B. A 6 month DBA/2J nerve with larger mean axon size (0.33μm2) has a higher concentration of glial processes near the edge. C. For the nerve in A, distribution shows the fraction of each division covered by glia from the outer edge (division 1) to the center of the nerve (division 20). Dashed line shows the center of mass (CoM) for the distribution, which represents the location at which glial area is equivalent on either side. D. For the nerve in B, the CoM lies closer to the edge of the nerve, where more glial processes ramify and a greater fraction of each division’s area is covered.
Figure 8
Figure 8. Distribution of glial ramification changes as axons expand
Left: CoM (center of mass) for a subset of nerves with mean axon area below 0.50 μm2 (open symbols) decreases as axon size increases (r = −0.535, p = 0.002). The linear regression was similar for the subset of nerves with axon density > 5.0 × 10⁵ axons/mm2 (filled symbols; p = 0.32). Right: for the complete set of nerves with glial quantification, CoM increases with axon expansion (r = 0.32, p = 0.036). Regression line for nerves with axon area below 0.50 μm2 is repeated from the left panel for comparison (dashed line).
Figure 9
Figure 9. Mitochondrial density decreases as mean axon area increases
A. Electron micrograph of a small 4 month nerve (0.074 mm2) with axon density of 5.6 × 10⁵ axons/mm2. Note well-ordered packing of neurofilaments and microtubules in axoplasm and multiple mitochondria (m). Mean axon area is small (0.31 μm2). B. A 9 month nerve also has high axon density (6.0 × 10⁵ axons/mm2) but increased mean axon area (0.40 μm2) and nerve size (0.091 mm2). Micrograph shows fewer mitochondria. C. A larger 9 month nerve (0.10 mm2) with high axon density (5.6 × 10⁵ axons/mm2) has disordered axoplasm, few discernible mitochondria, and distended mesaxon compartments in several axons (arrowheads). Mean axon area is 0.40 μm2. D. In a sample of high-density nerves (5.2 – 6.2 × 10⁵ axons/mm2), mitochondrial density decreases as mean axon area increases (r = −0.831, p=0.003). Scale = 0.5 μm.
Figure 10
Figure 10. IOP is linked to axon expansion and survival for aged nerves
A. For a sample of aged (9-13 month) nerves, mean axon area expands with increasing IOP (r = 0.72, p < 0.001). Axon density (right panel) accordingly diminishes (r = −0.69, p = 0.002). B. For the same set of aged nerves, axon size also increases with nerve expansion (r = 0.57, p =0.01). Nerves from eyes with IOP ≥ 21 mmHG are indicated (filled circles). Nerve with largest axons (*) has been excluded from regression line. C. For the group of nerves with the highest axon densities (top 20%; 5.6 – 6.2 × 10⁵ axons/mm2), mean axon area increases with nerve expansion (r = 0.58, p = 0.01).

References

    1. Anderson MG, Smith RS, Hawes NL, Zabaleta A, Chang B, Wiggs JL, John SW. Mutations in genes encoding melanosomal proteins cause pigmentary glaucoma in DBA/2J mice. Nat Genet. 2002;30:81–5. - PubMed
    1. Baltan S, Inman DM, Danilov CA, Morrison RS, Calkins DJ, Horner PJ. Metabolic vulnerability disposes retinal ganglion cell axons to dysfunction in a model of glaucomatous degeneration. J Neurosci. 2010;30:5644–52. - PMC - PubMed
    1. Bosco A, Inman DM, Steele MR, Wu G, Soto I, Marsh-Armstrong N, Hubbard WC, Calkins DJ, Horner PJ, Vetter ML. Reduced retina microglial activation and improved optic nerve integrity with minocycline treatment in the DBA/2J mouse model of glaucoma. Invest Ophthalmol Vis Sci. 2008;49:1437–46. - PubMed
    1. Bosco, et al. this volume.
    1. Burgoyne CF. A biomechanical paradigm for axonal insult within the optic nerve head in aging and glaucoma. Ex Eye Res. 2011;93:120–32. - PMC - PubMed

Publication types