. 2015 Dec 8:2:150066.
doi: 10.1038/sdata.2015.66.

The climate hazards infrared precipitation with stations--a new environmental record for monitoring extremes

Affiliations

The climate hazards infrared precipitation with stations--a new environmental record for monitoring extremes

Chris Funk et al. Sci Data. .

Abstract

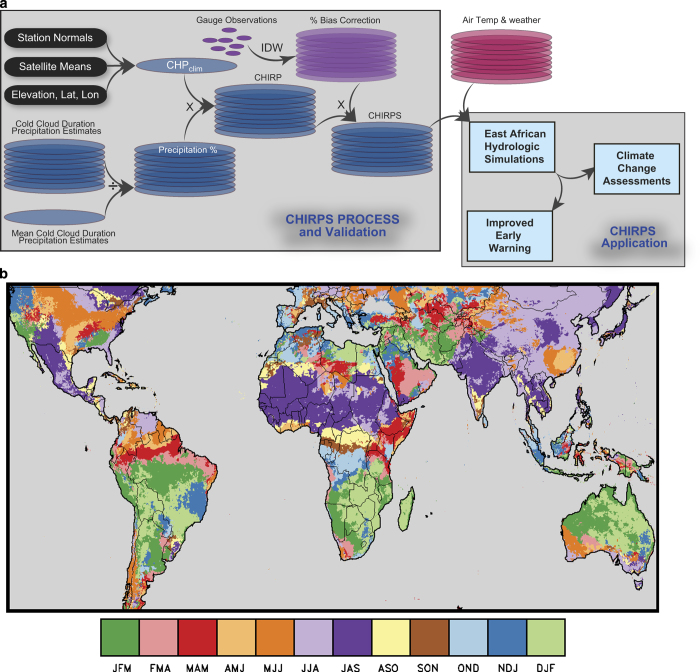
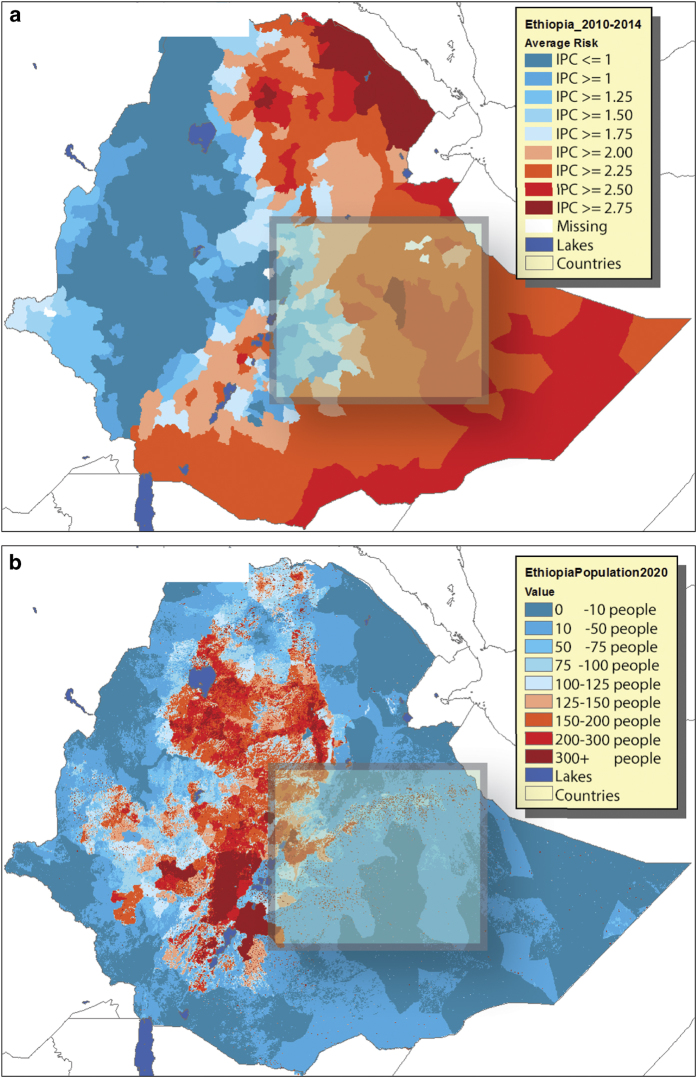
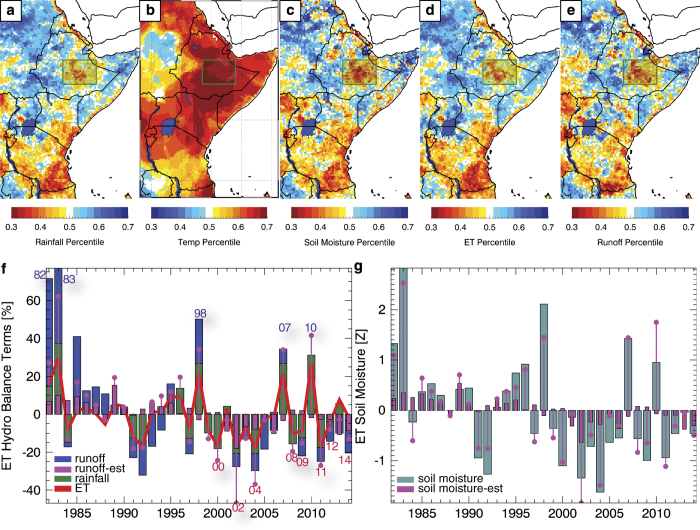
The Climate Hazards group Infrared Precipitation with Stations (CHIRPS) dataset builds on previous approaches to 'smart' interpolation techniques and high resolution, long period of record precipitation estimates based on infrared Cold Cloud Duration (CCD) observations. The algorithm i) is built around a 0.05° climatology that incorporates satellite information to represent sparsely gauged locations, ii) incorporates daily, pentadal, and monthly 1981-present 0.05° CCD-based precipitation estimates, iii) blends station data to produce a preliminary information product with a latency of about 2 days and a final product with an average latency of about 3 weeks, and iv) uses a novel blending procedure incorporating the spatial correlation structure of CCD-estimates to assign interpolation weights. We present the CHIRPS algorithm, global and regional validation results, and show how CHIRPS can be used to quantify the hydrologic impacts of decreasing precipitation and rising air temperatures in the Greater Horn of Africa. Using the Variable Infiltration Capacity model, we show that CHIRPS can support effective hydrologic forecasts and trend analyses in southeastern Ethiopia.


Conflict of interest statement

The authors declare no competing financial interests.

Figures

Figure 1
Figure 1. Overview of CHIRPS process and validation.
(a) CHIRPS production and application schema. (b) Map showing the wettest three month seasons based on CHPclim.
Figure 2
Figure 2. Maps of CHIRPS decorrelation distances.
(a) February. (b) August decorrelation distances.
Figure 3
Figure 3. Wet season validation results.
(af) Wet season bias based on comparison with 2000–2010 GPCC data. Bias is defined as the ratio between the mean of the validated product and mean GPCC precipitation. (g) Wet season correlations between the CHIRPS and GPCC (hl). Difference between the CHIRPS and GPCC correlation map (g) and the corresponding correlation maps with the other products and the GPCC.
Figure 4
Figure 4. Validation time series.
Results for Colombia (a,b), Peru (c,d), and SWNA (e,f).
Figure 5
Figure 5. Ethiopia food insecurity and population.
(a) Average 2010–2014 FEWS NET food insecurity status (Integrated Phase Classification) for Ethiopia. (b) 2020 Gridded Population of the World population estimates for Ethiopia, expressed as people per 2.5 arc-minute grid cell.
Figure 6
Figure 6. Ethiopia hydrologic simulation results.
(a) Average 1999–2014 October-September CHIRPS rainfall percentiles, based on a 1981–2014 baseline period. (b) Same for GISS air temperature anomalies. (ce) Same, but for VIC hydrologic model simulations. (f) 1981–2014 VIC runoff (blue bars), VIC evapotranspiration (red line) and CHIRPS rainfall (green bars). Purple dots show regression estimates of runoff based on annual rainfall and average air temperatures (cross-validated R2=0.63). Purple bars show estimates based solely on air temperature variations. Anomalous pluvials and droughts are indicated with years. (g) Standardized VIC soil moisture anomalies. Purple dots show regression estimates based on annual rainfall and temperatures (cross-validated R2=0.88); purple bars show estimates based solely on air temperature variations.
Figure 7
Figure 7. Climate composites (droughts minus pluvials) for the anomalous years noted in Fig. 6f.
(a) October-September MERRA 700 hPa geopotential heights and winds. (b) Standardized January-March NOAA Extended Reconstructed SSTs. (c) Standardized January-March GPCP precipitation. All composites screened for significance at P=0.1.
Figure 8
Figure 8. Estimates of Ethiopian soil moisture.
(a) Cross-validated forecasts of October-September SE Ethiopia soil moisture based on observed October-March soil moisture and observed January-March West Pacific SSTs. (b) 15-yr averages of SE Ethiopian October-September precipitation (blue bars), March-June rainfall (green line), GISS air temperatures (red line) and CMIP5 ensemble mean air temperature value (dark red line) with 95% confidence intervals. (c) Regression estimates of SE Ethiopian 15-yr averages of soil moisture based on observed rainfall and air temperatures from Fig. 8b (blue bars), based on GISS air temperatures only (red line) and on CenTrends rainfall only (green line). Also shown are the same regression estimates based on the CMIP5 ensemble average (dark red line) and 95% confidence interval spread.

Dataset use reported in

References

Data Citations

    1. Funk C. 2015. Climate Hazards Group. http://dx.doi.org/10.15780/G2RP4Q - DOI

References

    1. Love T. B., Kumar V., Xie P. & Thiaw W. A 20-year daily Africa precipitation climatology using satellite and gauge data. In Proceedings of the 84th AMS Annual Meeting, vol. Conference on Applied Climatology, Seattle, (2004)
    1. Xie P. & Arkin P. A. Global precipitation: A 17-year monthly analysis based on gauge observations, satellite estimates, and numerical model outputs. B Am Meteorol. Soc. 78, 2539–2558 (1997).
    1. Novella N. S. & Thiaw W. M. African rainfall climatology version 2 for famine early warning systems. Journal of Applied Meteorology and Climatology 52, 588–606 (2013).
    1. Abram N. J., Gagan M. K., Cole J. E., Hantoro W. S. & Mudelsee M. Recent intensification of tropical climate variability in the Indian Ocean. Nat. Geosci. 1, 849–853 (2008).
    1. Maidment R. I. et al. The 30 year TAMSAT African Rainfall Climatology And Time series (TARCAT) data set. Journal of Geophysical Research: Atmospheres 119, 10,619–610,644 (2014).

Publication types