Structural features determining thermal adaptation of esterases
- PMID: 26647400
- PMCID: PMC5943684
- DOI: 10.1093/protein/gzv061
Structural features determining thermal adaptation of esterases
Abstract
The adaptation of microorganisms to extreme living temperatures requires the evolution of enzymes with a high catalytic efficiency under these conditions. Such extremophilic enzymes represent valuable tools to study the relationship between protein stability, dynamics and function. Nevertheless, the multiple effects of temperature on the structure and function of enzymes are still poorly understood at the molecular level. Our analysis of four homologous esterases isolated from bacteria living at temperatures ranging from 10°C to 70°C suggested an adaptation route for the modulation of protein thermal properties through the optimization of local flexibility at the protein surface. While the biochemical properties of the recombinant esterases are conserved, their thermal properties have evolved to resemble those of the respective bacterial habitats. Molecular dynamics simulations at temperatures around the optimal temperatures for enzyme catalysis revealed temperature-dependent flexibility of four surface-exposed loops. While the flexibility of some loops increased with raising the temperature and decreased with lowering the temperature, as expected for those loops contributing to the protein stability, other loops showed an increment of flexibility upon lowering and raising the temperature. Preserved flexibility in these regions seems to be important for proper enzyme function. The structural differences of these four loops, distant from the active site, are substantially larger than for the overall protein structure, indicating that amino acid exchanges within these loops occurred more frequently thereby allowing the bacteria to tune atomic interactions for different temperature requirements without interfering with the overall enzyme function.
Keywords: esterase; molecular dynamics; psychrophilic, psychrotrophic, mesophilic, thermophilic bacteria; thermophilicity; thermostability.
© The Author 2015. Published by Oxford University Press.
Figures


 and
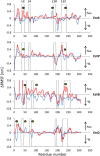
and  , respectively. Arrows at the right-hand side indicate an increase in inflexibility or rigidity.
Similar articles
-
Computational Analysis of Thermal Adaptation in Extremophilic Chitinases: The Achilles' Heel in Protein Structure and Industrial Utilization.Molecules. 2021 Jan 29;26(3):707. doi: 10.3390/molecules26030707. Molecules. 2021. PMID: 33572971 Free PMC article.
-
Thermozymes.Biotechnol Annu Rev. 1996;2:1-83. doi: 10.1016/s1387-2656(08)70006-1. Biotechnol Annu Rev. 1996. PMID: 9704095 Review.
-
A cold-active esterase enhances mesophilic properties through Mn2+ binding.FEBS J. 2023 May;290(9):2394-2411. doi: 10.1111/febs.16661. Epub 2022 Oct 30. FEBS J. 2023. PMID: 36266734
-
Structural and functional adaptations to extreme temperatures in psychrophilic, mesophilic, and thermophilic DNA ligases.J Biol Chem. 2003 Sep 26;278(39):37015-23. doi: 10.1074/jbc.M305142200. Epub 2003 Jul 10. J Biol Chem. 2003. PMID: 12857762
-
Proteins from hyperthermophiles: stability and enzymatic catalysis close to the boiling point of water.Adv Biochem Eng Biotechnol. 1998;61:37-85. doi: 10.1007/BFb0102289. Adv Biochem Eng Biotechnol. 1998. PMID: 9670797 Review.
Cited by
-
Discovery, Molecular Mechanisms, and Industrial Applications of Cold-Active Enzymes.Front Microbiol. 2016 Sep 9;7:1408. doi: 10.3389/fmicb.2016.01408. eCollection 2016. Front Microbiol. 2016. PMID: 27667987 Free PMC article. Review.
-
Roles of Active-Site Aromatic Residues in Cold Adaptation of Sphingomonas glacialis Esterase EstSP1.ACS Omega. 2017 Dec 8;2(12):8760-8769. doi: 10.1021/acsomega.7b01435. eCollection 2017 Dec 31. ACS Omega. 2017. PMID: 31457406 Free PMC article.
-
Activity-based assessment of an engineered hyperthermophilic protein as a capture agent in paper-based diagnostic tests.Mol Syst Des Eng. 2016 Dec 1;1(4):377-381. doi: 10.1039/C6ME00032K. Epub 2016 Jun 29. Mol Syst Des Eng. 2016. PMID: 28451464 Free PMC article.
-
Structural flexibility and protein adaptation to temperature: Molecular dynamics analysis of malate dehydrogenases of marine molluscs.Proc Natl Acad Sci U S A. 2018 Feb 6;115(6):1274-1279. doi: 10.1073/pnas.1718910115. Epub 2018 Jan 22. Proc Natl Acad Sci U S A. 2018. PMID: 29358381 Free PMC article.
-
Covalent Inhibitors from Saudi Medicinal Plants Target RNA-Dependent RNA Polymerase (RdRp) of SARS-CoV-2.Viruses. 2023 Oct 30;15(11):2175. doi: 10.3390/v15112175. Viruses. 2023. PMID: 38005857 Free PMC article.
References
-
- Aguilar C.F., Sanderson I., Moracci M., Ciaramella M., Nucci R., Rossi M., Pearl L.H. (1997) J. Mol. Biol., 271, 789–802. - PubMed
-
- Argos P., Rossman M.G., Grau U.M., Zuber H., Frank G., Tratschin J.D. (1979) Biochemistry, 18, 5698–5703. - PubMed
-
- Arnold F.H. (2009) Cold Spring Harb. Symp. Quant. Biol., 74, 41–46. - PubMed
-
- Asial I., Cheng Y.X., Engman H., Dollhopf M., Wu B., Nordlund P., Cornvik T. (2013) Nat. Commun., 4, 2901. - PubMed
Publication types
MeSH terms
Substances
LinkOut - more resources
Full Text Sources
Other Literature Sources

