

Quantifying replicative senescence as a tumor suppressor pathway and a target for cancer therapy
- PMID: 26647820
- PMCID: PMC4673423
- DOI: 10.1038/srep17660
Quantifying replicative senescence as a tumor suppressor pathway and a target for cancer therapy
Abstract
To study quantitatively replicative senescence as a tumor suppressor mechanism, we investigate the distribution of a growing clonal cell population restricted by Hayflick's limit. We find that in the biologically relevant range of parameters, if the imbalance between cell division and death is moderate or low (high death-to-birth ratio), senescence offers significant protection against cancer by halting abnormal cell proliferation at early pre-diagnostic stages of tumor development. We also find that by the time tumors are typically detected, there is a high probability that telomerase is activated, even if the cell of origin was telomerase negative. Hence, the fact that most cancers are positive for telomerase is not necessarily an indication that cancer originated in a telomerase positive cell. Finally, we discuss how the population dynamics of cells can determine the outcomes of anti-telomerase cancer therapies, and provide guidelines on how the model could potentially be applied to develop clinically useful tools to predict the response to treatment by telomerase inhibitors in individual patients.
Figures
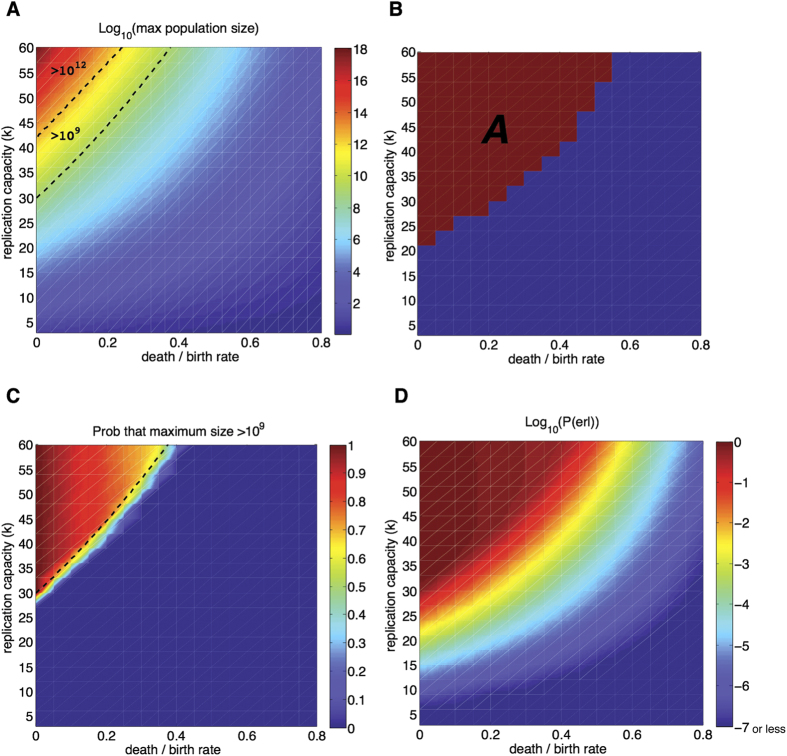
 as a function of the replication capacity (k) and the death-to-birth ratio (r) of the originating cell. Dashed lines indicate the regions where the maximum population is greater than 109 cells (detection threshold) and 1012 cells (lethal burden). See text for discussion. (B) Region A identifies parameters for which the expected maximum population size is greater than 106. (C) Heat map: Probability that the maximum population size is greater than 109. Dashed line: region where the maximum size of the expected cell population,
  , is greater than 109. (D) Heat map of the probability of escaping replication limits as a function of the replication capacity of the originating cell and the death-to-birth ratio. The value of P(erl) is estimated as the midpoint between the upper and lower bounds in Eq. 9. Results based on 104 simulations per point.
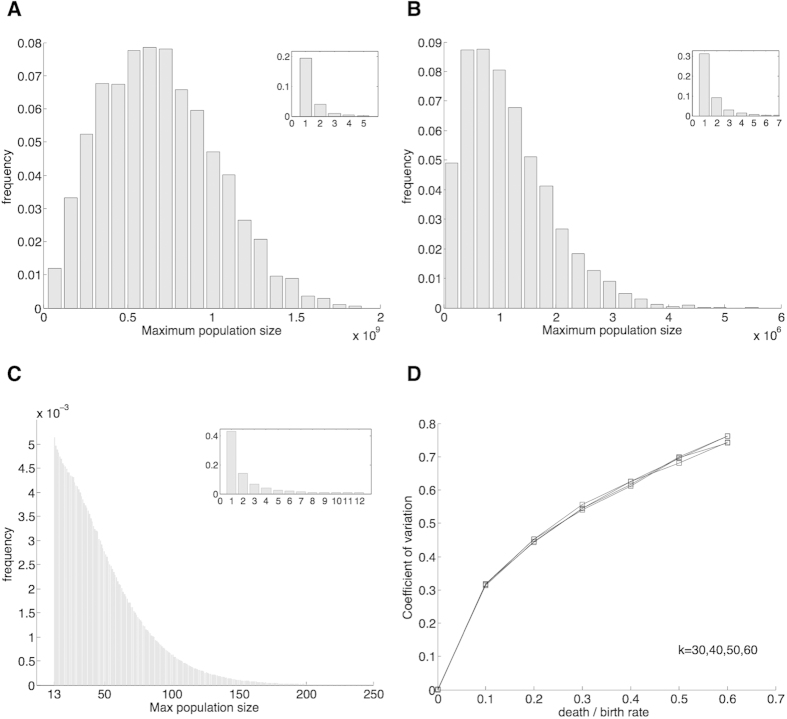
 equaled 12 (last value in the inset) is more than the frequency of times that
  equaled 13 (first value in the major axes). (D) Coefficient of variation for samples in which the cell population reaches a large size. Number of simulations: 104 in panels (A,B,D); 107 in panel (C).
References
-
- Hayflick L. The limited in vitro lifetime of human diploid cell strains. Exp Cell Res 37, 614–36 (1965). - PubMed
-
- Shay J. W. & Wright W. E. Senescence and immortalization: role of telomeres and telomerase. Carcinogenesis 26, 867–74 (2005). - PubMed
-
- Collado M., Blasco M. A. & Serrano M. Cellular senescence in cancer and aging. Cell 130, 223–33 (2007). - PubMed
MeSH terms
Substances
LinkOut - more resources
Full Text Sources
Other Literature Sources
