. 2015 Dec 9:5:17187.
doi: 10.1038/srep17187.

Capturing complex tumour biology in vitro: histological and molecular characterisation of precision cut slices

Affiliations

Capturing complex tumour biology in vitro: histological and molecular characterisation of precision cut slices

Emma J Davies et al. Sci Rep. .

Abstract

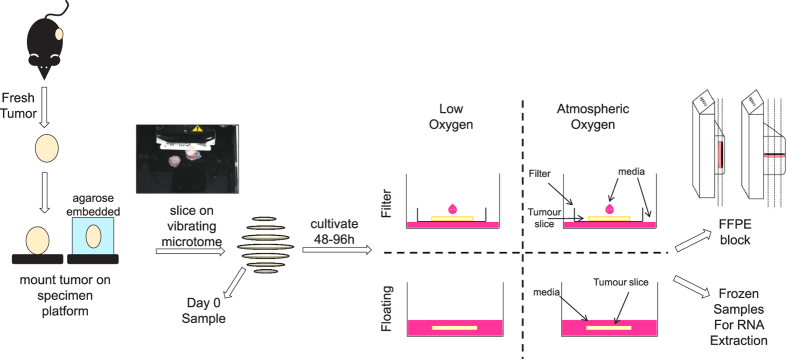
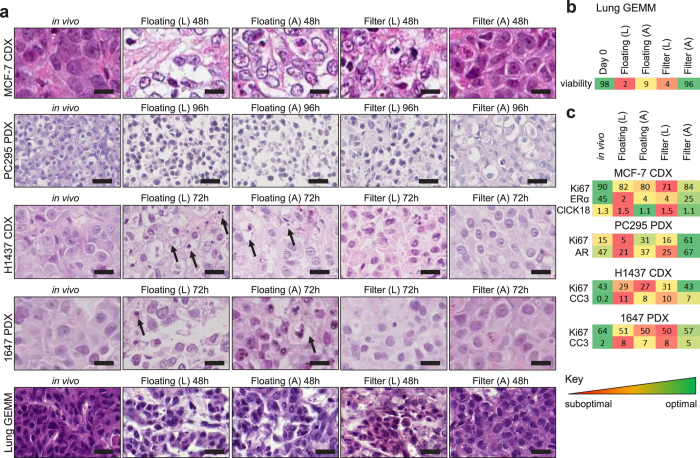
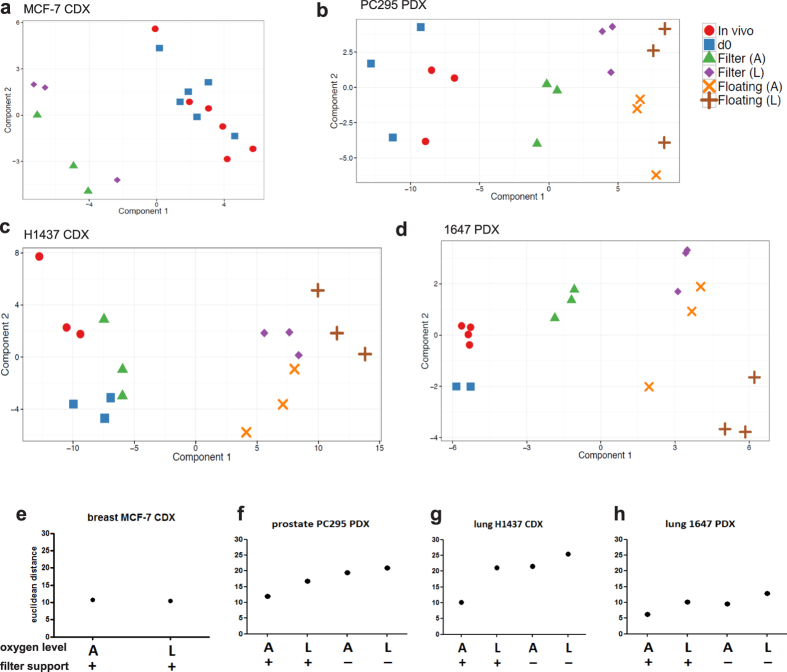
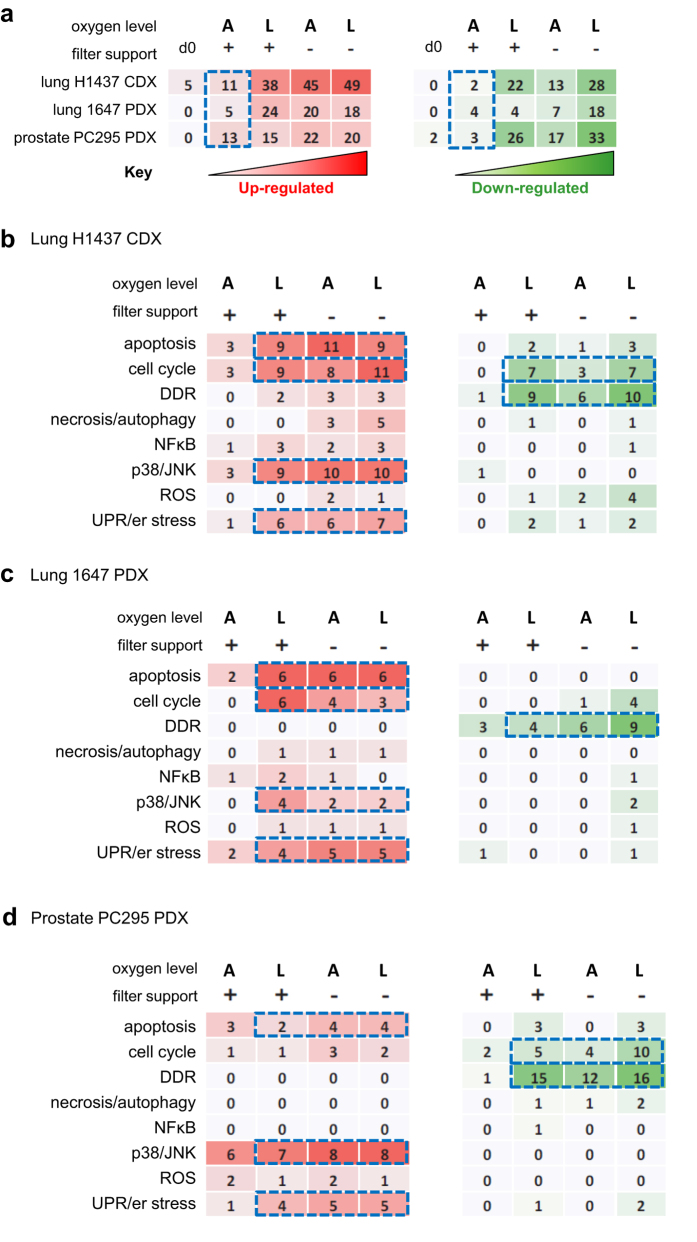
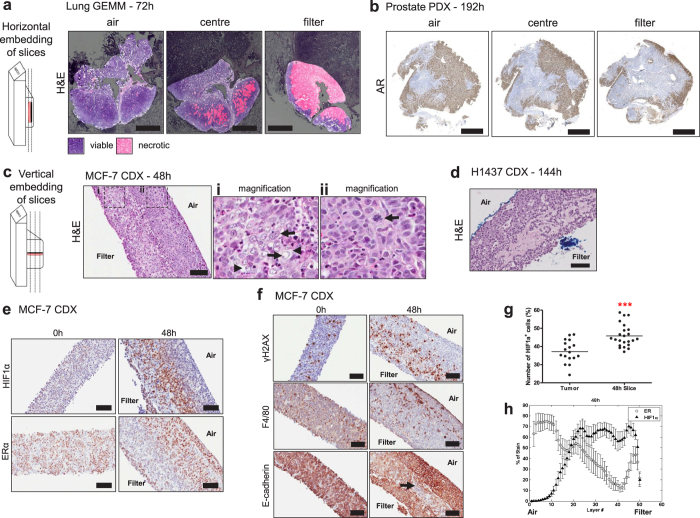
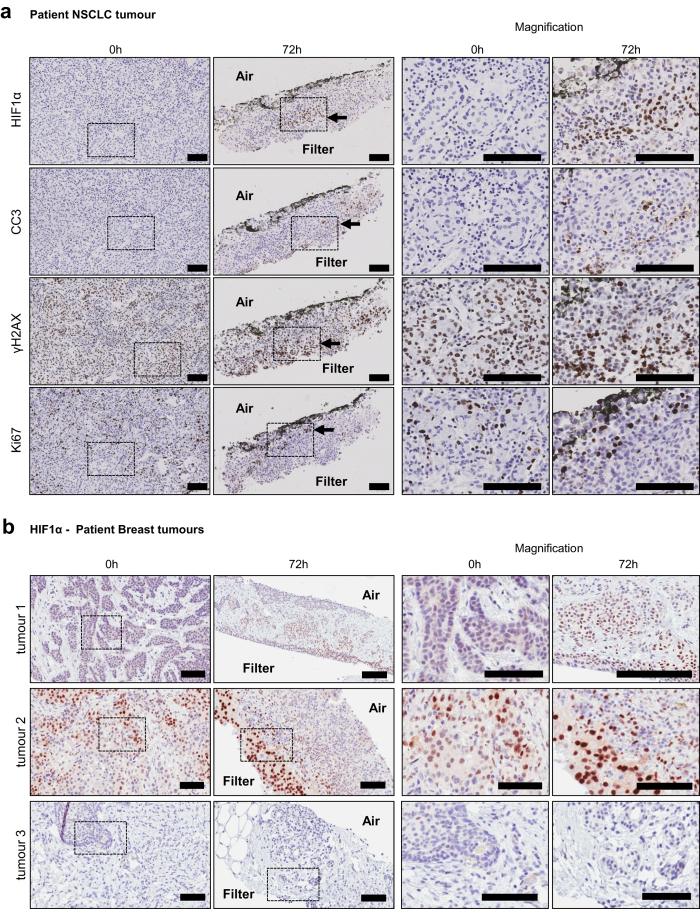
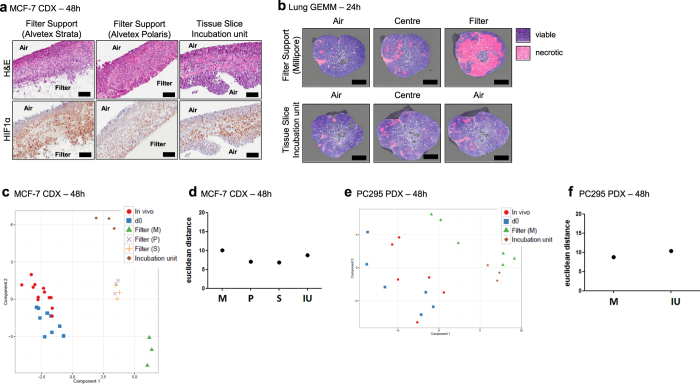
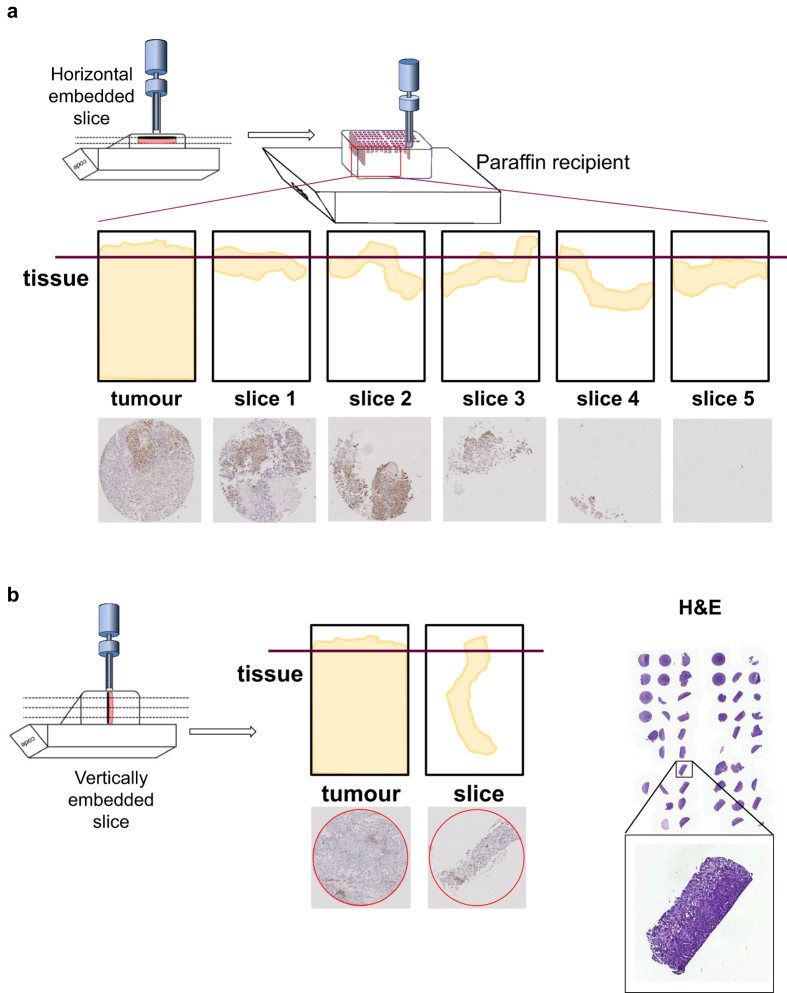
Precision-cut slices of in vivo tumours permit interrogation in vitro of heterogeneous cells from solid tumours together with their native microenvironment. They offer a low throughput but high content in vitro experimental platform. Using mouse models as surrogates for three common human solid tumours, we describe a standardised workflow for systematic comparison of tumour slice cultivation methods and a tissue microarray-based method to archive them. Cultivated slices were compared to their in vivo source tissue using immunohistochemical and transcriptional biomarkers, particularly of cellular stress. Mechanical slicing induced minimal stress. Cultivation of tumour slices required organotypic support materials and atmospheric oxygen for maintenance of integrity and was associated with significant temporal and loco-regional changes in protein expression, for example HIF-1α. We recommend adherence to the robust workflow described, with recognition of temporal-spatial changes in protein expression before interrogation of tumour slices by pharmacological or other means.


Figures

Figure 1
Figure 1. Tumour tissue slice culture workflow.
Fresh tumours were harvested from the mice and mounted on a tumour specimen platform, either directly or mounted in agarose. The Leica VT1200S vibrating microtome was used to cut slices of 200–300 μm in thickness. Some sliced samples were fixed and frozen at day 0 prior to cultivation and the remainder were cultivated. Experiments were performed to compare the impact of filter supports and oxygen levels on tissue viability, which was estimated using either histological, immunohistochemical or RNA transcript-based biomarkers. Slices were sectioned both horizontally and vertically for analysis of morphology and of protein expression by immunohistochemistry.
Figure 2
Figure 2. Histopathology of cultivated tumour slices.
(a) High power images of H&E stained tumour tissue slice sections, representing each tumour model cultivated under different conditions, compared to a stained section of the original in vivo tumour (CDX = cell line-derived xenograft; PDX  = patient-derived tumour; GEMM  = genetically engineered mouse model). Rows H1437 CDX and 1647 PDX: arrows indicate condensed nuclei (apoptosis) and vaculated regions. Representative images from at least three experiments are shown. Scale bars represent 25 μm. (b) Heatmap of the percentage of viable tissue in NSCLC GEMM tumour slices determined by the algorithm described in the Methods. (c) Heatmaps representing the percentage of positive cells expressing viability markers by immunohistochemistry (IHC) of slices cultured under different conditions (numbers in heatmap boxes represent the percentage of positive cells for each biomarker). Key to conditions: A – atmospheric oxygen, L – low oxygen. Ki67, indicating proliferation; ClCK18, cleaved cytokeratin 18 indicating apoptosis; ERα, estrogen receptor-alpha; AR, androgen receptor; CC3, cleaved caspase 3. The values reflect means from three independent experiments.
Figure 3
Figure 3. Evaluation, by Principal Component Analysis (PCA), of the changes in stress biomarkers observed under different conditions of slice culture.
(ad) PCA plots of the expression of each of the 134 stress genes quantified under different conditions of slice culture. (eh) Scatterplots of the Euclidean distance of stress gene biomarker expression profiles of tumour slices compared to the expression profiles of the corresponding in vivo tumours. Key: A- atmospheric oxygen; L-low oxygen; +  = cultivation with a filter support; − = cultivation without a filter support. Results are from three independent experiments.
Figure 4
Figure 4. Pathway changes induced by tumour slice culture.
(a) Table showing the numbers of differentially expressed genes (DEGs) in prostate and lung models cultivated under different conditions. (bd) Tables showing the numbers of DEGs under each cultivation condition and their associated functions for both of the lung tumour models and the prostate tumour model. Key: A- atmospheric oxygen, L-low oxygen, + cultivated with a filter support, –cultivated without a filter support, red  = increases in expression; green = decreases in expression. Results are from 3 independent experiments.
Figure 5
Figure 5. Loco-regional changes in IHC biomarkers in tumour slices cultivated under optimal conditions (filter support, atmospheric oxygen).
(a) Lung GEMM tumour slices, horizontally embedded, were found to contain large areas of necrosis at the filter interface of the slice. Scale bars represent 1000 μm. (b) AR staining revealed that AR positive cells were in abundance at the air interface in prostate PDX tumour slices and were greatly reduced at the filter interface. Scale bars represent 1250 μm. (c) H&E stained sections of vertically embedded MCF-7 CDX tumour tissue slices. Images show differences in tissue morphology dependent on their proximity to the air interface of the slice. (i) Arrows: areas of necrosis; arrowheads, vacuolated regions (ii) Arrow: mitotic figure. (d) H&E stained section of vertically embedded H1437 CDX tumour slice, showing similar morphology to that observed in MCF-7 tumour slices. (e) Immunohistochemical staining of HIF1α in MCF-7 tumour slices showed an accumulation of nuclear protein at the filter interface of the slice, and immunohistochemical staining of ER, which showed a reduction in staining at the filter interface. Scale bars represent 100 μm. (f) Immunohistochemical staining for γH2AX indicated an abundance of foci at the filter interface. F4/80 immunohistochemical staining showed that there was a propensity for F4/80 positive macrophages to be found closest to the air interface. Membranous E-cadherin was present at both the filter and air interfaces. Scale bars represent 100 μm. (g) The variability of HIF1α expression observed in MCF-7 CDX tumours in vivo compared with that in MCF-7 slices after 48 h (n = 17 tumours, 23 slices, ***p value < 0.0001) (h) The spatial distribution of HIF1α and ER across the thickness of the slice was quantified using a segmentation algorithm (see Methods). Each slice image was divided into 50 layers, 0 representing the layer closest to the air interface and 50 closest to the filter interface. Error bars represent standard deviation, n = 7 cultivated slices from three tumours.
Figure 6
Figure 6. Observations made in murine CDX and PDX tumours were confirmed in patient tumour samples.
(a) A NSCLC tumour from a patient was obtained, sliced and cultivated on filters for 72 h following the standard workflow. After this time, induction of HIF1α was observed at the filter interface of the slice. This was coincident with increased cleaved caspase 3 (CC3) and γH2AX staining. Conversely, Ki67 positive cells were found at the air interface. (b) The induction of HIF1α at the filter interface was also observed in breast tumour slices prepared from samples of patient tumours. Slices from tumours 1 and 2 show a clear accumulation of HIF1α at the filter interface, while slices from tumour 3 did not develop an accumulation of HIF1α after 72 h. Scale bars represent 100 μm.
Figure 7
Figure 7. Comparison of slice support materials and slice incubation cultivation systems.
(a) H&E stained and HIF1α immuno stained sections of MCF-7 CDX tumour slices cultivated using an adherent filter support with a 5 μm pore size (Alvetex Strata), a 0.4 μm pore size (Alvetex Polaris) and using a tissue slice incubation unit supported by titanium grids, which were periodically rotated into the media and air (see Methods). (b) H&E stained sections of Lung GEMM tumour slices annotated for regions of necrosis in slices cultivated using Millipore filters and a tissue slice incubation unit. Pink shaded areas indicate necrosis. (cf) PCA plot of the stress gene biomarker expression profiles and corresponding euclidean distance scatterplots of MCF-7 CDX and PC-295 PDX tumour slices cultivated using different support methods. Scale bars represent 100 μm. Key: M  = Millipore Filter, P = Alvetex Polaris Filter, S = Alvetex Strata Filter, IU = Tissue slice incubation unit. Results are from three independent experiments.
Figure 8
Figure 8. Tissue Micro Array (TMA) workflow for the archiving of tissue slice material.
(a) Schematic diagram of the generation of TMAs from horizontally embedded tumour slices, and the resultant incomplete tissue sections from these blocks. (b) Schematic diagram of the generation of TMAs from vertically embedded tumour slices, and the improvement in achieving consistent and complete tissue sections from these blocks.

References

    1. Bissell M. J. & Radisky D. Putting tumours in context. Nat Rev Cancer 1, 46–54, doi: 10.1038/35094059 (2001). - DOI - PMC - PubMed
    1. Egeblad M., Nakasone E. S. & Werb Z. Tumours as Organs: Complex Tissues that Interface with the Entire Organism. Dev Cell 18, 884–901, doi: 10.1016/j.devcel.2010.05.012 (2010). - DOI - PMC - PubMed
    1. McMillin D. W., Negri J. M. & Mitsiades C. S. The role of tumour-stromal interactions in modifying drug response: challenges and opportunities. Nat Rev Drug Discov 12, 217–228, doi: nrd387010.1038/nrd3870 (2013). - PubMed
    1. Junttila M. R. & de Sauvage F. J. Influence of tumour micro-environment heterogeneity on therapeutic response. Nature 501, 346–354, doi: nature1262610.1038/nature12626 (2013). - PubMed
    1. Wilding J. L. & Bodmer W. F. Cancer cell lines for drug discovery and development. Cancer Res 74, 2377–2384, doi: 0008-5472.CAN-13-297110.1158/0008-5472.CAN-13-2971 (2014). - PubMed

Publication types