. 2016 Dec;19(17):3216-3231.
doi: 10.1017/S1368980015003511. Epub 2015 Dec 9.

The potential impact of Supplemental Nutrition Assistance Program (SNAP) restrictions on expenditures: a systematic review

Affiliations

The potential impact of Supplemental Nutrition Assistance Program (SNAP) restrictions on expenditures: a systematic review

Joel Cuffey et al. Public Health Nutr. 2016 Dec.

Abstract

Objective: To systematically review the potential impact of reducing the set of Supplemental Nutrition Assistance Program (SNAP)-eligible foods (e.g. not allowing purchase of sugar-sweetened beverages with SNAP benefits) on expenditures for restricted foods.

Design: The impact on food expenditures of a $US 1 reduction in available SNAP benefits can be used to estimate the impact of restrictions on SNAP-eligible foods. An electronic search of EconPapers, AgEcon Search, EconLit, WorldCat, ProQuest Dissertations and Theses, PubMed and NALDC, and a snowball search were conducted to obtain a sample of studies up to March 2015 that estimate the impacts of SNAP and other income on household food expenditures. The studies were classified according to study population, study design and whether they attempted to correct for major study design biases.

Setting: Estimates were extracted from fifty-nine published and unpublished studies.

Subjects: US households.

Results: Fifty-nine studies were found, yielding 123 estimates of the impact of SNAP benefits on food expenditures and 117 estimates of the difference in impacts between SNAP benefits and other income. Studies correcting for or mitigating study design biases had less estimate variation. Estimates indicate that expenditures on the restricted item would decrease by $US 1·6 to $US 4·8 if $US 10 of SNAP benefits would have otherwise been spent, with a median overall impact of $US 3.

Conclusions: The present literature suggests that restrictions on SNAP-eligible items may result in a small but potentially meaningful decrease in SNAP expenditures for restricted items. Further research is needed to evaluate whether this would translate into improvements in diet quality.

Keywords: Food expenditures; Policy; SNAP restrictions; Supplemental Nutrition Assistance Program/food stamps.


Figures

Fig. 1
Fig. 1
Selection process flowchart
Fig. 2
Fig. 2
Box-and-whisker plots of effect sizes according to research design. The left and right edges of the box represent the first and third quartiles (interquartile range); the line within the box represents the median; the left and right whiskers represent the minimum and maximum values; outliers are excluded. (MPSFS, marginal propensity to spend on food out of food stamps; MPSInc, marginal propensity to spend on food out of normal income)
Fig. 3
Fig. 3
Comparison of MPSFS between studies using the San Diego Cashout Demonstration data (SP); the Panel Study of Income Dynamics using data for all households (PA), SNAP participants (PP) or other households (PO); the Nationwide Food Consumption Survey – Low Income supplement using SNAP-eligible households (NE); the Consumer Expenditure Survey Diary data using all households (CA), SNAP-eligible households (CE) and SNAP participants (CP); and other data sets using all households (OA), SNAP-eligible households (OE), SNAP participants (OP) and other households (OO). (MPSFS, marginal propensity to spend on food out of food stamps; SNAP, Supplemental Nutrition Assistance Program)
Fig. 4
Fig. 4
Comparison of MPSFS – MPSInc between studies using the San Diego Cashout Demonstration data (SP); the Panel Study of Income Dynamics using data for all households (PA), SNAP participants (PP) or other households (PO); the Nationwide Food Consumption Survey – Low Income supplement using SNAP-eligible households (NE); the Consumer Expenditure Survey Diary data using all households (CA), SNAP-eligible households (CE) and SNAP participants (CP); and other data set using all households (OA), SNAP-eligible households (OE), SNAP participants (OP) and other households (OO). (MPSFS, marginal propensity to spend on food out of food stamps; MPSInc, marginal propensity to spend on food out of normal income; SNAP, Supplemental Nutrition Assistance Program)
Fig. 5
Fig. 5
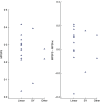
Comparison of effect sizes between studies that account for the difference between unconstrained and constrained households by either restricting the sample to just unconstrained households (R) or incorporating the difference in the statistical model (M). (MPSFS, marginal propensity to spend on food out of food stamps; MPSInc, marginal propensity to spend on food out of normal income)
Fig. 6
Fig. 6
Comparison of MPSFS between participant/non-participant studies that correct for sample selection and those that do not. (MPSFS, marginal propensity to spend on food out of food stamps)
Fig. 7
Fig. 7
Comparison of effect sizes between non-cashout dose–response studies using a sample of only food stamp participants (P), participants and others without sample bias correction (NC), and participants and others with sample bias correction (C). (MPSFS, marginal propensity to spend on food out of food stamps; MPSInc, marginal propensity to spend on food out of normal income)
Fig. 8
Fig. 8
Comparison of effect sizes between non-cashout dose–response studies without sample bias that use the linear, Senauer and Young (SY), or other flexible functional form. (MPSFS, marginal propensity to spend on food out of food stamps; MPSInc, marginal propensity to spend on food out of normal income)
Fig. 9
Fig. 9
Comparison of effect sizes between cashout dose–response studies that use the linear, Senauer and Young (SY), or other flexible functional form. (MPSFS, marginal propensity to spend on food out of food stamps; MPSInc, marginal propensity to spend on food out of normal income)

References

    1. Larson N & Story M (2011) Food insecurity and weight status among US children and families: a review of the literature. Am J Prev Med 40, 166–173. - PubMed
    1. Leung C, Willett W & Ding E (2012) Low-income Supplemental Nutrition Assistance Program participation is related to adiposity and metabolic risk factors. Am J Clin Nutr 95, 17–24. - PMC - PubMed
    1. Cole N & Fox M (2008) Diet Quality of Americans by Food Stamp Participation Status: Data from the National Health and Nutrition Examination Survey, 1999–2004. Nutrition Assistance Program Report no. FSP-08-NH. Alexandria, VA: Office of Research, Nutrition and Analysis, Food and Nutrition Service, USDA.
    1. US Government Accountability Office (2008) Food Stamp Program: Options for Delivering Financial Incentives to Participants for Purchasing Targeted Foods. Report no. GAO-08-415. Washington, DC: GAO.
    1. Alston J, Mullally C, Sumner D et al.. (2009) Likely effects on obesity from proposed changes to the US Food Stamp Program. Food Policy 34, 176–184.

Publication types